Darnley Airbnb Market Analysis 2025: Short Term Rental Data & Vacation Rental Statistics in Prince Edward Island, Canada
Is Airbnb profitable in Darnley in 2025? Explore comprehensive Airbnb analytics for Darnley, Prince Edward Island, Canada to uncover income potential. This 2025 STR market report for Darnley, based on AirROI data from April 2024 to March 2025, reveals key trends in the niche market of 41 active listings.
Whether you're considering an Airbnb investment in Darnley, optimizing your existing vacation rental, or exploring rental arbitrage opportunities, understanding the Darnley Airbnb data is crucial. Navigating the high regulation landscape is key to maximizing your short term rental income potential. Let's dive into the specifics.
Key Darnley Airbnb Performance Metrics Overview
Monthly Airbnb Revenue Variations & Income Potential in Darnley (2025)
Understanding the monthly revenue variations for Airbnb listings in Darnley is key to maximizing your short term rental income potential. Seasonality significantly impacts earnings. Our analysis, based on data from the past 12 months, shows that the peak revenue month for STRs in Darnley is typically July, while February often presents the lowest earnings, highlighting opportunities for strategic pricing adjustments during shoulder and low seasons. Explore the typical Airbnb income in Darnley across different performance tiers:
- Best-in-class properties (Top 10%) achieve $4,975+ monthly, often utilizing dynamic pricing and superior guest experiences.
- Strong performing properties (Top 25%) earn $3,634 or more, indicating effective management and desirable locations/amenities.
- Typical properties (Median) generate around $2,705 per month, representing the average market performance.
- Entry-level properties (Bottom 25%) see earnings around $1,669, often with potential for optimization.
Average Monthly Airbnb Earnings Trend in Darnley
Darnley Airbnb Occupancy Rate Trends (2025)
Maximize your bookings by understanding the Darnley STR occupancy trends. Seasonal demand shifts significantly influence how often properties are booked. Typically, Augustsees the highest demand (peak season occupancy), while December experiences the lowest (low season). Effective strategies, like adjusting minimum stays or offering promotions, can boost occupancy during slower periods. Here's how different property tiers perform in Darnley:
- Best-in-class properties (Top 10%) achieve 86%+ occupancy, indicating high desirability and potentially optimized availability.
- Strong performing properties (Top 25%) maintain 67% or higher occupancy, suggesting good market fit and guest satisfaction.
- Typical properties (Median) have an occupancy rate around 50%.
- Entry-level properties (Bottom 25%) average 30% occupancy, potentially facing higher vacancy.
Average Monthly Occupancy Rate Trend in Darnley
Average Daily Rate (ADR) Airbnb Trends in Darnley (2025)
Effective short term rental pricing strategy in Darnley involves understanding monthly ADR fluctuations. The Average Daily Rate (ADR) for Airbnb in Darnley typically peaks in July and dips lowest during October. Leveraging Airbnb dynamic pricing tools or strategies based on this seasonality can significantly boost revenue. Here's a look at the typical nightly rates achieved:
- Best-in-class properties (Top 10%) command rates of $257+ per night, often due to premium features or locations.
- Strong performing properties (Top 25%) achieve nightly rates of $228 or more.
- Typical properties (Median) charge around $191 per night.
- Entry-level properties (Bottom 25%) earn around $151 per night.
Average Daily Rate (ADR) Trend by Month in Darnley
Get Live Darnley Market Intelligence 👇

Explore Real-time Analytics
Airbnb Seasonality Analysis & Trends in Darnley (2025)
Peak Season (July, August, June)
- Revenue averages $4,574 per month
- Occupancy rates average 64.0%
- Daily rates average $215
Shoulder Season
- Revenue averages $2,490 per month
- Occupancy maintains around 49.2%
- Daily rates hold near $196
Low Season (January, February, December)
- Revenue drops to average $1,642 per month
- Occupancy decreases to average 34.8%
- Daily rates adjust to average $197
Seasonality Insights for Darnley
- The Airbnb seasonality in Darnley shows highly seasonal trends requiring careful strategy. While the sections above show seasonal averages, it's also insightful to look at the extremes:
- During the high season, the absolute peak month showcases Darnley's highest earning potential, with monthly revenues capable of climbing to $5,311, occupancy reaching a high of 73.6%, and ADRs peaking at $219.
- Conversely, the slowest single month of the year, typically falling within the low season, marks the market's lowest point. In this month, revenue might dip to $1,435, occupancy could drop to 29.4%, and ADRs may adjust down to $193.
- Understanding both the seasonal averages and these monthly peaks and troughs in revenue, occupancy, and ADR is crucial for maximizing your Airbnb profit potential in Darnley.
Seasonal Strategies for Maximizing Profit
- Peak Season: Maximize revenue through premium pricing and potentially longer minimum stays. Ensure high availability.
- Low Season: Offer competitive pricing, special promotions (e.g., extended stay discounts), and flexible cancellation policies. Target off-season travelers like remote workers or budget-conscious guests.
- Shoulder Seasons: Implement dynamic pricing that balances peak and low rates. Target weekend travelers or specific events. Offer slightly more flexible terms than peak season.
- Regularly analyze your own performance against these Darnley seasonality benchmarks and adjust your pricing and availability strategy accordingly.
Best Areas for Airbnb Investment in Darnley (2025)
Exploring the top neighborhoods for short-term rentals in Darnley? This section highlights key areas, outlining why they are attractive for hosts and guests, along with notable local attractions. Consider these locations based on your target guest profile and investment strategy.
| Neighborhood / Area | Why Host Here? (Target Guests & Appeal) | Key Attractions & Landmarks |
|---|---|---|
| Darnley Beach | A serene and beautiful beach area known for its stunning coastal views and quiet atmosphere. Ideal for families and those looking for a peaceful getaway. | Darnley Beach, Prince Edward Island National Park, North Rustico Harbour, Stanhope Beach, Brackley Beach |
| Cavendish | Famous for its beautiful beaches and as the home of Anne of Green Gables. A highly sought-after tourist destination with many attractions. | Green Gables House, Cavendish Beach, Prince Edward Island National Park, Cavendish Boardwalk, Ripley's Believe It or Not! |
| Bedeque | A quaint community close to water and amenities, appealing for those wanting a quieter experience with quick access to larger towns. | Bedeque Bay, Bedeque Historical Society Museum, Nearby golf courses, Local seafood restaurants |
| Summerside | The second-largest city in Prince Edward Island, featuring a vibrant downtown and waterfront. It's a hub for events and local festivals. | Summerside Waterfront, Governors' Green, Eptek Centre, Spinnaker's Landing, Centre Belliveau |
| North Rustico | A picturesque fishing village known for its harbor and seafood restaurants, perfect for vacationers looking for an authentic coastal experience. | North Rustico Harbour, Fisherman's Wharf, Cape Island Boat Tours, Shining Waters Family Fun Park |
| Cornwall | A growing community close to Charlottetown that offers modern amenities and is popular with families and business travelers. | Cornwall Marina, Parks and playgrounds, Montague River, Cornwall Community Centre |
| Charlottetown | The capital city of Prince Edward Island, known for its rich history, culture, and attractions. A prime location for those wanting access to city life. | Confederation Centre of the Arts, Historic Charlottetown Waterfront, Victoria Row, Charlottetown Farmers Market |
| Stanhope | A scenic area known for its natural beauty and beach access, attracting those who enjoy outdoor activities like hiking and biking. | Stanhope Beach, Stanhope Golf Club, Nearby biking trails, Prince Edward Island National Park |
Understanding Airbnb License Requirements & STR Laws in Darnley (2025)
Yes, Darnley, Prince Edward Island, Canada enforces high STR regulations. Obtaining a license and ensuring compliance is almost certainly required according to current 2025 STR laws. Always verify the latest short term rental regulations and Airbnb license requirements directly with local government authorities for Darnley to ensure full compliance before hosting.
(Source: AirROI data, 2025, based on 37% licensed listings)
Top Performing Airbnb Properties in Darnley (2025)
Benchmark your potential! Explore examples of top-performing Airbnb properties in Darnleybased on Trailing Twelve Month (TTM) revenue. Analyze their characteristics, revenue, occupancy rate, and ADR to understand what drives success in this market.
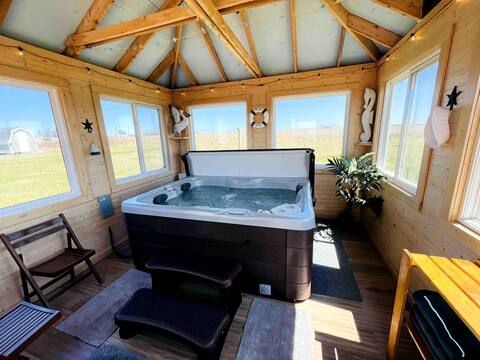
Rest Ashored by Memory MakerCottages with Hot-tub!
Entire Place • 3 bedrooms
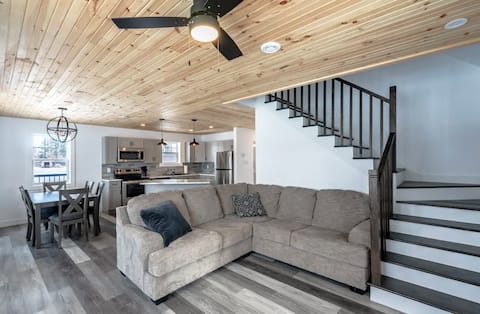
Fun for the whole family!
Entire Place • 3 bedrooms
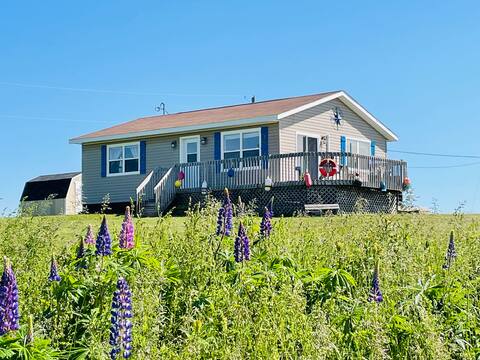
Wavie Waters by MemoryMakerCottages- Water-view!
Entire Place • 2 bedrooms
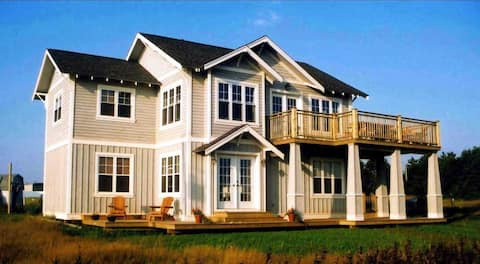
Beach House at Thunder Cove on PEI's best beach
Entire Place • 4 bedrooms
The Sea Drift by MemoryMakerCottages by the Beach!
Entire Place • 3 bedrooms

Sou'West Sunshine Cottage with Hot tub and Pool
Entire Place • 3 bedrooms
Note: Performance varies based on location, size, amenities, seasonality, and management quality. Data reflects the past 12 months.
Top Performing Airbnb Hosts in Darnley (2025)
Learn from the best! This table showcases top-performing Airbnb hosts in Darnley based on the number of properties managed and estimated total revenue over the past year. Analyze their scale and performance metrics.
| Host Name | Properties | Grossing Revenue | Stay Reviews | Avg Rating |
|---|---|---|---|---|
| Katie | 3 | $138,294 | 589 | 4.97/5.0 |
| Alex | 3 | $53,588 | 34 | 4.89/5.0 |
| Brian & Jane | 2 | $47,785 | 48 | 4.96/5.0 |
| Michael | 1 | $47,095 | 44 | 4.95/5.0 |
| Michael | 1 | $42,558 | 35 | 4.94/5.0 |
| Toby | 1 | $31,767 | 72 | 5.00/5.0 |
| Kate | 1 | $31,019 | 65 | 4.98/5.0 |
| Shelley | 1 | $27,533 | 34 | 4.97/5.0 |
| Mary | 1 | $26,970 | 22 | 4.73/5.0 |
| Katlyn | 1 | $26,689 | 70 | 4.99/5.0 |
Analyzing the strategies of top hosts, such as their property selection, pricing, and guest communication, can offer valuable lessons for optimizing your own Airbnb operations in Darnley.
Dive Deeper: Advanced Darnley STR Market Data (2025)
Ready to unlock more insights? AirROI provides access to advanced metrics and comprehensive Airbnb data for Darnley. Explore detailed analytics beyond this report to refine your investment strategy, optimize pricing, and maximize your vacation rental profits.
Explore Advanced MetricsDarnley Short-Term Rental Market Composition (2025): Property & Room Types
Room Type Distribution
Property Type Distribution
Market Composition Insights for Darnley
- The Darnley Airbnb market composition is heavily skewed towards Entire Home/Apt listings, which make up 100% of the 41 active rentals. This indicates strong guest preference for privacy and space.
- Looking at the property type distribution in Darnley, House properties are the most common (92.7%), reflecting the local real estate landscape.
- Houses represent a significant 92.7% portion, catering likely to families or larger groups.
Darnley Airbnb Room Capacity Analysis (2025): Bedroom Distribution
Distribution of Listings by Number of Bedrooms
Room Capacity Insights for Darnley
- The dominant room capacity in Darnley is 3 bedrooms listings, making up 51.2% of the market. This suggests a strong demand for properties suitable for families or small groups.
- Together, 3 bedrooms and 2 bedrooms properties represent 82.9% of the active Airbnb listings in Darnley, indicating a high concentration in these sizes.
- A significant 63.4% of listings offer 3+ bedrooms, catering to larger groups and families seeking more space in Darnley.
Darnley Vacation Rental Guest Capacity Trends (2025)
Distribution of Listings by Guest Capacity
Guest Capacity Insights for Darnley
- The most common guest capacity trend in Darnley vacation rentals is listings accommodating 6 guests (53.7%). This suggests the primary traveler segment is likely larger groups.
- Properties designed for 6 guests and 8+ guests dominate the Darnley STR market, accounting for 75.7% of listings.
- 85.5% of properties accommodate 6+ guests, serving the market segment for larger families or group travel in Darnley.
- On average, properties in Darnley are equipped to host 6.2 guests.
Darnley Airbnb Booking Patterns (2025): Available vs. Booked Days
Available Days Distribution
Booked Days Distribution
Booking Pattern Insights for Darnley
- The most common availability pattern in Darnley falls within the 271-366 days range, representing 56.1% of listings. This suggests many properties have significant open periods on their calendars.
- Approximately 87.8% of listings show high availability (181+ days open annually), indicating potential for increased bookings or specific owner usage patterns.
- For booked days, the 31-90 days range is most frequent in Darnley (48.8%), reflecting common guest stay durations or potential owner blocking patterns.
- A notable 12.2% of properties secure long booking periods (181+ days booked per year), highlighting successful long-term rental strategies or significant owner usage.
Darnley Airbnb Minimum Stay Requirements Analysis
Distribution of Listings by Minimum Night Requirement
2 Nights
4 listings
10.3% of total
3 Nights
5 listings
12.8% of total
4-6 Nights
16 listings
41% of total
7-29 Nights
8 listings
20.5% of total
30+ Nights
6 listings
15.4% of total
Key Insights
- The most prevalent minimum stay requirement in Darnley is 4-6 Nights, adopted by 41% of listings. This highlights the market's preference for longer commitments.
- Very short stays (1-2 nights) are less common (10.3%), suggesting hosts prefer slightly longer bookings to optimize turnover.
- A significant segment (15.4%) caters to monthly stays (30+ nights) in Darnley, pointing to opportunities in the extended-stay market.
Recommendations
- Align with the market by considering a 4-6 Nights minimum stay, as 41% of Darnley hosts use this setting.
- Explore offering discounts for stays of 30+ nights to attract the 15.4% of the market seeking extended stays.
- Adjust minimum nights based on seasonality – potentially shorter during low season and longer during peak demand periods in Darnley.
Darnley Airbnb Cancellation Policy Trends Analysis (2025)
Moderate
7 listings
18.4% of total
Firm
26 listings
68.4% of total
Strict
5 listings
13.2% of total
Cancellation Policy Insights for Darnley
- The prevailing Airbnb cancellation policy trend in Darnley is Firm, used by 68.4% of listings.
- A majority (81.6%) of hosts in Darnley utilize Firm or Strict policies, indicating a market where hosts prioritize booking security.
Recommendations for Hosts
- Consider adopting a Firm policy to align with the 68.4% market standard in Darnley.
- Using a Strict policy might deter some guests, as only 13.2% of listings use it. Evaluate if potential revenue protection outweighs possible lower booking rates.
- Regularly review your cancellation policy against competitors and market demand shifts in Darnley.
Darnley STR Booking Lead Time Analysis (2025)
Average Booking Lead Time by Month
Booking Lead Time Insights for Darnley
- The overall average booking lead time for vacation rentals in Darnley is 93 days.
- Guests book furthest in advance for stays during July (average 165 days), likely coinciding with peak travel demand or local events.
- The shortest booking windows occur for stays in December (average 17 days), indicating more last-minute travel plans during this time.
- Seasonally, Summer (137 days avg.) sees the longest lead times, while Winter (26 days avg.) has the shortest, reflecting typical travel planning cycles.
Recommendations for Hosts
- Use the overall average lead time (93 days) as a baseline for your pricing and availability strategy in Darnley.
- For July stays, consider implementing length-of-stay discounts or slightly higher rates for bookings made less than 165 days out to capitalize on advance planning.
- Target marketing efforts for the Summer season well in advance (at least 137 days) to capture early planners.
- Monitor your own booking lead times against these Darnley averages to identify opportunities for dynamic pricing adjustments.
Popular & Essential Airbnb Amenities in Darnley (2025)
Amenity Prevalence
Amenity Insights for Darnley
- Essential amenities in Darnley that guests expect include: Hot water, Fire extinguisher, Smoke alarm, Wifi, Heating, Kitchen, Dishes and silverware, Cooking basics. Lacking these (any) could significantly impact bookings.
- Popular amenities like BBQ grill, Washer are common but not universal. Offering these can provide a competitive edge.
Recommendations for Hosts
- Ensure your listing includes all essential amenities for Darnley: Hot water, Fire extinguisher, Smoke alarm, Wifi, Heating, Kitchen, Dishes and silverware, Cooking basics.
- Prioritize adding missing essentials: Smoke alarm, Wifi, Heating, Kitchen, Dishes and silverware, Cooking basics.
- Consider adding popular differentiators like BBQ grill or Washer to increase appeal.
- Highlight unique or less common amenities you offer (e.g., hot tub, dedicated workspace, EV charger) in your listing description and photos.
- Regularly check competitor amenities in Darnley to stay competitive.
Darnley Airbnb Guest Demographics & Profile Analysis (2025)
Guest Profile Summary for Darnley
- The typical guest profile for Airbnb in Darnley consists of primarily domestic travelers (81%), often arriving from nearby Ottawa, typically belonging to the Post-2000s (Gen Z/Alpha) group (50%), primarily speaking English or French.
- Domestic travelers account for 81.0% of guests.
- Key international markets include Canada (81%) and United States (17%).
- Top languages spoken are English (66.5%) followed by French (19.3%).
- A significant demographic segment is the Post-2000s (Gen Z/Alpha) group, representing 50% of guests.
Recommendations for Hosts
- Target domestic marketing efforts towards travelers from Ottawa and Halifax.
- Tailor amenities and listing descriptions to appeal to the dominant Post-2000s (Gen Z/Alpha) demographic (e.g., highlight fast WiFi, smart home features, local guides).
- Highlight unique local experiences or amenities relevant to the primary guest profile.
- Consider seasonal promotions aligned with peak travel times for key origin markets.
Nearby Short-Term Rental Market Comparison
How does the Darnley Airbnb market stack up against its neighbors? Compare key performance metrics like average monthly revenue, ADR, and occupancy rates in surrounding areas to understand the broader regional STR landscape.
| Market | Active Properties | Monthly Revenue | Daily Rate | Avg. Occupancy |
|---|---|---|---|---|
| Wentworth | 23 | $2,556 | $225.30 | 44% |
| Long River | 17 | $2,500 | $236.42 | 52% |
| Granville | 10 | $2,491 | $276.93 | 56% |
| Port Williams | 16 | $2,478 | $245.95 | 52% |
| Rustico | 27 | $2,307 | $241.08 | 49% |
| Halls Harbour | 16 | $2,240 | $195.39 | 52% |
| Mill River East | 10 | $2,178 | $158.92 | 53% |
| Grand Pre | 10 | $2,112 | $267.30 | 45% |
| Oyster Bed Bridge | 10 | $2,066 | $184.77 | 65% |
| Souris West | 10 | $2,057 | $201.77 | 50% |