Woolwich Airbnb Market Analysis 2025: Short Term Rental Data & Vacation Rental Statistics in Ontario, Canada
Is Airbnb profitable in Woolwich in 2025? Explore comprehensive Airbnb analytics for Woolwich, Ontario, Canada to uncover income potential. This 2025 STR market report for Woolwich, based on AirROI data from April 2024 to March 2025, reveals key trends in the niche market of 24 active listings.
Whether you're considering an Airbnb investment in Woolwich, optimizing your existing vacation rental, or exploring rental arbitrage opportunities, understanding the Woolwich Airbnb data is crucial. Leveraging the low regulation environment is key to maximizing your short term rental income potential. Let's dive into the specifics.
Key Woolwich Airbnb Performance Metrics Overview
Monthly Airbnb Revenue Variations & Income Potential in Woolwich (2025)
Understanding the monthly revenue variations for Airbnb listings in Woolwich is key to maximizing your short term rental income potential. Seasonality significantly impacts earnings. Our analysis, based on data from the past 12 months, shows that the peak revenue month for STRs in Woolwich is typically July, while January often presents the lowest earnings, highlighting opportunities for strategic pricing adjustments during shoulder and low seasons. Explore the typical Airbnb income in Woolwich across different performance tiers:
- Best-in-class properties (Top 10%) achieve $2,741+ monthly, often utilizing dynamic pricing and superior guest experiences.
- Strong performing properties (Top 25%) earn $1,847 or more, indicating effective management and desirable locations/amenities.
- Typical properties (Median) generate around $1,100 per month, representing the average market performance.
- Entry-level properties (Bottom 25%) see earnings around $475, often with potential for optimization.
Average Monthly Airbnb Earnings Trend in Woolwich
Woolwich Airbnb Occupancy Rate Trends (2025)
Maximize your bookings by understanding the Woolwich STR occupancy trends. Seasonal demand shifts significantly influence how often properties are booked. Typically, Augustsees the highest demand (peak season occupancy), while April experiences the lowest (low season). Effective strategies, like adjusting minimum stays or offering promotions, can boost occupancy during slower periods. Here's how different property tiers perform in Woolwich:
- Best-in-class properties (Top 10%) achieve 72%+ occupancy, indicating high desirability and potentially optimized availability.
- Strong performing properties (Top 25%) maintain 47% or higher occupancy, suggesting good market fit and guest satisfaction.
- Typical properties (Median) have an occupancy rate around 22%.
- Entry-level properties (Bottom 25%) average 12% occupancy, potentially facing higher vacancy.
Average Monthly Occupancy Rate Trend in Woolwich
Average Daily Rate (ADR) Airbnb Trends in Woolwich (2025)
Effective short term rental pricing strategy in Woolwich involves understanding monthly ADR fluctuations. The Average Daily Rate (ADR) for Airbnb in Woolwich typically peaks in October and dips lowest during March. Leveraging Airbnb dynamic pricing tools or strategies based on this seasonality can significantly boost revenue. Here's a look at the typical nightly rates achieved:
- Best-in-class properties (Top 10%) command rates of $300+ per night, often due to premium features or locations.
- Strong performing properties (Top 25%) achieve nightly rates of $178 or more.
- Typical properties (Median) charge around $125 per night.
- Entry-level properties (Bottom 25%) earn around $86 per night.
Average Daily Rate (ADR) Trend by Month in Woolwich
Get Live Woolwich Market Intelligence 👇

Explore Real-time Analytics
Airbnb Seasonality Analysis & Trends in Woolwich (2025)
Peak Season (July, August, October)
- Revenue averages $1,577 per month
- Occupancy rates average 36.3%
- Daily rates average $174
Shoulder Season
- Revenue averages $1,431 per month
- Occupancy maintains around 31.7%
- Daily rates hold near $147
Low Season (January, April, November)
- Revenue drops to average $1,105 per month
- Occupancy decreases to average 27.4%
- Daily rates adjust to average $139
Seasonality Insights for Woolwich
- The Airbnb seasonality in Woolwich shows moderate seasonality with distinct peak and low periods. While the sections above show seasonal averages, it's also insightful to look at the extremes:
- During the high season, the absolute peak month showcases Woolwich's highest earning potential, with monthly revenues capable of climbing to $1,670, occupancy reaching a high of 37.9%, and ADRs peaking at $176.
- Conversely, the slowest single month of the year, typically falling within the low season, marks the market's lowest point. In this month, revenue might dip to $1,078, occupancy could drop to 21.3%, and ADRs may adjust down to $119.
- Understanding both the seasonal averages and these monthly peaks and troughs in revenue, occupancy, and ADR is crucial for maximizing your Airbnb profit potential in Woolwich.
Seasonal Strategies for Maximizing Profit
- Peak Season: Maximize revenue through premium pricing and potentially longer minimum stays. Ensure high availability.
- Low Season: Offer competitive pricing, special promotions (e.g., extended stay discounts), and flexible cancellation policies. Target off-season travelers like remote workers or budget-conscious guests.
- Shoulder Seasons: Implement dynamic pricing that balances peak and low rates. Target weekend travelers or specific events. Offer slightly more flexible terms than peak season.
- Regularly analyze your own performance against these Woolwich seasonality benchmarks and adjust your pricing and availability strategy accordingly.
Best Areas for Airbnb Investment in Woolwich (2025)
Exploring the top neighborhoods for short-term rentals in Woolwich? This section highlights key areas, outlining why they are attractive for hosts and guests, along with notable local attractions. Consider these locations based on your target guest profile and investment strategy.
| Neighborhood / Area | Why Host Here? (Target Guests & Appeal) | Key Attractions & Landmarks |
|---|---|---|
| Waterfront Neighbourhood | Picturesque location along the shores of the St. Lawrence River. Ideal for guests seeking scenic views and outdoor activities. | Woolwich Trail, St. Lawrence River, Riverfront Park, Waterloo Region Museum, Local shops and cafes |
| Breslau | Centrally located in the township, offering a blend of rural charm and easy access to urban amenities. Great for families and outdoor enthusiasts. | Breslau Community Centre, Parks and Recreational Spaces, Local farms, Easy access to Kitchener and Waterloo |
| New Hamburg | Charming small town atmosphere with a strong community feel. Attracts visitors looking for a quiet, peaceful getaway. | Old Order Mennonite community, Wilhelm Park, Local shops and restaurants, Historic downtown |
| Elmira | Famous for its Mennonite culture and the nearby Elora Gorge. Perfect for guests interested in heritage and nature. | Elora Gorge Conservation Area, Elmira Maple Syrup Festival, Local farmer's markets, Scenic rural landscapes |
| St. Jacobs | Known for its heritage and popular farmers' market. Attracts tourists wanting a taste of rural Ontario life and shopping. | St. Jacobs Farmers' Market, Theatre in St. Jacobs, Historic St. Jacobs Village, Walking trails along the Conestogo River |
| Brubacher House | Cultural heritage site showcasing Mennonite history. Appeals to history buffs and those interested in unique local culture. | Brubacher House Museum, Historical reenactments, Cultural festivals, Proximity to local farms |
| Guelph | Nearby city with a vibrant arts scene and university population. Ideal for urban explorers looking for a lively atmosphere. | University of Guelph, Church of Our Lady Immaculate, Guelph Farmers' Market, Art galleries and museums |
| Kitchener | Popular urban center close to Woolwich with plenty of amenities. Great for guests who enjoy urban life with easy access to nature. | Victoria Park, Kitchener Market, The Museum, Local breweries and nightlife |
Understanding Airbnb License Requirements & STR Laws in Woolwich (2025)
While Woolwich, Ontario, Canada currently shows low STR regulations, specific Airbnb license requirements might still exist or change. Always verify the latest short term rental regulations and Airbnb license requirements directly with local government authorities for Woolwich to ensure full compliance before hosting.
(Source: AirROI data, 2025, finding no licensed listings among those analyzed)
Top Performing Airbnb Properties in Woolwich (2025)
Benchmark your potential! Explore examples of top-performing Airbnb properties in Woolwichbased on Trailing Twelve Month (TTM) revenue. Analyze their characteristics, revenue, occupancy rate, and ADR to understand what drives success in this market.
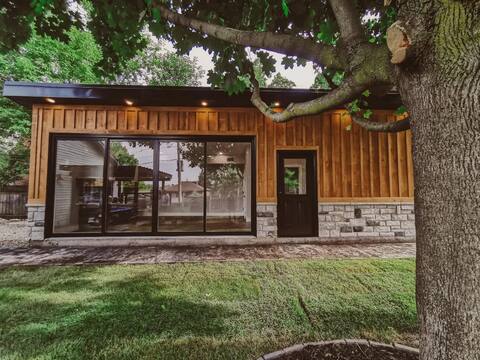
Adorable open-concept guesthouse with hot tub.
Entire Place • 1 bedroom
St.Jacob's Village Private Suite #1
Entire Place • 1 bedroom
St.Jacob's Village Private Suite #2
Entire Place • 1 bedroom

Sawmill Suite
Entire Place • 1 bedroom

Hammer Haus-Tranquil and Quiet-St. Jacob's Market
Entire Place • 3 bedrooms

Kissing Bridge Suite - One Bedroom Vacation Home
Entire Place • 1 bedroom
Note: Performance varies based on location, size, amenities, seasonality, and management quality. Data reflects the past 12 months.
Top Performing Airbnb Hosts in Woolwich (2025)
Learn from the best! This table showcases top-performing Airbnb hosts in Woolwich based on the number of properties managed and estimated total revenue over the past year. Analyze their scale and performance metrics.
| Host Name | Properties | Grossing Revenue | Stay Reviews | Avg Rating |
|---|---|---|---|---|
| Bobbi | 2 | $39,869 | 836 | 4.87/5.0 |
| Jessica | 1 | $39,535 | 46 | 4.87/5.0 |
| Carol | 2 | $25,956 | 72 | 4.94/5.0 |
| Host #413008406 | 2 | $24,150 | 20 | 4.50/5.0 |
| Kate | 1 | $19,145 | 7 | 4.86/5.0 |
| Joshua | 1 | $17,762 | 32 | 4.81/5.0 |
| Tony.R | 3 | $16,897 | 87 | 4.87/5.0 |
| Jodie | 3 | $15,645 | 9 | 3.33/5.0 |
| Hilary | 1 | $11,916 | 7 | 4.86/5.0 |
| Host #23266839 | 1 | $11,572 | 243 | 4.89/5.0 |
Analyzing the strategies of top hosts, such as their property selection, pricing, and guest communication, can offer valuable lessons for optimizing your own Airbnb operations in Woolwich.
Dive Deeper: Advanced Woolwich STR Market Data (2025)
Ready to unlock more insights? AirROI provides access to advanced metrics and comprehensive Airbnb data for Woolwich. Explore detailed analytics beyond this report to refine your investment strategy, optimize pricing, and maximize your vacation rental profits.
Explore Advanced MetricsWoolwich Short-Term Rental Market Composition (2025): Property & Room Types
Room Type Distribution
Property Type Distribution
Market Composition Insights for Woolwich
- The Woolwich Airbnb market composition is heavily skewed towards Entire Home/Apt listings, which make up 54.2% of the 24 active rentals. This indicates strong guest preference for privacy and space.
- However, a notable 45.8% share for Private Rooms suggests opportunities for budget-conscious travelers or hosts renting out spare rooms.
- Looking at the property type distribution in Woolwich, Hotel/Boutique properties are the most common (29.2%), reflecting the local real estate landscape.
- Houses represent a significant 20.8% portion, catering likely to families or larger groups.
- The presence of 29.2% Hotel/Boutique listings indicates integration with traditional hospitality.
- Smaller segments like outdoor/unique (combined 4.2%) offer potential for unique stay experiences.
Woolwich Airbnb Room Capacity Analysis (2025): Bedroom Distribution
Distribution of Listings by Number of Bedrooms
Room Capacity Insights for Woolwich
- The dominant room capacity in Woolwich is 1 bedroom listings, making up 62.5% of the market. This suggests a strong demand for properties suitable for couples or solo travelers.
- Together, 1 bedroom and 3 bedrooms properties represent 70.8% of the active Airbnb listings in Woolwich, indicating a high concentration in these sizes.
- With over half the market (62.5%) consisting of studios or 1-bedroom units, Woolwich is particularly well-suited for individuals or couples.
- Listings with 3+ bedrooms (8.3%) represent a smaller niche, potentially indicating an underserved market for larger group accommodations in Woolwich.
Woolwich Vacation Rental Guest Capacity Trends (2025)
Distribution of Listings by Guest Capacity
Guest Capacity Insights for Woolwich
- The most common guest capacity trend in Woolwich vacation rentals is listings accommodating 2 guests (41.7%). This suggests the primary traveler segment is likely couples or solo travelers.
- Properties designed for 2 guests and 4 guests dominate the Woolwich STR market, accounting for 54.2% of listings.
- A significant 41.7% of listings cater specifically to 1-2 guests, highlighting strong demand from couples and solo travelers in Woolwich.
- On average, properties in Woolwich are equipped to host 2.4 guests.
Woolwich Airbnb Booking Patterns (2025): Available vs. Booked Days
Available Days Distribution
Booked Days Distribution
Booking Pattern Insights for Woolwich
- The most common availability pattern in Woolwich falls within the 271-366 days range, representing 62.5% of listings. This suggests many properties have significant open periods on their calendars.
- Approximately 83.3% of listings show high availability (181+ days open annually), indicating potential for increased bookings or specific owner usage patterns.
- For booked days, the 31-90 days range is most frequent in Woolwich (41.7%), reflecting common guest stay durations or potential owner blocking patterns.
- A notable 20.8% of properties secure long booking periods (181+ days booked per year), highlighting successful long-term rental strategies or significant owner usage.
Woolwich Airbnb Minimum Stay Requirements Analysis
Distribution of Listings by Minimum Night Requirement
1 Night
13 listings
65% of total
2 Nights
4 listings
20% of total
3 Nights
1 listings
5% of total
7-29 Nights
1 listings
5% of total
30+ Nights
1 listings
5% of total
Key Insights
- The most prevalent minimum stay requirement in Woolwich is 1 Night, adopted by 65% of listings. This highlights the market's preference for shorter, flexible bookings.
- A strong majority (85.0%) of the Woolwich Airbnb data shows acceptance of very short stays (1-2 nights), indicating a dynamic, high-turnover market.
Recommendations
- Align with the market by considering a 1 Night minimum stay, as 65% of Woolwich hosts use this setting.
- Adjust minimum nights based on seasonality – potentially shorter during low season and longer during peak demand periods in Woolwich.
Woolwich Airbnb Cancellation Policy Trends Analysis (2025)
Flexible
9 listings
42.9% of total
Moderate
8 listings
38.1% of total
Firm
4 listings
19% of total
Cancellation Policy Insights for Woolwich
- The prevailing Airbnb cancellation policy trend in Woolwich is Flexible, used by 42.9% of listings.
- The market strongly favors guest-friendly terms, with 81.0% of listings offering Flexible or Moderate policies. This suggests guests in Woolwich may expect booking flexibility.
Recommendations for Hosts
- Consider adopting a Flexible policy to align with the 42.9% market standard in Woolwich.
- Regularly review your cancellation policy against competitors and market demand shifts in Woolwich.
Woolwich STR Booking Lead Time Analysis (2025)
Average Booking Lead Time by Month
Booking Lead Time Insights for Woolwich
- The overall average booking lead time for vacation rentals in Woolwich is 71 days.
- Guests book furthest in advance for stays during October (average 117 days), likely coinciding with peak travel demand or local events.
- The shortest booking windows occur for stays in February (average 57 days), indicating more last-minute travel plans during this time.
- Seasonally, Fall (100 days avg.) sees the longest lead times, while Winter (68 days avg.) has the shortest, reflecting typical travel planning cycles.
Recommendations for Hosts
- Use the overall average lead time (71 days) as a baseline for your pricing and availability strategy in Woolwich.
- For October stays, consider implementing length-of-stay discounts or slightly higher rates for bookings made less than 117 days out to capitalize on advance planning.
- Target marketing efforts for the Fall season well in advance (at least 100 days) to capture early planners.
- Monitor your own booking lead times against these Woolwich averages to identify opportunities for dynamic pricing adjustments.
Popular & Essential Airbnb Amenities in Woolwich (2025)
Amenity Prevalence
Amenity Insights for Woolwich
- Essential amenities in Woolwich that guests expect include: Wifi, Carbon monoxide alarm, Smoke alarm, TV, Free parking on premises, Air conditioning, Heating. Lacking these (any) could significantly impact bookings.
- Popular amenities like Essentials, Hot water, Microwave are common but not universal. Offering these can provide a competitive edge.
Recommendations for Hosts
- Ensure your listing includes all essential amenities for Woolwich: Wifi, Carbon monoxide alarm, Smoke alarm, TV, Free parking on premises, Air conditioning, Heating.
- Prioritize adding missing essentials: Free parking on premises, Air conditioning, Heating.
- Consider adding popular differentiators like Essentials or Hot water to increase appeal.
- Highlight unique or less common amenities you offer (e.g., hot tub, dedicated workspace, EV charger) in your listing description and photos.
- Regularly check competitor amenities in Woolwich to stay competitive.
Woolwich Airbnb Guest Demographics & Profile Analysis (2025)
Guest Profile Summary for Woolwich
- The typical guest profile for Airbnb in Woolwich consists of primarily domestic travelers (93%), often arriving from nearby Toronto, typically belonging to the Post-2000s (Gen Z/Alpha) group (50%), primarily speaking English or French.
- Domestic travelers account for 92.9% of guests.
- Key international markets include Canada (92.9%) and United States (3.8%).
- Top languages spoken are English (69.4%) followed by French (8.1%).
- A significant demographic segment is the Post-2000s (Gen Z/Alpha) group, representing 50% of guests.
Recommendations for Hosts
- Target domestic marketing efforts towards travelers from Toronto and London.
- Tailor amenities and listing descriptions to appeal to the dominant Post-2000s (Gen Z/Alpha) demographic (e.g., highlight fast WiFi, smart home features, local guides).
- Highlight unique local experiences or amenities relevant to the primary guest profile.
- Consider seasonal promotions aligned with peak travel times for key origin markets.
Nearby Short-Term Rental Market Comparison
How does the Woolwich Airbnb market stack up against its neighbors? Compare key performance metrics like average monthly revenue, ADR, and occupancy rates in surrounding areas to understand the broader regional STR landscape.
| Market | Active Properties | Monthly Revenue | Daily Rate | Avg. Occupancy |
|---|---|---|---|---|
| North East Township | 34 | $3,530 | $264.33 | 48% |
| Niagara-on-the-Lake | 413 | $3,358 | $265.20 | 44% |
| Town of Stockton | 16 | $3,172 | $232.49 | 46% |
| Town of Brant | 10 | $2,928 | $274.43 | 43% |
| Severn | 154 | $2,845 | $306.35 | 39% |
| Meaford | 129 | $2,843 | $246.44 | 45% |
| Town of French Creek | 46 | $2,842 | $286.58 | 33% |
| King | 29 | $2,840 | $269.07 | 33% |
| Mulmur | 43 | $2,837 | $283.33 | 42% |
| Gravenhurst | 220 | $2,834 | $308.96 | 41% |