Wiarton Airbnb Market Analysis 2025: Short Term Rental Data & Vacation Rental Statistics in Ontario, Canada
Is Airbnb profitable in Wiarton in 2025? Explore comprehensive Airbnb analytics for Wiarton, Ontario, Canada to uncover income potential. This 2025 STR market report for Wiarton, based on AirROI data from April 2024 to March 2025, reveals key trends in the niche market of 24 active listings.
Whether you're considering an Airbnb investment in Wiarton, optimizing your existing vacation rental, or exploring rental arbitrage opportunities, understanding the Wiarton Airbnb data is crucial. Leveraging the low regulation environment is key to maximizing your short term rental income potential. Let's dive into the specifics.
Key Wiarton Airbnb Performance Metrics Overview
Monthly Airbnb Revenue Variations & Income Potential in Wiarton (2025)
Understanding the monthly revenue variations for Airbnb listings in Wiarton is key to maximizing your short term rental income potential. Seasonality significantly impacts earnings. Our analysis, based on data from the past 12 months, shows that the peak revenue month for STRs in Wiarton is typically August, while January often presents the lowest earnings, highlighting opportunities for strategic pricing adjustments during shoulder and low seasons. Explore the typical Airbnb income in Wiarton across different performance tiers:
- Best-in-class properties (Top 10%) achieve $4,427+ monthly, often utilizing dynamic pricing and superior guest experiences.
- Strong performing properties (Top 25%) earn $3,031 or more, indicating effective management and desirable locations/amenities.
- Typical properties (Median) generate around $1,552 per month, representing the average market performance.
- Entry-level properties (Bottom 25%) see earnings around $918, often with potential for optimization.
Average Monthly Airbnb Earnings Trend in Wiarton
Wiarton Airbnb Occupancy Rate Trends (2025)
Maximize your bookings by understanding the Wiarton STR occupancy trends. Seasonal demand shifts significantly influence how often properties are booked. Typically, Augustsees the highest demand (peak season occupancy), while January experiences the lowest (low season). Effective strategies, like adjusting minimum stays or offering promotions, can boost occupancy during slower periods. Here's how different property tiers perform in Wiarton:
- Best-in-class properties (Top 10%) achieve 64%+ occupancy, indicating high desirability and potentially optimized availability.
- Strong performing properties (Top 25%) maintain 47% or higher occupancy, suggesting good market fit and guest satisfaction.
- Typical properties (Median) have an occupancy rate around 31%.
- Entry-level properties (Bottom 25%) average 16% occupancy, potentially facing higher vacancy.
Average Monthly Occupancy Rate Trend in Wiarton
Average Daily Rate (ADR) Airbnb Trends in Wiarton (2025)
Effective short term rental pricing strategy in Wiarton involves understanding monthly ADR fluctuations. The Average Daily Rate (ADR) for Airbnb in Wiarton typically peaks in July and dips lowest during November. Leveraging Airbnb dynamic pricing tools or strategies based on this seasonality can significantly boost revenue. Here's a look at the typical nightly rates achieved:
- Best-in-class properties (Top 10%) command rates of $401+ per night, often due to premium features or locations.
- Strong performing properties (Top 25%) achieve nightly rates of $242 or more.
- Typical properties (Median) charge around $171 per night.
- Entry-level properties (Bottom 25%) earn around $119 per night.
Average Daily Rate (ADR) Trend by Month in Wiarton
Get Live Wiarton Market Intelligence 👇

Explore Real-time Analytics
Airbnb Seasonality Analysis & Trends in Wiarton (2025)
Peak Season (August, July, May)
- Revenue averages $3,535 per month
- Occupancy rates average 52.1%
- Daily rates average $244
Shoulder Season
- Revenue averages $1,854 per month
- Occupancy maintains around 32.4%
- Daily rates hold near $236
Low Season (January, February, December)
- Revenue drops to average $1,267 per month
- Occupancy decreases to average 21.8%
- Daily rates adjust to average $238
Seasonality Insights for Wiarton
- The Airbnb seasonality in Wiarton shows highly seasonal trends requiring careful strategy. While the sections above show seasonal averages, it's also insightful to look at the extremes:
- During the high season, the absolute peak month showcases Wiarton's highest earning potential, with monthly revenues capable of climbing to $3,952, occupancy reaching a high of 62.0%, and ADRs peaking at $245.
- Conversely, the slowest single month of the year, typically falling within the low season, marks the market's lowest point. In this month, revenue might dip to $1,171, occupancy could drop to 18.7%, and ADRs may adjust down to $231.
- Understanding both the seasonal averages and these monthly peaks and troughs in revenue, occupancy, and ADR is crucial for maximizing your Airbnb profit potential in Wiarton.
Seasonal Strategies for Maximizing Profit
- Peak Season: Maximize revenue through premium pricing and potentially longer minimum stays. Ensure high availability.
- Low Season: Offer competitive pricing, special promotions (e.g., extended stay discounts), and flexible cancellation policies. Target off-season travelers like remote workers or budget-conscious guests.
- Shoulder Seasons: Implement dynamic pricing that balances peak and low rates. Target weekend travelers or specific events. Offer slightly more flexible terms than peak season.
- Regularly analyze your own performance against these Wiarton seasonality benchmarks and adjust your pricing and availability strategy accordingly.
Best Areas for Airbnb Investment in Wiarton (2025)
Exploring the top neighborhoods for short-term rentals in Wiarton? This section highlights key areas, outlining why they are attractive for hosts and guests, along with notable local attractions. Consider these locations based on your target guest profile and investment strategy.
| Neighborhood / Area | Why Host Here? (Target Guests & Appeal) | Key Attractions & Landmarks |
|---|---|---|
| Wiarton Harbour | A scenic waterfront location with beautiful views, convenient access to outdoor activities such as boating and fishing. Ideal for tourists looking to explore the natural beauty of the Bruce Peninsula. | Wiarton Marina, Colpoy's Bay, Bruce Trail Access, Fishing charters, Wiarton Willie Statue |
| South Bruce Peninsula | A lovely area known for its natural landscapes and proximity to the Bruce Peninsula National Park. Great for families and nature enthusiasts. | Bruce Peninsula National Park, Sunny Shore Park, Sauble Beach, Tobermory, Fathom Five National Marine Park |
| Shallow Lake | A peaceful community surrounded by nature, perfect for those seeking a quiet getaway. Proximity to hiking trails and natural attractions. | Shallow Lake, Grey Sauble Conservation Area, Hiking Trails, Local farms and markets |
| Pine Grove | A quiet residential area offering a retreat-like atmosphere, ideal for nature lovers looking for a relaxing stay. | Nature Trails, Local Parks, Bird Watching, Fishing Spots |
| Gordon Bay | A beautiful area known for its beaches and parks. Attracts families and outdoor activity lovers. | Gordon Bay Beach, Hiking Trails, Camping Areas, Scenic Views |
| Lions Head | A charming village with a picturesque harbor, known for its outdoor recreational opportunities and community events. | Lions Head Provincial Nature Reserve, Lions Head Beach, Local Art Gallery, Hiking Opportunities |
| Tobermory | A bustling tourist town at the northern tip of the Bruce Peninsula, famous for its crystal-clear waters and gateway to national parks. | Tobermory Harbour, Flowerpot Island, Grotto at Bruce Peninsula National Park, Glass Bottom Boat Tours |
| Chesley | A small town offering a serene setting with close-knit community vibes. Attractive for those looking for a rural experience. | Chesley Lake, Local parks, Community Events, Farmers Market |
Understanding Airbnb License Requirements & STR Laws in Wiarton (2025)
While Wiarton, Ontario, Canada currently shows low STR regulations, specific Airbnb license requirements might still exist or change. Always verify the latest short term rental regulations and Airbnb license requirements directly with local government authorities for Wiarton to ensure full compliance before hosting.
(Source: AirROI data, 2025, finding no licensed listings among those analyzed)
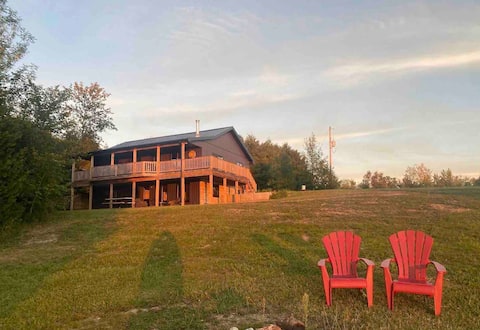
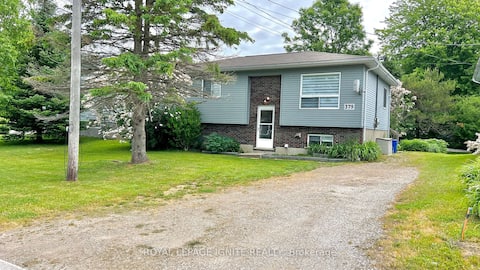
Top Performing Airbnb Properties in Wiarton (2025)
Benchmark your potential! Explore examples of top-performing Airbnb properties in Wiartonbased on Trailing Twelve Month (TTM) revenue. Analyze their characteristics, revenue, occupancy rate, and ADR to understand what drives success in this market.

Waterfront Executive Home
Entire Place • 4 bedrooms
Stunning lakefront cottage
Entire Place • 3 bedrooms
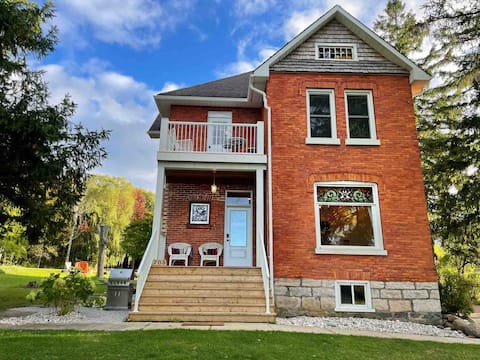
Stunning Bay View Century Home!
Entire Place • 3 bedrooms

Pretty Peninsula Porch
Entire Place • 4 bedrooms
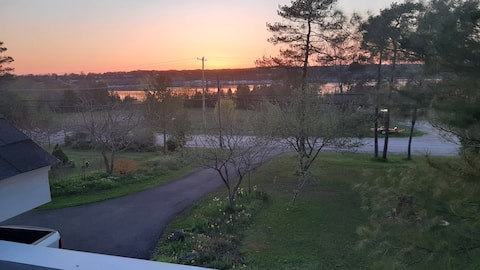
Escarpment Escape With Bay Views
Entire Place • 3 bedrooms
5 bedrooms Wiarton Willy house
Entire Place • 5 bedrooms
Note: Performance varies based on location, size, amenities, seasonality, and management quality. Data reflects the past 12 months.
Top Performing Airbnb Hosts in Wiarton (2025)
Learn from the best! This table showcases top-performing Airbnb hosts in Wiarton based on the number of properties managed and estimated total revenue over the past year. Analyze their scale and performance metrics.
| Host Name | Properties | Grossing Revenue | Stay Reviews | Avg Rating |
|---|---|---|---|---|
| Michael | 2 | $62,411 | 253 | 4.91/5.0 |
| Marisa | 1 | $58,196 | 47 | 4.98/5.0 |
| Brent | 1 | $48,055 | 34 | 4.94/5.0 |
| Jennifer | 1 | $37,594 | 11 | 4.82/5.0 |
| Jeff | 2 | $36,792 | 253 | 4.96/5.0 |
| Deb | 1 | $36,273 | 98 | 4.99/5.0 |
| Sarah | 2 | $33,399 | 124 | 4.88/5.0 |
| Venu | 2 | $31,809 | 80 | 4.55/5.0 |
| Christa | 1 | $20,850 | 151 | 4.94/5.0 |
| Becky | 1 | $17,645 | 139 | 4.98/5.0 |
Analyzing the strategies of top hosts, such as their property selection, pricing, and guest communication, can offer valuable lessons for optimizing your own Airbnb operations in Wiarton.
Dive Deeper: Advanced Wiarton STR Market Data (2025)
Ready to unlock more insights? AirROI provides access to advanced metrics and comprehensive Airbnb data for Wiarton. Explore detailed analytics beyond this report to refine your investment strategy, optimize pricing, and maximize your vacation rental profits.
Explore Advanced MetricsWiarton Short-Term Rental Market Composition (2025): Property & Room Types
Room Type Distribution
Property Type Distribution
Market Composition Insights for Wiarton
- The Wiarton Airbnb market composition is heavily skewed towards Entire Home/Apt listings, which make up 87.5% of the 24 active rentals. This indicates strong guest preference for privacy and space.
- Looking at the property type distribution in Wiarton, House properties are the most common (79.2%), reflecting the local real estate landscape.
- Houses represent a significant 79.2% portion, catering likely to families or larger groups.
Wiarton Airbnb Room Capacity Analysis (2025): Bedroom Distribution
Distribution of Listings by Number of Bedrooms
Room Capacity Insights for Wiarton
- The dominant room capacity in Wiarton is 3 bedrooms listings, making up 45.8% of the market. This suggests a strong demand for properties suitable for families or small groups.
- Together, 3 bedrooms and 4 bedrooms properties represent 62.5% of the active Airbnb listings in Wiarton, indicating a high concentration in these sizes.
- A significant 66.7% of listings offer 3+ bedrooms, catering to larger groups and families seeking more space in Wiarton.
Wiarton Vacation Rental Guest Capacity Trends (2025)
Distribution of Listings by Guest Capacity
Guest Capacity Insights for Wiarton
- The most common guest capacity trend in Wiarton vacation rentals is listings accommodating 6 guests (25%). This suggests the primary traveler segment is likely larger groups.
- Properties designed for 6 guests and 4 guests dominate the Wiarton STR market, accounting for 41.7% of listings.
- 58.4% of properties accommodate 6+ guests, serving the market segment for larger families or group travel in Wiarton.
- On average, properties in Wiarton are equipped to host 5.0 guests.
Wiarton Airbnb Booking Patterns (2025): Available vs. Booked Days
Available Days Distribution
Booked Days Distribution
Booking Pattern Insights for Wiarton
- The most common availability pattern in Wiarton falls within the 181-270 days range, representing 54.2% of listings. This suggests many properties have significant open periods on their calendars.
- Approximately 95.9% of listings show high availability (181+ days open annually), indicating potential for increased bookings or specific owner usage patterns.
- For booked days, the 91-180 days range is most frequent in Wiarton (54.2%), reflecting common guest stay durations or potential owner blocking patterns.
- A notable 4.2% of properties secure long booking periods (181+ days booked per year), highlighting successful long-term rental strategies or significant owner usage.
Wiarton Airbnb Minimum Stay Requirements Analysis
Distribution of Listings by Minimum Night Requirement
1 Night
5 listings
20.8% of total
2 Nights
16 listings
66.7% of total
3 Nights
2 listings
8.3% of total
4-6 Nights
1 listings
4.2% of total
Key Insights
- The most prevalent minimum stay requirement in Wiarton is 2 Nights, adopted by 66.7% of listings. This highlights the market's preference for shorter, flexible bookings.
- A strong majority (87.5%) of the Wiarton Airbnb data shows acceptance of very short stays (1-2 nights), indicating a dynamic, high-turnover market.
Recommendations
- Align with the market by considering a 2 Nights minimum stay, as 66.7% of Wiarton hosts use this setting.
- If feasible, allowing 1-night stays, especially midweek or during low season, could capture last-minute bookings, as only 20.8% currently do.
- Adjust minimum nights based on seasonality – potentially shorter during low season and longer during peak demand periods in Wiarton.
Wiarton Airbnb Cancellation Policy Trends Analysis (2025)
Flexible
4 listings
17.4% of total
Moderate
9 listings
39.1% of total
Firm
4 listings
17.4% of total
Strict
6 listings
26.1% of total
Cancellation Policy Insights for Wiarton
- The prevailing Airbnb cancellation policy trend in Wiarton is Moderate, used by 39.1% of listings.
- There's a relatively balanced mix between guest-friendly (56.5%) and stricter (43.5%) policies, offering choices for different guest needs.
Recommendations for Hosts
- Consider adopting a Moderate policy to align with the 39.1% market standard in Wiarton.
- Regularly review your cancellation policy against competitors and market demand shifts in Wiarton.
Wiarton STR Booking Lead Time Analysis (2025)
Average Booking Lead Time by Month
Booking Lead Time Insights for Wiarton
- The overall average booking lead time for vacation rentals in Wiarton is 47 days.
- Guests book furthest in advance for stays during July (average 86 days), likely coinciding with peak travel demand or local events.
- The shortest booking windows occur for stays in December (average 31 days), indicating more last-minute travel plans during this time.
- Seasonally, Summer (66 days avg.) sees the longest lead times, while Winter (42 days avg.) has the shortest, reflecting typical travel planning cycles.
Recommendations for Hosts
- Use the overall average lead time (47 days) as a baseline for your pricing and availability strategy in Wiarton.
- For July stays, consider implementing length-of-stay discounts or slightly higher rates for bookings made less than 86 days out to capitalize on advance planning.
- Target marketing efforts for the Summer season well in advance (at least 66 days) to capture early planners.
- Monitor your own booking lead times against these Wiarton averages to identify opportunities for dynamic pricing adjustments.
Popular & Essential Airbnb Amenities in Wiarton (2025)
Amenity Prevalence
Amenity Insights for Wiarton
- Essential amenities in Wiarton that guests expect include: Smoke alarm, Hot water, Hair dryer, Heating, Bed linens, Free parking on premises, Carbon monoxide alarm, TV, Essentials, Hangers. Lacking these (any) could significantly impact bookings.
Recommendations for Hosts
- Ensure your listing includes all essential amenities for Wiarton: Smoke alarm, Hot water, Hair dryer, Heating, Bed linens, Free parking on premises, Carbon monoxide alarm, TV, Essentials, Hangers.
- Prioritize adding missing essentials: TV, Essentials, Hangers.
- Highlight unique or less common amenities you offer (e.g., hot tub, dedicated workspace, EV charger) in your listing description and photos.
- Regularly check competitor amenities in Wiarton to stay competitive.
Wiarton Airbnb Guest Demographics & Profile Analysis (2025)
Guest Profile Summary for Wiarton
- The typical guest profile for Airbnb in Wiarton consists of primarily domestic travelers (86%), often arriving from nearby Toronto, typically belonging to the Post-2000s (Gen Z/Alpha) group (50%), primarily speaking English or French.
- Domestic travelers account for 86.4% of guests.
- Key international markets include Canada (86.4%) and United States (7.2%).
- Top languages spoken are English (57%) followed by French (9%).
- A significant demographic segment is the Post-2000s (Gen Z/Alpha) group, representing 50% of guests.
Recommendations for Hosts
- Target domestic marketing efforts towards travelers from Toronto and Hamilton.
- Tailor amenities and listing descriptions to appeal to the dominant Post-2000s (Gen Z/Alpha) demographic (e.g., highlight fast WiFi, smart home features, local guides).
- Highlight unique local experiences or amenities relevant to the primary guest profile.
- Consider seasonal promotions aligned with peak travel times for key origin markets.
Nearby Short-Term Rental Market Comparison
How does the Wiarton Airbnb market stack up against its neighbors? Compare key performance metrics like average monthly revenue, ADR, and occupancy rates in surrounding areas to understand the broader regional STR landscape.
| Market | Active Properties | Monthly Revenue | Daily Rate | Avg. Occupancy |
|---|---|---|---|---|
| Forester | 11 | $5,685 | $390.48 | 43% |
| Port Sanilac | 30 | $3,765 | $470.85 | 34% |
| Lexington | 31 | $3,459 | $385.98 | 43% |
| Meaford | 129 | $2,843 | $246.44 | 45% |
| Mulmur | 43 | $2,837 | $283.33 | 42% |
| The Blue Mountains | 612 | $2,777 | $285.62 | 36% |
| Brockton | 10 | $2,605 | $196.96 | 48% |
| Sanilac Township | 24 | $2,588 | $281.06 | 45% |
| Grey Highlands | 161 | $2,519 | $276.21 | 41% |
| Saugeen Shores | 12 | $2,460 | $296.92 | 44% |