Whitewater Region Airbnb Market Analysis 2025: Short Term Rental Data & Vacation Rental Statistics in Ontario, Canada
Is Airbnb profitable in Whitewater Region in 2025? Explore comprehensive Airbnb analytics for Whitewater Region, Ontario, Canada to uncover income potential. This 2025 STR market report for Whitewater Region, based on AirROI data from April 2024 to March 2025, reveals key trends in the niche market of 42 active listings.
Whether you're considering an Airbnb investment in Whitewater Region, optimizing your existing vacation rental, or exploring rental arbitrage opportunities, understanding the Whitewater Region Airbnb data is crucial. Leveraging the low regulation environment is key to maximizing your short term rental income potential. Let's dive into the specifics.
Key Whitewater Region Airbnb Performance Metrics Overview
Monthly Airbnb Revenue Variations & Income Potential in Whitewater Region (2025)
Understanding the monthly revenue variations for Airbnb listings in Whitewater Region is key to maximizing your short term rental income potential. Seasonality significantly impacts earnings. Our analysis, based on data from the past 12 months, shows that the peak revenue month for STRs in Whitewater Region is typically April, while February often presents the lowest earnings, highlighting opportunities for strategic pricing adjustments during shoulder and low seasons. Explore the typical Airbnb income in Whitewater Region across different performance tiers:
- Best-in-class properties (Top 10%) achieve $6,476+ monthly, often utilizing dynamic pricing and superior guest experiences.
- Strong performing properties (Top 25%) earn $4,079 or more, indicating effective management and desirable locations/amenities.
- Typical properties (Median) generate around $2,038 per month, representing the average market performance.
- Entry-level properties (Bottom 25%) see earnings around $1,072, often with potential for optimization.
Average Monthly Airbnb Earnings Trend in Whitewater Region
Whitewater Region Airbnb Occupancy Rate Trends (2025)
Maximize your bookings by understanding the Whitewater Region STR occupancy trends. Seasonal demand shifts significantly influence how often properties are booked. Typically, Aprilsees the highest demand (peak season occupancy), while January experiences the lowest (low season). Effective strategies, like adjusting minimum stays or offering promotions, can boost occupancy during slower periods. Here's how different property tiers perform in Whitewater Region:
- Best-in-class properties (Top 10%) achieve 65%+ occupancy, indicating high desirability and potentially optimized availability.
- Strong performing properties (Top 25%) maintain 52% or higher occupancy, suggesting good market fit and guest satisfaction.
- Typical properties (Median) have an occupancy rate around 33%.
- Entry-level properties (Bottom 25%) average 15% occupancy, potentially facing higher vacancy.
Average Monthly Occupancy Rate Trend in Whitewater Region
Average Daily Rate (ADR) Airbnb Trends in Whitewater Region (2025)
Effective short term rental pricing strategy in Whitewater Region involves understanding monthly ADR fluctuations. The Average Daily Rate (ADR) for Airbnb in Whitewater Region typically peaks in July and dips lowest during March. Leveraging Airbnb dynamic pricing tools or strategies based on this seasonality can significantly boost revenue. Here's a look at the typical nightly rates achieved:
- Best-in-class properties (Top 10%) command rates of $376+ per night, often due to premium features or locations.
- Strong performing properties (Top 25%) achieve nightly rates of $251 or more.
- Typical properties (Median) charge around $191 per night.
- Entry-level properties (Bottom 25%) earn around $138 per night.
Average Daily Rate (ADR) Trend by Month in Whitewater Region
Get Live Whitewater Region Market Intelligence 👇

Explore Real-time Analytics
Airbnb Seasonality Analysis & Trends in Whitewater Region (2025)
Peak Season (April, May, June)
- Revenue averages $4,966 per month
- Occupancy rates average 40.3%
- Daily rates average $214
Shoulder Season
- Revenue averages $2,635 per month
- Occupancy maintains around 38.3%
- Daily rates hold near $210
Low Season (January, February, March)
- Revenue drops to average $1,433 per month
- Occupancy decreases to average 23.3%
- Daily rates adjust to average $199
Seasonality Insights for Whitewater Region
- The Airbnb seasonality in Whitewater Region shows highly seasonal trends requiring careful strategy. While the sections above show seasonal averages, it's also insightful to look at the extremes:
- During the high season, the absolute peak month showcases Whitewater Region's highest earning potential, with monthly revenues capable of climbing to $5,131, occupancy reaching a high of 58.2%, and ADRs peaking at $218.
- Conversely, the slowest single month of the year, typically falling within the low season, marks the market's lowest point. In this month, revenue might dip to $1,351, occupancy could drop to 20.6%, and ADRs may adjust down to $198.
- Understanding both the seasonal averages and these monthly peaks and troughs in revenue, occupancy, and ADR is crucial for maximizing your Airbnb profit potential in Whitewater Region.
Seasonal Strategies for Maximizing Profit
- Peak Season: Maximize revenue through premium pricing and potentially longer minimum stays. Ensure high availability.
- Low Season: Offer competitive pricing, special promotions (e.g., extended stay discounts), and flexible cancellation policies. Target off-season travelers like remote workers or budget-conscious guests.
- Shoulder Seasons: Implement dynamic pricing that balances peak and low rates. Target weekend travelers or specific events. Offer slightly more flexible terms than peak season.
- Regularly analyze your own performance against these Whitewater Region seasonality benchmarks and adjust your pricing and availability strategy accordingly.
Best Areas for Airbnb Investment in Whitewater Region (2025)
Exploring the top neighborhoods for short-term rentals in Whitewater Region? This section highlights key areas, outlining why they are attractive for hosts and guests, along with notable local attractions. Consider these locations based on your target guest profile and investment strategy.
| Neighborhood / Area | Why Host Here? (Target Guests & Appeal) | Key Attractions & Landmarks |
|---|---|---|
| Beachburg | A charming village known for its proximity to natural beauty and outdoor activities. Popular with tourists who enjoy nature, hiking, and water sports, making it an attractive location for Airbnb hosting. | Petawawa National Park, Ottawa River, Algonquin Provincial Park, local craft breweries, hiking trails |
| Cobden | Nestled between scenic landscapes and the Ottawa River, Cobden attracts visitors seeking a peaceful retreat. It's ideal for Airbnb hosting due to its relaxed atmosphere and access to outdoor adventures. | Ottawa River, local farms, outdoor recreational areas, Tay Valley Trail, Cobden Fair Grounds |
| Eganville | Known for its rich history and natural beauty, Eganville is a quaint destination for visitors looking to explore rural Ontario. Popular for weekend getaways, it provides opportunities for Airbnb hosts. | Bonnechere Caves, Eganville's Old Mill, local art galleries, hiking in the area, community events |
| Pembroke | A larger town providing access to shops and amenities, Pembroke is a hub for visitors to the Ottawa Valley. Its variety of attractions makes it a solid choice for Airbnb investments. | Champlain Trail Museum, Ottawa River, Pembroke Heritage Murals, Kinsmen Park, local festivals |
| Renfrew | Rich in heritage, Renfrew offers a mix of suburban life and access to nature. It attracts visitors looking for a blend of culture and outdoor activities, appealing to potential Airbnb hosts. | Renfrew County Museum, the Ottawa River, local shops, hiking areas around, community events |
| Whitewater Region | This region offers stunning landscapes and numerous recreational activities. It's known for its vibrant community and beautiful vistas, making it a wonderful place for hosting Airbnb guests. | Whitewater rafting, local parks, natural trails, scenic viewpoints, participation in local festivals |
| Griffith | A picturesque small community surrounded by forests and lakes, Griffith is ideal for those seeking quiet and tranquility. Perfect for nature lovers looking for a peaceful Airbnb getaway. | Mazinaw Lake, local hiking trails, outdoor adventures, relaxation spots, campgrounds |
| Killaloe | This small, welcoming village offers a combination of culture and natural beauty. Visitors seeking a rustic experience often choose this area for its charm and peaceful environment, making it a great Airbnb location. | local artisan shops, nature trails, community festivities, Killaloe's historic sites, the nearby lakes |
Understanding Airbnb License Requirements & STR Laws in Whitewater Region (2025)
While Whitewater Region, Ontario, Canada currently shows low STR regulations, specific Airbnb license requirements might still exist or change. Always verify the latest short term rental regulations and Airbnb license requirements directly with local government authorities for Whitewater Region to ensure full compliance before hosting.
(Source: AirROI data, 2025, finding no licensed listings among those analyzed)
Top Performing Airbnb Properties in Whitewater Region (2025)
Benchmark your potential! Explore examples of top-performing Airbnb properties in Whitewater Regionbased on Trailing Twelve Month (TTM) revenue. Analyze their characteristics, revenue, occupancy rate, and ADR to understand what drives success in this market.
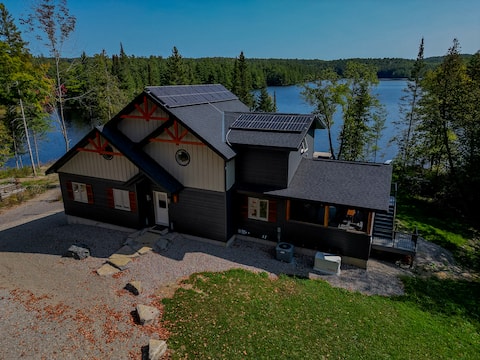
Off-Grid Waterfront Retreat!
Entire Place • 4 bedrooms
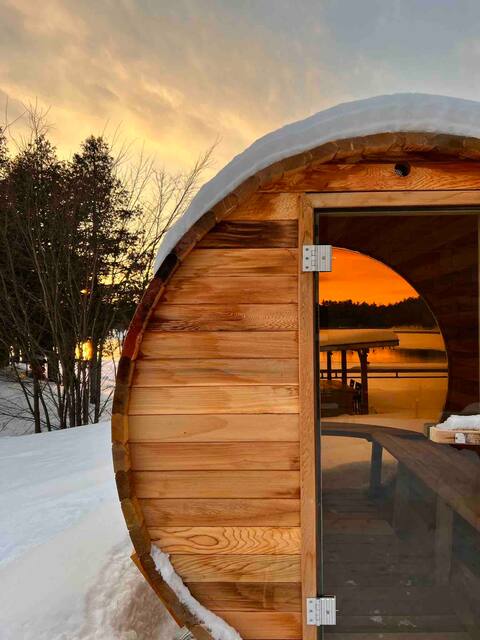
Luxury Beachfront Cottage w Hot tub, Sauna & Bar
Entire Place • 5 bedrooms
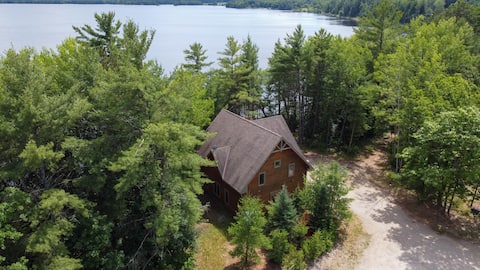
Luxurious Lake House
Entire Place • 3 bedrooms
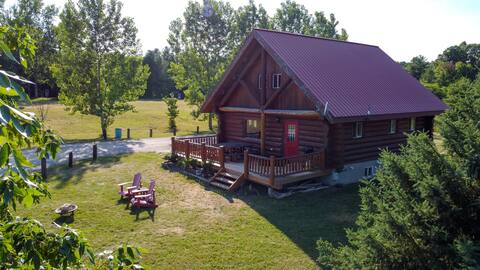
Authentic Log Cabin
Entire Place • 4 bedrooms
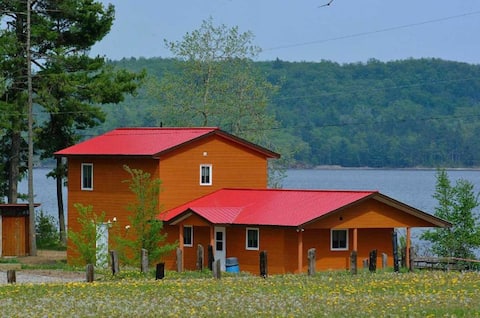
Lakefront Beach House
Entire Place • 4 bedrooms
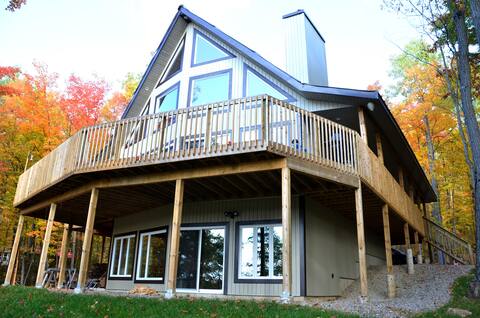
Redwing Lake House
Entire Place • 4 bedrooms
Note: Performance varies based on location, size, amenities, seasonality, and management quality. Data reflects the past 12 months.
Top Performing Airbnb Hosts in Whitewater Region (2025)
Learn from the best! This table showcases top-performing Airbnb hosts in Whitewater Region based on the number of properties managed and estimated total revenue over the past year. Analyze their scale and performance metrics.
| Host Name | Properties | Grossing Revenue | Stay Reviews | Avg Rating |
|---|---|---|---|---|
| Paul | 16 | $342,116 | 296 | 4.79/5.0 |
| Tim | 1 | $88,204 | 7 | 5.00/5.0 |
| Aislyn | 1 | $86,488 | 46 | 4.67/5.0 |
| Chantelle | 2 | $54,644 | 106 | 5.00/5.0 |
| Linda | 1 | $41,008 | 21 | 4.90/5.0 |
| Maegan | 1 | $40,347 | 25 | 4.84/5.0 |
| Donald | 2 | $36,030 | 208 | 4.97/5.0 |
| Linda | 1 | $34,815 | 34 | 4.97/5.0 |
| Ben | 1 | $34,695 | 39 | 4.79/5.0 |
| Brad | 1 | $33,345 | 16 | 4.88/5.0 |
Analyzing the strategies of top hosts, such as their property selection, pricing, and guest communication, can offer valuable lessons for optimizing your own Airbnb operations in Whitewater Region.
Dive Deeper: Advanced Whitewater Region STR Market Data (2025)
Ready to unlock more insights? AirROI provides access to advanced metrics and comprehensive Airbnb data for Whitewater Region. Explore detailed analytics beyond this report to refine your investment strategy, optimize pricing, and maximize your vacation rental profits.
Explore Advanced MetricsWhitewater Region Short-Term Rental Market Composition (2025): Property & Room Types
Room Type Distribution
Property Type Distribution
Market Composition Insights for Whitewater Region
- The Whitewater Region Airbnb market composition is heavily skewed towards Entire Home/Apt listings, which make up 97.6% of the 42 active rentals. This indicates strong guest preference for privacy and space.
- Looking at the property type distribution in Whitewater Region, House properties are the most common (64.3%), reflecting the local real estate landscape.
- Houses represent a significant 64.3% portion, catering likely to families or larger groups.
- The presence of 9.5% Hotel/Boutique listings indicates integration with traditional hospitality.
Whitewater Region Airbnb Room Capacity Analysis (2025): Bedroom Distribution
Distribution of Listings by Number of Bedrooms
Room Capacity Insights for Whitewater Region
- The dominant room capacity in Whitewater Region is 1 bedroom listings, making up 35.7% of the market. This suggests a strong demand for properties suitable for couples or solo travelers.
- Together, 1 bedroom and 3 bedrooms properties represent 59.5% of the active Airbnb listings in Whitewater Region, indicating a high concentration in these sizes.
- A significant 40.5% of listings offer 3+ bedrooms, catering to larger groups and families seeking more space in Whitewater Region.
Whitewater Region Vacation Rental Guest Capacity Trends (2025)
Distribution of Listings by Guest Capacity
Guest Capacity Insights for Whitewater Region
- The most common guest capacity trend in Whitewater Region vacation rentals is listings accommodating 8+ guests (38.1%). This suggests the primary traveler segment is likely larger groups.
- Properties designed for 8+ guests and 6 guests dominate the Whitewater Region STR market, accounting for 66.7% of listings.
- 69.1% of properties accommodate 6+ guests, serving the market segment for larger families or group travel in Whitewater Region.
- On average, properties in Whitewater Region are equipped to host 6.0 guests.
Whitewater Region Airbnb Booking Patterns (2025): Available vs. Booked Days
Available Days Distribution
Booked Days Distribution
Booking Pattern Insights for Whitewater Region
- The most common availability pattern in Whitewater Region falls within the 181-270 days range, representing 52.4% of listings. This suggests many properties have significant open periods on their calendars.
- Approximately 95.3% of listings show high availability (181+ days open annually), indicating potential for increased bookings or specific owner usage patterns.
- For booked days, the 91-180 days range is most frequent in Whitewater Region (50%), reflecting common guest stay durations or potential owner blocking patterns.
- A notable 7.1% of properties secure long booking periods (181+ days booked per year), highlighting successful long-term rental strategies or significant owner usage.
Whitewater Region Airbnb Minimum Stay Requirements Analysis
Distribution of Listings by Minimum Night Requirement
1 Night
20 listings
51.3% of total
2 Nights
15 listings
38.5% of total
3 Nights
2 listings
5.1% of total
30+ Nights
2 listings
5.1% of total
Key Insights
- The most prevalent minimum stay requirement in Whitewater Region is 1 Night, adopted by 51.3% of listings. This highlights the market's preference for shorter, flexible bookings.
- A strong majority (89.8%) of the Whitewater Region Airbnb data shows acceptance of very short stays (1-2 nights), indicating a dynamic, high-turnover market.
Recommendations
- Align with the market by considering a 1 Night minimum stay, as 51.3% of Whitewater Region hosts use this setting.
- Explore offering discounts for stays of 30+ nights to attract the 5.1% of the market seeking extended stays.
- Adjust minimum nights based on seasonality – potentially shorter during low season and longer during peak demand periods in Whitewater Region.
Whitewater Region Airbnb Cancellation Policy Trends Analysis (2025)
Flexible
3 listings
8.1% of total
Moderate
8 listings
21.6% of total
Firm
22 listings
59.5% of total
Strict
4 listings
10.8% of total
Cancellation Policy Insights for Whitewater Region
- The prevailing Airbnb cancellation policy trend in Whitewater Region is Firm, used by 59.5% of listings.
- A majority (70.3%) of hosts in Whitewater Region utilize Firm or Strict policies, indicating a market where hosts prioritize booking security.
Recommendations for Hosts
- Consider adopting a Firm policy to align with the 59.5% market standard in Whitewater Region.
- Using a Strict policy might deter some guests, as only 10.8% of listings use it. Evaluate if potential revenue protection outweighs possible lower booking rates.
- Regularly review your cancellation policy against competitors and market demand shifts in Whitewater Region.
Whitewater Region STR Booking Lead Time Analysis (2025)
Average Booking Lead Time by Month
Booking Lead Time Insights for Whitewater Region
- The overall average booking lead time for vacation rentals in Whitewater Region is 41 days.
- Guests book furthest in advance for stays during July (average 104 days), likely coinciding with peak travel demand or local events.
- The shortest booking windows occur for stays in March (average 22 days), indicating more last-minute travel plans during this time.
- Seasonally, Summer (79 days avg.) sees the longest lead times, while Spring (47 days avg.) has the shortest, reflecting typical travel planning cycles.
Recommendations for Hosts
- Use the overall average lead time (41 days) as a baseline for your pricing and availability strategy in Whitewater Region.
- For July stays, consider implementing length-of-stay discounts or slightly higher rates for bookings made less than 104 days out to capitalize on advance planning.
- Target marketing efforts for the Summer season well in advance (at least 79 days) to capture early planners.
- Monitor your own booking lead times against these Whitewater Region averages to identify opportunities for dynamic pricing adjustments.
Popular & Essential Airbnb Amenities in Whitewater Region (2025)
Amenity Prevalence
Amenity Insights for Whitewater Region
- Essential amenities in Whitewater Region that guests expect include: Free parking on premises. Lacking these (this) could significantly impact bookings.
- Popular amenities like Smoke alarm, Heating, Fire extinguisher are common but not universal. Offering these can provide a competitive edge.
Recommendations for Hosts
- Ensure your listing includes all essential amenities for Whitewater Region: Free parking on premises.
- Consider adding popular differentiators like Smoke alarm or Heating to increase appeal.
- Highlight unique or less common amenities you offer (e.g., hot tub, dedicated workspace, EV charger) in your listing description and photos.
- Regularly check competitor amenities in Whitewater Region to stay competitive.
Whitewater Region Airbnb Guest Demographics & Profile Analysis (2025)
Guest Profile Summary for Whitewater Region
- The typical guest profile for Airbnb in Whitewater Region consists of primarily domestic travelers (87%), often arriving from nearby Ottawa, typically belonging to the Post-2000s (Gen Z/Alpha) group (50%), primarily speaking English or French.
- Domestic travelers account for 86.5% of guests.
- Key international markets include Canada (86.5%) and United States (5.7%).
- Top languages spoken are English (56.4%) followed by French (21.2%).
- A significant demographic segment is the Post-2000s (Gen Z/Alpha) group, representing 50% of guests.
Recommendations for Hosts
- Target domestic marketing efforts towards travelers from Ottawa and Toronto.
- Tailor amenities and listing descriptions to appeal to the dominant Post-2000s (Gen Z/Alpha) demographic (e.g., highlight fast WiFi, smart home features, local guides).
- Highlight unique local experiences or amenities relevant to the primary guest profile.
- Consider seasonal promotions aligned with peak travel times for key origin markets.
Nearby Short-Term Rental Market Comparison
How does the Whitewater Region Airbnb market stack up against its neighbors? Compare key performance metrics like average monthly revenue, ADR, and occupancy rates in surrounding areas to understand the broader regional STR landscape.
| Market | Active Properties | Monthly Revenue | Daily Rate | Avg. Occupancy |
|---|---|---|---|---|
| Cantley | 22 | $3,741 | $242.96 | 50% |
| Carrying Place | 20 | $3,737 | $315.96 | 48% |
| Rossmore | 10 | $3,345 | $268.20 | 56% |
| Town of Lyme | 29 | $3,140 | $268.25 | 46% |
| Val-des-Monts | 120 | $2,907 | $234.15 | 47% |
| Stirling-Rawdon | 13 | $2,872 | $222.78 | 44% |
| Westport | 14 | $2,743 | $301.70 | 33% |
| Beckwith | 13 | $2,740 | $258.12 | 38% |
| Prince Edward County | 12 | $2,587 | $281.43 | 45% |
| Town of Canton | 32 | $2,579 | $297.78 | 41% |