Tiny Airbnb Market Analysis 2025: Short Term Rental Data & Vacation Rental Statistics in Ontario, Canada
Is Airbnb profitable in Tiny in 2025? Explore comprehensive Airbnb analytics for Tiny, Ontario, Canada to uncover income potential. This 2025 STR market report for Tiny, based on AirROI data from April 2024 to March 2025, reveals key trends in the niche market of 193 active listings.
Whether you're considering an Airbnb investment in Tiny, optimizing your existing vacation rental, or exploring rental arbitrage opportunities, understanding the Tiny Airbnb data is crucial. Understanding the local regulations is key to maximizing your short term rental income potential. Let's dive into the specifics.
Key Tiny Airbnb Performance Metrics Overview
Monthly Airbnb Revenue Variations & Income Potential in Tiny (2025)
Understanding the monthly revenue variations for Airbnb listings in Tiny is key to maximizing your short term rental income potential. Seasonality significantly impacts earnings. Our analysis, based on data from the past 12 months, shows that the peak revenue month for STRs in Tiny is typically August, while October often presents the lowest earnings, highlighting opportunities for strategic pricing adjustments during shoulder and low seasons. Explore the typical Airbnb income in Tiny across different performance tiers:
- Best-in-class properties (Top 10%) achieve $7,186+ monthly, often utilizing dynamic pricing and superior guest experiences.
- Strong performing properties (Top 25%) earn $4,756 or more, indicating effective management and desirable locations/amenities.
- Typical properties (Median) generate around $2,672 per month, representing the average market performance.
- Entry-level properties (Bottom 25%) see earnings around $1,311, often with potential for optimization.
Average Monthly Airbnb Earnings Trend in Tiny
Tiny Airbnb Occupancy Rate Trends (2025)
Maximize your bookings by understanding the Tiny STR occupancy trends. Seasonal demand shifts significantly influence how often properties are booked. Typically, Augustsees the highest demand (peak season occupancy), while October experiences the lowest (low season). Effective strategies, like adjusting minimum stays or offering promotions, can boost occupancy during slower periods. Here's how different property tiers perform in Tiny:
- Best-in-class properties (Top 10%) achieve 70%+ occupancy, indicating high desirability and potentially optimized availability.
- Strong performing properties (Top 25%) maintain 48% or higher occupancy, suggesting good market fit and guest satisfaction.
- Typical properties (Median) have an occupancy rate around 29%.
- Entry-level properties (Bottom 25%) average 15% occupancy, potentially facing higher vacancy.
Average Monthly Occupancy Rate Trend in Tiny
Average Daily Rate (ADR) Airbnb Trends in Tiny (2025)
Effective short term rental pricing strategy in Tiny involves understanding monthly ADR fluctuations. The Average Daily Rate (ADR) for Airbnb in Tiny typically peaks in July and dips lowest during March. Leveraging Airbnb dynamic pricing tools or strategies based on this seasonality can significantly boost revenue. Here's a look at the typical nightly rates achieved:
- Best-in-class properties (Top 10%) command rates of $485+ per night, often due to premium features or locations.
- Strong performing properties (Top 25%) achieve nightly rates of $343 or more.
- Typical properties (Median) charge around $235 per night.
- Entry-level properties (Bottom 25%) earn around $174 per night.
Average Daily Rate (ADR) Trend by Month in Tiny
Get Live Tiny Market Intelligence 👇

Explore Real-time Analytics
Airbnb Seasonality Analysis & Trends in Tiny (2025)
Peak Season (August, July, June)
- Revenue averages $5,527 per month
- Occupancy rates average 49.8%
- Daily rates average $311
Shoulder Season
- Revenue averages $2,980 per month
- Occupancy maintains around 29.8%
- Daily rates hold near $284
Low Season (January, March, October)
- Revenue drops to average $2,506 per month
- Occupancy decreases to average 28.4%
- Daily rates adjust to average $277
Seasonality Insights for Tiny
- The Airbnb seasonality in Tiny shows highly seasonal trends requiring careful strategy. While the sections above show seasonal averages, it's also insightful to look at the extremes:
- During the high season, the absolute peak month showcases Tiny's highest earning potential, with monthly revenues capable of climbing to $6,631, occupancy reaching a high of 62.4%, and ADRs peaking at $314.
- Conversely, the slowest single month of the year, typically falling within the low season, marks the market's lowest point. In this month, revenue might dip to $2,497, occupancy could drop to 26.9%, and ADRs may adjust down to $263.
- Understanding both the seasonal averages and these monthly peaks and troughs in revenue, occupancy, and ADR is crucial for maximizing your Airbnb profit potential in Tiny.
Seasonal Strategies for Maximizing Profit
- Peak Season: Maximize revenue through premium pricing and potentially longer minimum stays. Ensure high availability.
- Low Season: Offer competitive pricing, special promotions (e.g., extended stay discounts), and flexible cancellation policies. Target off-season travelers like remote workers or budget-conscious guests.
- Shoulder Seasons: Implement dynamic pricing that balances peak and low rates. Target weekend travelers or specific events. Offer slightly more flexible terms than peak season.
- Regularly analyze your own performance against these Tiny seasonality benchmarks and adjust your pricing and availability strategy accordingly.
Best Areas for Airbnb Investment in Tiny (2025)
Exploring the top neighborhoods for short-term rentals in Tiny? This section highlights key areas, outlining why they are attractive for hosts and guests, along with notable local attractions. Consider these locations based on your target guest profile and investment strategy.
| Neighborhood / Area | Why Host Here? (Target Guests & Appeal) | Key Attractions & Landmarks |
|---|---|---|
| Tiny Beaches | Popular for summer vacations, with beautiful sandy shores along Georgian Bay. Ideal for families and beachgoers looking for a relaxing getaway. | Wasaga Beach, Lamont Creek Conservation Area, Tiny Marsh Provincial Wildlife Area, Reed's Bay, Bluewater Beach |
| Cranberry Point | A serene community known for its historical charm and access to waterfront activities. Attracts visitors seeking peace and nature. | Cranberry Marsh, Tiny Cove, Georgian Bay, local hiking trails |
| Thornbury | A quaint town offering a mix of scenic beauty and local culture, popular in both summer and winter. | Thornbury Harbour, Beaver Valley, Blue Mountain Resort, Apple pie shops |
| Penetanguishene | Rich in history and a gateway to the 30,000 Islands, it's great for boating and exploring. | Penetanguishene Bay, Discovery Harbour, Penetanguishene Museum, local marinas |
| Midland | A vibrant town with cultural events and historical attractions, making it suitable for year-round visitors. | Huronia Museum, Midland Cultural Centre, Little Lake Park, local shops and restaurants |
| Wyevale | A small community with rural charm, perfect for those looking to escape the hustle and bustle, attracts nature lovers. | local farms, nature trails, scenic views |
| Christian Island | Accessible by ferry, offers a unique cultural experience and beautiful landscapes. Attracts visitors interested in Indigenous culture. | Beaches, Fishing spots, Cultural experiences, Wildlife viewing |
| Awenda Provincial Park | A natural haven for outdoor enthusiasts with hiking, camping, and nature exploration right on Georgian Bay. | Hiking trails, Camping facilities, Beaches, Cycling paths |
Understanding Airbnb License Requirements & STR Laws in Tiny (2025)
With 16% of listings showing registration in 2025, understanding potential Airbnb license requirements is crucial in Tiny. Always verify the latest short term rental regulations and Airbnb license requirements directly with local government authorities for Tiny to ensure full compliance before hosting.
(Source: AirROI data, 2025, based on 16% licensed listings)
Top Performing Airbnb Properties in Tiny (2025)
Benchmark your potential! Explore examples of top-performing Airbnb properties in Tinybased on Trailing Twelve Month (TTM) revenue. Analyze their characteristics, revenue, occupancy rate, and ADR to understand what drives success in this market.
Welcome to The Luxury Among The Trees
Entire Place • 4 bedrooms

Tiny Oasis: Family Beach Cottage *HOT TUB & SAUNA*
Entire Place • 4 bedrooms

Rare Beachfront Cottage for Sun + Ski Lovers
Entire Place • 5 bedrooms

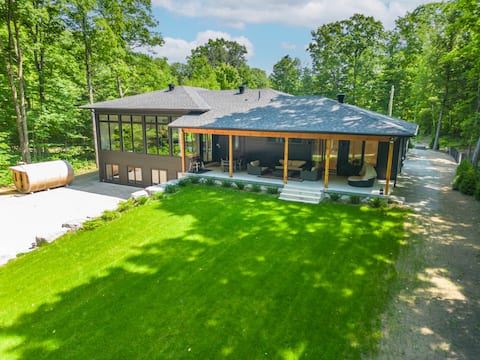
Stunning Modern Beach / Ski House
Entire Place • 5 bedrooms

*NEW* Breathtaking Estate in Tiny | Hot tub | Pool
Entire Place • 9 bedrooms
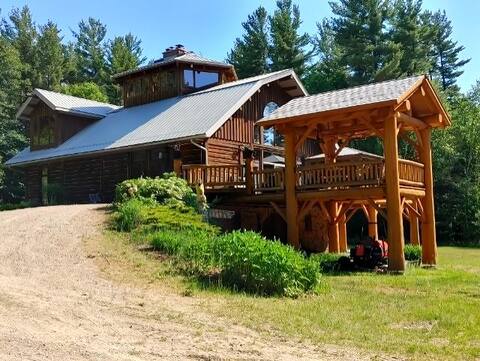
Beautiful log home with views - close to beaches
Entire Place • 4 bedrooms
Note: Performance varies based on location, size, amenities, seasonality, and management quality. Data reflects the past 12 months.
Top Performing Airbnb Hosts in Tiny (2025)
Learn from the best! This table showcases top-performing Airbnb hosts in Tiny based on the number of properties managed and estimated total revenue over the past year. Analyze their scale and performance metrics.
| Host Name | Properties | Grossing Revenue | Stay Reviews | Avg Rating |
|---|---|---|---|---|
| Frank | 6 | $163,111 | 130 | 4.92/5.0 |
| Nicole | 4 | $148,661 | 70 | 3.70/5.0 |
| Maia | 1 | $138,614 | 16 | 5.00/5.0 |
| Krista | 1 | $131,495 | 78 | 5.00/5.0 |
| Monica | 1 | $131,003 | 65 | 4.91/5.0 |
| John | 1 | $103,968 | 92 | 4.91/5.0 |
| Nicholas | 1 | $100,335 | 13 | 5.00/5.0 |
| Rosanna | 1 | $97,471 | 100 | 4.88/5.0 |
| Lee & Dessy | 1 | $83,934 | 68 | 4.90/5.0 |
| Mina | 1 | $74,010 | 64 | 4.86/5.0 |
Analyzing the strategies of top hosts, such as their property selection, pricing, and guest communication, can offer valuable lessons for optimizing your own Airbnb operations in Tiny.
Dive Deeper: Advanced Tiny STR Market Data (2025)
Ready to unlock more insights? AirROI provides access to advanced metrics and comprehensive Airbnb data for Tiny. Explore detailed analytics beyond this report to refine your investment strategy, optimize pricing, and maximize your vacation rental profits.
Explore Advanced MetricsTiny Short-Term Rental Market Composition (2025): Property & Room Types
Room Type Distribution
Property Type Distribution
Market Composition Insights for Tiny
- The Tiny Airbnb market composition is heavily skewed towards Entire Home/Apt listings, which make up 99.5% of the 193 active rentals. This indicates strong guest preference for privacy and space.
- Looking at the property type distribution in Tiny, House properties are the most common (87%), reflecting the local real estate landscape.
- Houses represent a significant 87% portion, catering likely to families or larger groups.
- Smaller segments like apartment/condo, others, hotel/boutique (combined 6.3%) offer potential for unique stay experiences.
Tiny Airbnb Room Capacity Analysis (2025): Bedroom Distribution
Distribution of Listings by Number of Bedrooms
Room Capacity Insights for Tiny
- The dominant room capacity in Tiny is 3 bedrooms listings, making up 37.8% of the market. This suggests a strong demand for properties suitable for families or small groups.
- Together, 3 bedrooms and 4 bedrooms properties represent 62.7% of the active Airbnb listings in Tiny, indicating a high concentration in these sizes.
- A significant 77.2% of listings offer 3+ bedrooms, catering to larger groups and families seeking more space in Tiny.
Tiny Vacation Rental Guest Capacity Trends (2025)
Distribution of Listings by Guest Capacity
Guest Capacity Insights for Tiny
- The most common guest capacity trend in Tiny vacation rentals is listings accommodating 8+ guests (43.5%). This suggests the primary traveler segment is likely larger groups.
- Properties designed for 8+ guests and 6 guests dominate the Tiny STR market, accounting for 78.7% of listings.
- 81.3% of properties accommodate 6+ guests, serving the market segment for larger families or group travel in Tiny.
- On average, properties in Tiny are equipped to host 6.5 guests.
Tiny Airbnb Booking Patterns (2025): Available vs. Booked Days
Available Days Distribution
Booked Days Distribution
Booking Pattern Insights for Tiny
- The most common availability pattern in Tiny falls within the 271-366 days range, representing 54.9% of listings. This suggests many properties have significant open periods on their calendars.
- Approximately 91.7% of listings show high availability (181+ days open annually), indicating potential for increased bookings or specific owner usage patterns.
- For booked days, the 91-180 days range is most frequent in Tiny (39.4%), reflecting common guest stay durations or potential owner blocking patterns.
- A notable 8.8% of properties secure long booking periods (181+ days booked per year), highlighting successful long-term rental strategies or significant owner usage.
Tiny Airbnb Minimum Stay Requirements Analysis
Distribution of Listings by Minimum Night Requirement
1 Night
9 listings
4.9% of total
2 Nights
78 listings
42.4% of total
3 Nights
13 listings
7.1% of total
4-6 Nights
24 listings
13% of total
7-29 Nights
36 listings
19.6% of total
30+ Nights
24 listings
13% of total
Key Insights
- The most prevalent minimum stay requirement in Tiny is 2 Nights, adopted by 42.4% of listings. This highlights the market's preference for shorter, flexible bookings.
- A significant segment (13%) caters to monthly stays (30+ nights) in Tiny, pointing to opportunities in the extended-stay market.
Recommendations
- Align with the market by considering a 2 Nights minimum stay, as 42.4% of Tiny hosts use this setting.
- If feasible, allowing 1-night stays, especially midweek or during low season, could capture last-minute bookings, as only 4.9% currently do.
- A 2-night minimum appears standard (42.4%). Consider this for weekends or peak periods.
- Explore offering discounts for stays of 30+ nights to attract the 13% of the market seeking extended stays.
- Adjust minimum nights based on seasonality – potentially shorter during low season and longer during peak demand periods in Tiny.
Tiny Airbnb Cancellation Policy Trends Analysis (2025)
Super Strict 60 Days
2 listings
1.1% of total
Super Strict 30 Days
1 listings
0.6% of total
Flexible
15 listings
8.6% of total
Moderate
33 listings
19% of total
Firm
55 listings
31.6% of total
Strict
68 listings
39.1% of total
Cancellation Policy Insights for Tiny
- The prevailing Airbnb cancellation policy trend in Tiny is Strict, used by 39.1% of listings.
- A majority (70.7%) of hosts in Tiny utilize Firm or Strict policies, indicating a market where hosts prioritize booking security.
Recommendations for Hosts
- Consider adopting a Strict policy to align with the 39.1% market standard in Tiny.
- With 39.1% using Strict terms, this is a viable option in Tiny, particularly for high-value properties or during peak demand periods.
- Regularly review your cancellation policy against competitors and market demand shifts in Tiny.
Tiny STR Booking Lead Time Analysis (2025)
Average Booking Lead Time by Month
Booking Lead Time Insights for Tiny
- The overall average booking lead time for vacation rentals in Tiny is 62 days.
- Guests book furthest in advance for stays during July (average 115 days), likely coinciding with peak travel demand or local events.
- The shortest booking windows occur for stays in March (average 34 days), indicating more last-minute travel plans during this time.
- Seasonally, Summer (97 days avg.) sees the longest lead times, while Winter (38 days avg.) has the shortest, reflecting typical travel planning cycles.
Recommendations for Hosts
- Use the overall average lead time (62 days) as a baseline for your pricing and availability strategy in Tiny.
- For July stays, consider implementing length-of-stay discounts or slightly higher rates for bookings made less than 115 days out to capitalize on advance planning.
- Target marketing efforts for the Summer season well in advance (at least 97 days) to capture early planners.
- Monitor your own booking lead times against these Tiny averages to identify opportunities for dynamic pricing adjustments.
Popular & Essential Airbnb Amenities in Tiny (2025)
Amenity Prevalence
Amenity Insights for Tiny
- Essential amenities in Tiny that guests expect include: Free parking on premises, Smoke alarm, Kitchen, Hot water, Wifi, BBQ grill. Lacking these (any) could significantly impact bookings.
- Popular amenities like Heating, Dishes and silverware, Refrigerator are common but not universal. Offering these can provide a competitive edge.
Recommendations for Hosts
- Ensure your listing includes all essential amenities for Tiny: Free parking on premises, Smoke alarm, Kitchen, Hot water, Wifi, BBQ grill.
- Prioritize adding missing essentials: Free parking on premises, Smoke alarm, Kitchen, Hot water, Wifi, BBQ grill.
- Consider adding popular differentiators like Heating or Dishes and silverware to increase appeal.
- Highlight unique or less common amenities you offer (e.g., hot tub, dedicated workspace, EV charger) in your listing description and photos.
- Regularly check competitor amenities in Tiny to stay competitive.
Tiny Airbnb Guest Demographics & Profile Analysis (2025)
Guest Profile Summary for Tiny
- The typical guest profile for Airbnb in Tiny consists of primarily domestic travelers (92%), often arriving from nearby Toronto, typically belonging to the Post-2000s (Gen Z/Alpha) group (50%), primarily speaking English or French.
- Domestic travelers account for 92.0% of guests.
- Key international markets include Canada (92%) and United States (4.7%).
- Top languages spoken are English (61.2%) followed by French (11%).
- A significant demographic segment is the Post-2000s (Gen Z/Alpha) group, representing 50% of guests.
Recommendations for Hosts
- Target domestic marketing efforts towards travelers from Toronto and Mississauga.
- Tailor amenities and listing descriptions to appeal to the dominant Post-2000s (Gen Z/Alpha) demographic (e.g., highlight fast WiFi, smart home features, local guides).
- Highlight unique local experiences or amenities relevant to the primary guest profile.
- Consider seasonal promotions aligned with peak travel times for key origin markets.
Nearby Short-Term Rental Market Comparison
How does the Tiny Airbnb market stack up against its neighbors? Compare key performance metrics like average monthly revenue, ADR, and occupancy rates in surrounding areas to understand the broader regional STR landscape.
| Market | Active Properties | Monthly Revenue | Daily Rate | Avg. Occupancy |
|---|---|---|---|---|
| McMurrich/Monteith Township | 26 | $3,922 | $372.53 | 42% |
| South River | 10 | $3,752 | $259.89 | 45% |
| Niagara-on-the-Lake | 413 | $3,358 | $265.20 | 44% |
| Muskoka Lakes Township | 376 | $3,060 | $435.47 | 38% |
| McKellar Township | 39 | $2,980 | $368.05 | 40% |
| Huntsville | 305 | $2,978 | $273.77 | 43% |
| Kearney | 59 | $2,897 | $263.86 | 44% |
| Bracebridge | 207 | $2,862 | $321.96 | 40% |
| Perry Township | 61 | $2,845 | $282.82 | 43% |
| Severn | 154 | $2,845 | $306.35 | 39% |