The North Shore Township Airbnb Market Analysis 2025: Short Term Rental Data & Vacation Rental Statistics in Ontario, Canada
Is Airbnb profitable in The North Shore Township in 2025? Explore comprehensive Airbnb analytics for The North Shore Township, Ontario, Canada to uncover income potential. This 2025 STR market report for The North Shore Township, based on AirROI data from April 2024 to March 2025, reveals key trends in the niche market of 17 active listings.
Whether you're considering an Airbnb investment in The North Shore Township, optimizing your existing vacation rental, or exploring rental arbitrage opportunities, understanding the The North Shore Township Airbnb data is crucial. Leveraging the low regulation environment is key to maximizing your short term rental income potential. Let's dive into the specifics.
Key The North Shore Township Airbnb Performance Metrics Overview
Monthly Airbnb Revenue Variations & Income Potential in The North Shore Township (2025)
Understanding the monthly revenue variations for Airbnb listings in The North Shore Township is key to maximizing your short term rental income potential. Seasonality significantly impacts earnings. Our analysis, based on data from the past 12 months, shows that the peak revenue month for STRs in The North Shore Township is typically July, while January often presents the lowest earnings, highlighting opportunities for strategic pricing adjustments during shoulder and low seasons. Explore the typical Airbnb income in The North Shore Township across different performance tiers:
- Best-in-class properties (Top 10%) achieve $4,591+ monthly, often utilizing dynamic pricing and superior guest experiences.
- Strong performing properties (Top 25%) earn $3,080 or more, indicating effective management and desirable locations/amenities.
- Typical properties (Median) generate around $1,453 per month, representing the average market performance.
- Entry-level properties (Bottom 25%) see earnings around $847, often with potential for optimization.
Average Monthly Airbnb Earnings Trend in The North Shore Township
The North Shore Township Airbnb Occupancy Rate Trends (2025)
Maximize your bookings by understanding the The North Shore Township STR occupancy trends. Seasonal demand shifts significantly influence how often properties are booked. Typically, Octobersees the highest demand (peak season occupancy), while January experiences the lowest (low season). Effective strategies, like adjusting minimum stays or offering promotions, can boost occupancy during slower periods. Here's how different property tiers perform in The North Shore Township:
- Best-in-class properties (Top 10%) achieve 62%+ occupancy, indicating high desirability and potentially optimized availability.
- Strong performing properties (Top 25%) maintain 53% or higher occupancy, suggesting good market fit and guest satisfaction.
- Typical properties (Median) have an occupancy rate around 25%.
- Entry-level properties (Bottom 25%) average 17% occupancy, potentially facing higher vacancy.
Average Monthly Occupancy Rate Trend in The North Shore Township
Average Daily Rate (ADR) Airbnb Trends in The North Shore Township (2025)
Effective short term rental pricing strategy in The North Shore Township involves understanding monthly ADR fluctuations. The Average Daily Rate (ADR) for Airbnb in The North Shore Township typically peaks in November and dips lowest during April. Leveraging Airbnb dynamic pricing tools or strategies based on this seasonality can significantly boost revenue. Here's a look at the typical nightly rates achieved:
- Best-in-class properties (Top 10%) command rates of $345+ per night, often due to premium features or locations.
- Strong performing properties (Top 25%) achieve nightly rates of $209 or more.
- Typical properties (Median) charge around $149 per night.
- Entry-level properties (Bottom 25%) earn around $126 per night.
Average Daily Rate (ADR) Trend by Month in The North Shore Township
Get Live The North Shore Township Market Intelligence 👇

Explore Real-time Analytics
Airbnb Seasonality Analysis & Trends in The North Shore Township (2025)
Peak Season (July, August, October)
- Revenue averages $3,428 per month
- Occupancy rates average 48.3%
- Daily rates average $177
Shoulder Season
- Revenue averages $2,191 per month
- Occupancy maintains around 32.8%
- Daily rates hold near $178
Low Season (January, March, December)
- Revenue drops to average $984 per month
- Occupancy decreases to average 17.0%
- Daily rates adjust to average $190
Seasonality Insights for The North Shore Township
- The Airbnb seasonality in The North Shore Township shows highly seasonal trends requiring careful strategy. While the sections above show seasonal averages, it's also insightful to look at the extremes:
- During the high season, the absolute peak month showcases The North Shore Township's highest earning potential, with monthly revenues capable of climbing to $3,684, occupancy reaching a high of 48.7%, and ADRs peaking at $191.
- Conversely, the slowest single month of the year, typically falling within the low season, marks the market's lowest point. In this month, revenue might dip to $692, occupancy could drop to 16.1%, and ADRs may adjust down to $168.
- Understanding both the seasonal averages and these monthly peaks and troughs in revenue, occupancy, and ADR is crucial for maximizing your Airbnb profit potential in The North Shore Township.
Seasonal Strategies for Maximizing Profit
- Peak Season: Maximize revenue through premium pricing and potentially longer minimum stays. Ensure high availability.
- Low Season: Offer competitive pricing, special promotions (e.g., extended stay discounts), and flexible cancellation policies. Target off-season travelers like remote workers or budget-conscious guests.
- Shoulder Seasons: Implement dynamic pricing that balances peak and low rates. Target weekend travelers or specific events. Offer slightly more flexible terms than peak season.
- Regularly analyze your own performance against these The North Shore Township seasonality benchmarks and adjust your pricing and availability strategy accordingly.
Best Areas for Airbnb Investment in The North Shore Township (2025)
Exploring the top neighborhoods for short-term rentals in The North Shore Township? This section highlights key areas, outlining why they are attractive for hosts and guests, along with notable local attractions. Consider these locations based on your target guest profile and investment strategy.
| Neighborhood / Area | Why Host Here? (Target Guests & Appeal) | Key Attractions & Landmarks |
|---|---|---|
| Collingwood | A popular tourist destination known for skiing in the winter and beautiful hiking and beaches in the summer. Its proximity to Blue Mountain Resort makes it a prime location for vacation rentals. | Blue Mountain Ski Resort, Georgian Bay, Collingwood Scenic Caves, Wasaga Beach, The Collingwood Museum |
| Wasaga Beach | Known for having the longest freshwater beach in the world, Wasaga Beach attracts families and tourists all summer. Ideal for both short-term and long-term rentals. | Wasaga Beach Provincial Park, The Beach Area, Nancy Island Historic Site, Skull Island Adventure Golf, Wasaga Sports Park |
| The Blue Mountains | This area offers year-round outdoor activities, from skiing in winter to mountain biking and hiking in summer. A favorite for nature lovers and adventure seekers. | Blue Mountain Resort, Scenic Caves Nature Adventures, The Blue Mountains wineries, The Village at Blue Mountain |
| Meaford | A charming small town with a lovely waterfront and access to natural attractions. Popular among those seeking a quieter getaway to enjoy the outdoors. | Meaford Harbour, Coffin Ridge Boutique Winery, Wiarton Willie, The Meaford Museum, Nearby hiking trails |
| Owen Sound | Known for its rich history and natural beauty, Owen Sound is positioned near the Niagara Escarpment and offers a variety of cultural and outdoor attractions. | Billy Bishop Museum, Owen Sound Marine & Rail Museum, Oliphant Beach, Harrison Park, Local art galleries and theaters |
| Georgian Bay | This picturesque area offers stunning waterfront views and a variety of outdoor activities, making it a prime location for vacation rentals and experiences. | Georgian Bay Islands National Park, Sailing and boating, Fishing spots, Hiking trails, Local beach access |
| Simcoe County | As a region encompassing various towns and natural attractions, Simcoe County provides diverse options for Airbnb with its array of outdoor activities and family-friendly destinations. | Lake Simcoe, Summer festivals, The Simcoe County Museum, Outdoor markets, Local parks |
| Blue Mountain Resort (Village Area) | As a vibrant hub for tourists year-round, the Village offers shopping, dining, and entertainment options with direct access to mountain activities, appealing to diverse groups. | The Village at Blue Mountain, Blue Mountain Golf Course, Scenic Gondola Rides, Dining and Shopping in the Village, Winter Sports Facilities |
Understanding Airbnb License Requirements & STR Laws in The North Shore Township (2025)
While The North Shore Township, Ontario, Canada currently shows low STR regulations, specific Airbnb license requirements might still exist or change. Always verify the latest short term rental regulations and Airbnb license requirements directly with local government authorities for The North Shore Township to ensure full compliance before hosting.
(Source: AirROI data, 2025, finding no licensed listings among those analyzed)
Top Performing Airbnb Properties in The North Shore Township (2025)
Benchmark your potential! Explore examples of top-performing Airbnb properties in The North Shore Townshipbased on Trailing Twelve Month (TTM) revenue. Analyze their characteristics, revenue, occupancy rate, and ADR to understand what drives success in this market.
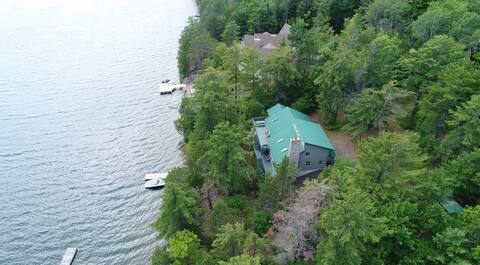
Serenity at Lake Lauzon
Entire Place • 5 bedrooms
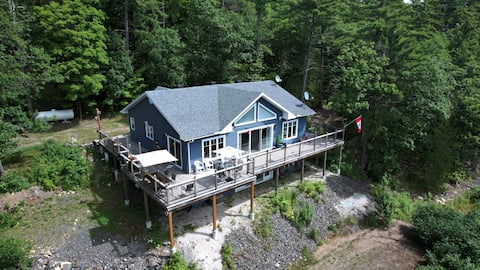
Serenity On Southridge Home Sweet Home
Entire Place • 4 bedrooms
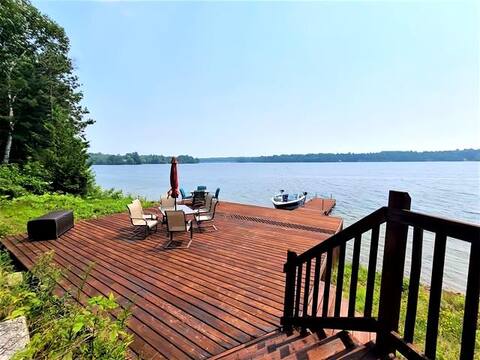
Spacious 3 BR Lake House on Lake Lauzon w/Deck!
Entire Place • 3 bedrooms
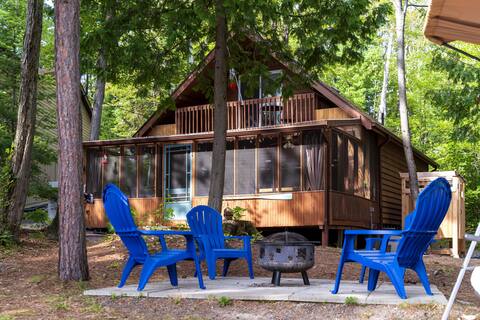
Lauzon Lake House Cottage A
Entire Place • 3 bedrooms

Lauzon Lake House Cottage B
Entire Place • 3 bedrooms

Cottage on the Bay
Entire Place • 1 bedroom
Note: Performance varies based on location, size, amenities, seasonality, and management quality. Data reflects the past 12 months.
Top Performing Airbnb Hosts in The North Shore Township (2025)
Learn from the best! This table showcases top-performing Airbnb hosts in The North Shore Township based on the number of properties managed and estimated total revenue over the past year. Analyze their scale and performance metrics.
| Host Name | Properties | Grossing Revenue | Stay Reviews | Avg Rating |
|---|---|---|---|---|
| Joe, Julie And Jeff | 2 | $57,300 | 106 | 4.93/5.0 |
| Adrienne | 1 | $50,461 | 131 | 4.92/5.0 |
| Tammy Lynn | 1 | $43,390 | 20 | 4.50/5.0 |
| Mark | 1 | $33,072 | 49 | 4.94/5.0 |
| Rachel | 4 | $28,901 | 67 | 4.92/5.0 |
| Sharon | 6 | $19,015 | 303 | 4.82/5.0 |
| Koreen | 1 | $9,621 | 9 | 4.89/5.0 |
| Host #211819350 | 1 | $4,944 | 0 | 0.00/5.0 |
Analyzing the strategies of top hosts, such as their property selection, pricing, and guest communication, can offer valuable lessons for optimizing your own Airbnb operations in The North Shore Township.
Dive Deeper: Advanced The North Shore Township STR Market Data (2025)
Ready to unlock more insights? AirROI provides access to advanced metrics and comprehensive Airbnb data for The North Shore Township. Explore detailed analytics beyond this report to refine your investment strategy, optimize pricing, and maximize your vacation rental profits.
Explore Advanced MetricsThe North Shore Township Short-Term Rental Market Composition (2025): Property & Room Types
Room Type Distribution
Property Type Distribution
Market Composition Insights for The North Shore Township
- The The North Shore Township Airbnb market composition is heavily skewed towards Entire Home/Apt listings, which make up 88.2% of the 17 active rentals. This indicates strong guest preference for privacy and space.
- Looking at the property type distribution in The North Shore Township, House properties are the most common (76.5%), reflecting the local real estate landscape.
- Houses represent a significant 76.5% portion, catering likely to families or larger groups.
- The presence of 11.8% Hotel/Boutique listings indicates integration with traditional hospitality.
The North Shore Township Airbnb Room Capacity Analysis (2025): Bedroom Distribution
Distribution of Listings by Number of Bedrooms
Room Capacity Insights for The North Shore Township
- The dominant room capacity in The North Shore Township is 3 bedrooms listings, making up 41.2% of the market. This suggests a strong demand for properties suitable for families or small groups.
- Together, 3 bedrooms and 1 bedroom properties represent 70.6% of the active Airbnb listings in The North Shore Township, indicating a high concentration in these sizes.
- A significant 58.9% of listings offer 3+ bedrooms, catering to larger groups and families seeking more space in The North Shore Township.
The North Shore Township Vacation Rental Guest Capacity Trends (2025)
Distribution of Listings by Guest Capacity
Guest Capacity Insights for The North Shore Township
- The most common guest capacity trend in The North Shore Township vacation rentals is listings accommodating 8+ guests (52.9%). This suggests the primary traveler segment is likely larger groups.
- Properties designed for 8+ guests and 4 guests dominate the The North Shore Township STR market, accounting for 76.4% of listings.
- 70.6% of properties accommodate 6+ guests, serving the market segment for larger families or group travel in The North Shore Township.
- On average, properties in The North Shore Township are equipped to host 6.4 guests.
The North Shore Township Airbnb Booking Patterns (2025): Available vs. Booked Days
Available Days Distribution
Booked Days Distribution
Booking Pattern Insights for The North Shore Township
- The most common availability pattern in The North Shore Township falls within the 271-366 days range, representing 70.6% of listings. This suggests many properties have significant open periods on their calendars.
- Approximately 100.0% of listings show high availability (181+ days open annually), indicating potential for increased bookings or specific owner usage patterns.
- For booked days, the 1-30 days range is most frequent in The North Shore Township (41.2%), reflecting common guest stay durations or potential owner blocking patterns.
The North Shore Township Airbnb Minimum Stay Requirements Analysis
Distribution of Listings by Minimum Night Requirement
1 Night
4 listings
25% of total
2 Nights
4 listings
25% of total
3 Nights
7 listings
43.8% of total
30+ Nights
1 listings
6.3% of total
Key Insights
- The most prevalent minimum stay requirement in The North Shore Township is 3 Nights, adopted by 43.8% of listings. This highlights the market's preference for longer commitments.
Recommendations
- Align with the market by considering a 3 Nights minimum stay, as 43.8% of The North Shore Township hosts use this setting.
- If feasible, allowing 1-night stays, especially midweek or during low season, could capture last-minute bookings, as only 25% currently do.
- Explore offering discounts for stays of 30+ nights to attract the 6.3% of the market seeking extended stays.
- Adjust minimum nights based on seasonality – potentially shorter during low season and longer during peak demand periods in The North Shore Township.
The North Shore Township Airbnb Cancellation Policy Trends Analysis (2025)
Flexible
1 listings
6.3% of total
Moderate
8 listings
50% of total
Strict
7 listings
43.8% of total
Cancellation Policy Insights for The North Shore Township
- The prevailing Airbnb cancellation policy trend in The North Shore Township is Moderate, used by 50% of listings.
- There's a relatively balanced mix between guest-friendly (56.3%) and stricter (43.8%) policies, offering choices for different guest needs.
Recommendations for Hosts
- Consider adopting a Moderate policy to align with the 50% market standard in The North Shore Township.
- With 43.8% using Strict terms, this is a viable option in The North Shore Township, particularly for high-value properties or during peak demand periods.
- Regularly review your cancellation policy against competitors and market demand shifts in The North Shore Township.
The North Shore Township STR Booking Lead Time Analysis (2025)
Average Booking Lead Time by Month
Booking Lead Time Insights for The North Shore Township
- The overall average booking lead time for vacation rentals in The North Shore Township is 72 days.
- Guests book furthest in advance for stays during April (average 193 days), likely coinciding with peak travel demand or local events.
- The shortest booking windows occur for stays in December (average 8 days), indicating more last-minute travel plans during this time.
- Seasonally, Spring (133 days avg.) sees the longest lead times, while Winter (20 days avg.) has the shortest, reflecting typical travel planning cycles.
Recommendations for Hosts
- Use the overall average lead time (72 days) as a baseline for your pricing and availability strategy in The North Shore Township.
- For April stays, consider implementing length-of-stay discounts or slightly higher rates for bookings made less than 193 days out to capitalize on advance planning.
- During December, focus on last-minute booking availability and promotions, as guests book with very short notice (8 days avg.).
- Target marketing efforts for the Spring season well in advance (at least 133 days) to capture early planners.
- Monitor your own booking lead times against these The North Shore Township averages to identify opportunities for dynamic pricing adjustments.
Popular & Essential Airbnb Amenities in The North Shore Township (2025)
Amenity Prevalence
Amenity Insights for The North Shore Township
- Essential amenities in The North Shore Township that guests expect include: Fire extinguisher, Smoke alarm, Free parking on premises. Lacking these (any) could significantly impact bookings.
- Popular amenities like Heating, Lake access, Hot water are common but not universal. Offering these can provide a competitive edge.
Recommendations for Hosts
- Ensure your listing includes all essential amenities for The North Shore Township: Fire extinguisher, Smoke alarm, Free parking on premises.
- Consider adding popular differentiators like Heating or Lake access to increase appeal.
- Highlight unique or less common amenities you offer (e.g., hot tub, dedicated workspace, EV charger) in your listing description and photos.
- Regularly check competitor amenities in The North Shore Township to stay competitive.
The North Shore Township Airbnb Guest Demographics & Profile Analysis (2025)
Guest Profile Summary for The North Shore Township
- The typical guest profile for Airbnb in The North Shore Township consists of primarily domestic travelers (80%), often arriving from nearby Sudbury, typically belonging to the Post-2000s (Gen Z/Alpha) group (50%), primarily speaking English or French.
- Domestic travelers account for 80.3% of guests.
- Key international markets include Canada (80.3%) and United States (15.5%).
- Top languages spoken are English (72.2%) followed by French (13.9%).
- A significant demographic segment is the Post-2000s (Gen Z/Alpha) group, representing 50% of guests.
Recommendations for Hosts
- Target domestic marketing efforts towards travelers from Sudbury and Toronto.
- Tailor amenities and listing descriptions to appeal to the dominant Post-2000s (Gen Z/Alpha) demographic (e.g., highlight fast WiFi, smart home features, local guides).
- Highlight unique local experiences or amenities relevant to the primary guest profile.
- Consider seasonal promotions aligned with peak travel times for key origin markets.
Nearby Short-Term Rental Market Comparison
How does the The North Shore Township Airbnb market stack up against its neighbors? Compare key performance metrics like average monthly revenue, ADR, and occupancy rates in surrounding areas to understand the broader regional STR landscape.
| Market | Active Properties | Monthly Revenue | Daily Rate | Avg. Occupancy |
|---|---|---|---|---|
| Presque Isle Township | 22 | $2,845 | $292.96 | 49% |
| Alpena Township | 17 | $2,484 | $240.60 | 50% |
| Killarney | 13 | $2,397 | $227.46 | 52% |
| Tobermory | 68 | $2,338 | $241.08 | 45% |
| Municipality of Northern Bruce Peninsula | 340 | $2,334 | $228.26 | 47% |
| Drummond Township | 42 | $2,173 | $271.91 | 39% |
| Detour Township | 12 | $2,125 | $227.57 | 45% |
| Blind River | 15 | $2,073 | $165.58 | 53% |
| Alpena | 41 | $2,007 | $175.57 | 50% |
| Huron Shores | 12 | $1,948 | $154.53 | 49% |