Springwater Airbnb Market Analysis 2025: Short Term Rental Data & Vacation Rental Statistics in Ontario, Canada
Is Airbnb profitable in Springwater in 2025? Explore comprehensive Airbnb analytics for Springwater, Ontario, Canada to uncover income potential. This 2025 STR market report for Springwater, based on AirROI data from April 2024 to March 2025, reveals key trends in the niche market of 46 active listings.
Whether you're considering an Airbnb investment in Springwater, optimizing your existing vacation rental, or exploring rental arbitrage opportunities, understanding the Springwater Airbnb data is crucial. Leveraging the low regulation environment is key to maximizing your short term rental income potential. Let's dive into the specifics.
Key Springwater Airbnb Performance Metrics Overview
Monthly Airbnb Revenue Variations & Income Potential in Springwater (2025)
Understanding the monthly revenue variations for Airbnb listings in Springwater is key to maximizing your short term rental income potential. Seasonality significantly impacts earnings. Our analysis, based on data from the past 12 months, shows that the peak revenue month for STRs in Springwater is typically August, while November often presents the lowest earnings, highlighting opportunities for strategic pricing adjustments during shoulder and low seasons. Explore the typical Airbnb income in Springwater across different performance tiers:
- Best-in-class properties (Top 10%) achieve $7,690+ monthly, often utilizing dynamic pricing and superior guest experiences.
- Strong performing properties (Top 25%) earn $4,653 or more, indicating effective management and desirable locations/amenities.
- Typical properties (Median) generate around $2,686 per month, representing the average market performance.
- Entry-level properties (Bottom 25%) see earnings around $1,298, often with potential for optimization.
Average Monthly Airbnb Earnings Trend in Springwater
Springwater Airbnb Occupancy Rate Trends (2025)
Maximize your bookings by understanding the Springwater STR occupancy trends. Seasonal demand shifts significantly influence how often properties are booked. Typically, Augustsees the highest demand (peak season occupancy), while February experiences the lowest (low season). Effective strategies, like adjusting minimum stays or offering promotions, can boost occupancy during slower periods. Here's how different property tiers perform in Springwater:
- Best-in-class properties (Top 10%) achieve 75%+ occupancy, indicating high desirability and potentially optimized availability.
- Strong performing properties (Top 25%) maintain 53% or higher occupancy, suggesting good market fit and guest satisfaction.
- Typical properties (Median) have an occupancy rate around 35%.
- Entry-level properties (Bottom 25%) average 18% occupancy, potentially facing higher vacancy.
Average Monthly Occupancy Rate Trend in Springwater
Average Daily Rate (ADR) Airbnb Trends in Springwater (2025)
Effective short term rental pricing strategy in Springwater involves understanding monthly ADR fluctuations. The Average Daily Rate (ADR) for Airbnb in Springwater typically peaks in July and dips lowest during March. Leveraging Airbnb dynamic pricing tools or strategies based on this seasonality can significantly boost revenue. Here's a look at the typical nightly rates achieved:
- Best-in-class properties (Top 10%) command rates of $499+ per night, often due to premium features or locations.
- Strong performing properties (Top 25%) achieve nightly rates of $283 or more.
- Typical properties (Median) charge around $183 per night.
- Entry-level properties (Bottom 25%) earn around $112 per night.
Average Daily Rate (ADR) Trend by Month in Springwater
Get Live Springwater Market Intelligence 👇

Explore Real-time Analytics
Airbnb Seasonality Analysis & Trends in Springwater (2025)
Peak Season (August, May, July)
- Revenue averages $5,463 per month
- Occupancy rates average 55.0%
- Daily rates average $254
Shoulder Season
- Revenue averages $3,559 per month
- Occupancy maintains around 34.1%
- Daily rates hold near $240
Low Season (February, October, November)
- Revenue drops to average $2,280 per month
- Occupancy decreases to average 31.4%
- Daily rates adjust to average $232
Seasonality Insights for Springwater
- The Airbnb seasonality in Springwater shows highly seasonal trends requiring careful strategy. While the sections above show seasonal averages, it's also insightful to look at the extremes:
- During the high season, the absolute peak month showcases Springwater's highest earning potential, with monthly revenues capable of climbing to $5,640, occupancy reaching a high of 63.4%, and ADRs peaking at $260.
- Conversely, the slowest single month of the year, typically falling within the low season, marks the market's lowest point. In this month, revenue might dip to $2,015, occupancy could drop to 29.0%, and ADRs may adjust down to $225.
- Understanding both the seasonal averages and these monthly peaks and troughs in revenue, occupancy, and ADR is crucial for maximizing your Airbnb profit potential in Springwater.
Seasonal Strategies for Maximizing Profit
- Peak Season: Maximize revenue through premium pricing and potentially longer minimum stays. Ensure high availability.
- Low Season: Offer competitive pricing, special promotions (e.g., extended stay discounts), and flexible cancellation policies. Target off-season travelers like remote workers or budget-conscious guests.
- Shoulder Seasons: Implement dynamic pricing that balances peak and low rates. Target weekend travelers or specific events. Offer slightly more flexible terms than peak season.
- Regularly analyze your own performance against these Springwater seasonality benchmarks and adjust your pricing and availability strategy accordingly.
Best Areas for Airbnb Investment in Springwater (2025)
Exploring the top neighborhoods for short-term rentals in Springwater? This section highlights key areas, outlining why they are attractive for hosts and guests, along with notable local attractions. Consider these locations based on your target guest profile and investment strategy.
| Neighborhood / Area | Why Host Here? (Target Guests & Appeal) | Key Attractions & Landmarks |
|---|---|---|
| Collingwood | A popular destination for outdoor enthusiasts, known for its skiing and snowboarding in the winter and hiking and biking in the summer. Collingwood is near the beautiful Blue Mountain resort. | Blue Mountain Resort, Collingwood Heritage Museum, Hiking trails, Georgian Bay, Collingwood Downtown |
| Wasaga Beach | Famous for having the longest freshwater beach in the world, Wasaga Beach attracts many summer vacationers looking for sun and fun. It's an ideal location for families and beach lovers. | Wasaga Beach Provincial Park, The Wasaga Beach EcoPark, Beachfront Boardwalk, Wasaga Beach Arena, World's Longest Freshwater Beach |
| Barrie | A vibrant city located on the shores of Lake Simcoe, Barrie offers a mix of urban life and outdoor activities. It is a popular stop for those traveling north to ski resorts and cottages. | Barrie Waterfront, Tyndale Park, Spirit Catcher, Collier Street United Church, Snow Valley Ski Resort |
| Orillia | Known for its rich history and vibrant arts scene, Orillia is a charming option for visitors seeking cultural experiences along with natural beauty, with access to lakes and parks. | Lake Couchiching, Tudhope Park, Mariposa Market, Orillia Museum of Art and History, Casino Rama |
| Muskoka | The Muskoka region is often referred to as the 'Hamptons of the North' and is famous for its stunning lakes and upscale cottage properties, making it a sought-after summer destination. | Muskoka Lakes, Santa's Village, Lake Muskoka, Muskoka Wharf, Algonquin Provincial Park |
| Midland | Midland offers a unique blend of history and modern amenities, situated near the Trent-Severn Waterway. It's ideal for those looking to explore Georgian Bay and its surrounding nature. | Wye Marsh Wildlife Centre, Huronia Museum, Penetanguishene Lighthouse, Midland Cultural Centre, Sandy Beach Park |
| Simcoe County | This region provides diverse recreational activities, rich farmland, and scenic landscapes, appealing to nature and outdoor enthusiasts year-round. | Lakes Simcoe and Couchiching, Cultural hubs, Hiking trails and parks, Vineyards, Golf courses |
| Orillia and Lake Simcoe | Combining two great destinations, this area is not only rich in natural beauty but also offers various year-round activities, attracting diverse visitors. | Lake Simcoe, Casino Rama, Tudhope Park, Local wineries, Downtown Orillia's shops and restaurants |
Understanding Airbnb License Requirements & STR Laws in Springwater (2025)
While Springwater, Ontario, Canada currently shows low STR regulations, specific Airbnb license requirements might still exist or change. Always verify the latest short term rental regulations and Airbnb license requirements directly with local government authorities for Springwater to ensure full compliance before hosting.
(Source: AirROI data, 2025, finding no licensed listings among those analyzed)
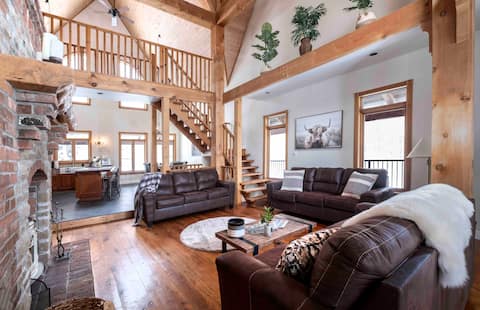
Top Performing Airbnb Properties in Springwater (2025)
Benchmark your potential! Explore examples of top-performing Airbnb properties in Springwaterbased on Trailing Twelve Month (TTM) revenue. Analyze their characteristics, revenue, occupancy rate, and ADR to understand what drives success in this market.

Private Chalet on 100 Acres w/ Hot Tub Near Wasaga
Entire Place • 5 bedrooms

Ski, Swim, Soak, Boat & Golf
Entire Place • 5 bedrooms
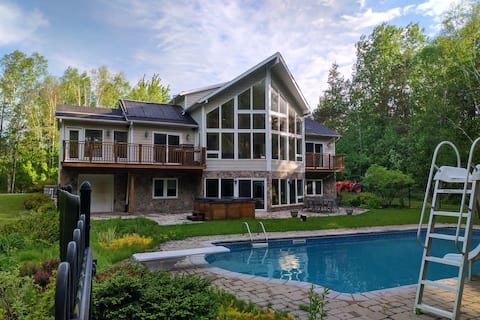
Dream Home Oasis; 7 bedroom, Hot Tub Swimming Pool
Entire Place • 7 bedrooms

Family-Friendly Cottage w/Hot Tub & Trails
Entire Place • 2 bedrooms
Mansion on 100 acres Nature Wasaga beach/Blue Mtn
Entire Place • 5 bedrooms

Orr Lake Waterfront|Firepit|Arcade|Mount St. Louis
Entire Place • 3 bedrooms
Note: Performance varies based on location, size, amenities, seasonality, and management quality. Data reflects the past 12 months.
Top Performing Airbnb Hosts in Springwater (2025)
Learn from the best! This table showcases top-performing Airbnb hosts in Springwater based on the number of properties managed and estimated total revenue over the past year. Analyze their scale and performance metrics.
| Host Name | Properties | Grossing Revenue | Stay Reviews | Avg Rating |
|---|---|---|---|---|
| Rahim | 2 | $268,726 | 76 | 4.78/5.0 |
| Jennifer | 5 | $139,148 | 96 | 3.93/5.0 |
| Herb | 1 | $92,247 | 60 | 4.90/5.0 |
| Wilson | 1 | $81,772 | 308 | 4.87/5.0 |
| Tammie | 1 | $74,140 | 30 | 5.00/5.0 |
| Edwin | 1 | $60,826 | 12 | 4.83/5.0 |
| Clair | 1 | $54,941 | 58 | 4.84/5.0 |
| Andrea | 1 | $54,461 | 101 | 4.88/5.0 |
| Jakub MycottageStay | 1 | $54,005 | 24 | 4.96/5.0 |
| Leslie | 2 | $52,594 | 54 | 2.46/5.0 |
Analyzing the strategies of top hosts, such as their property selection, pricing, and guest communication, can offer valuable lessons for optimizing your own Airbnb operations in Springwater.
Dive Deeper: Advanced Springwater STR Market Data (2025)
Ready to unlock more insights? AirROI provides access to advanced metrics and comprehensive Airbnb data for Springwater. Explore detailed analytics beyond this report to refine your investment strategy, optimize pricing, and maximize your vacation rental profits.
Explore Advanced MetricsSpringwater Short-Term Rental Market Composition (2025): Property & Room Types
Room Type Distribution
Property Type Distribution
Market Composition Insights for Springwater
- The Springwater Airbnb market composition is heavily skewed towards Entire Home/Apt listings, which make up 100% of the 46 active rentals. This indicates strong guest preference for privacy and space.
- Looking at the property type distribution in Springwater, House properties are the most common (56.5%), reflecting the local real estate landscape.
- Houses represent a significant 56.5% portion, catering likely to families or larger groups.
- Smaller segments like unique stays (combined 4.3%) offer potential for unique stay experiences.
Springwater Airbnb Room Capacity Analysis (2025): Bedroom Distribution
Distribution of Listings by Number of Bedrooms
Room Capacity Insights for Springwater
- The dominant room capacity in Springwater is 1 bedroom listings, making up 28.3% of the market. This suggests a strong demand for properties suitable for couples or solo travelers.
- Together, 1 bedroom and 3 bedrooms properties represent 50.0% of the active Airbnb listings in Springwater, indicating a high concentration in these sizes.
- A significant 52.1% of listings offer 3+ bedrooms, catering to larger groups and families seeking more space in Springwater.
Springwater Vacation Rental Guest Capacity Trends (2025)
Distribution of Listings by Guest Capacity
Guest Capacity Insights for Springwater
- The most common guest capacity trend in Springwater vacation rentals is listings accommodating 8+ guests (41.3%). This suggests the primary traveler segment is likely larger groups.
- Properties designed for 8+ guests and 6 guests dominate the Springwater STR market, accounting for 60.9% of listings.
- 63.1% of properties accommodate 6+ guests, serving the market segment for larger families or group travel in Springwater.
- On average, properties in Springwater are equipped to host 5.7 guests.
Springwater Airbnb Booking Patterns (2025): Available vs. Booked Days
Available Days Distribution
Booked Days Distribution
Booking Pattern Insights for Springwater
- The most common availability pattern in Springwater falls within the 181-270 days range, representing 39.1% of listings. This suggests many properties have significant open periods on their calendars.
- Approximately 73.9% of listings show high availability (181+ days open annually), indicating potential for increased bookings or specific owner usage patterns.
- For booked days, the 91-180 days range is most frequent in Springwater (37%), reflecting common guest stay durations or potential owner blocking patterns.
- A notable 28.2% of properties secure long booking periods (181+ days booked per year), highlighting successful long-term rental strategies or significant owner usage.
Springwater Airbnb Minimum Stay Requirements Analysis
Distribution of Listings by Minimum Night Requirement
1 Night
9 listings
20.5% of total
2 Nights
24 listings
54.5% of total
3 Nights
2 listings
4.5% of total
4-6 Nights
3 listings
6.8% of total
7-29 Nights
3 listings
6.8% of total
30+ Nights
3 listings
6.8% of total
Key Insights
- The most prevalent minimum stay requirement in Springwater is 2 Nights, adopted by 54.5% of listings. This highlights the market's preference for shorter, flexible bookings.
- A strong majority (75.0%) of the Springwater Airbnb data shows acceptance of very short stays (1-2 nights), indicating a dynamic, high-turnover market.
Recommendations
- Align with the market by considering a 2 Nights minimum stay, as 54.5% of Springwater hosts use this setting.
- If feasible, allowing 1-night stays, especially midweek or during low season, could capture last-minute bookings, as only 20.5% currently do.
- Explore offering discounts for stays of 30+ nights to attract the 6.8% of the market seeking extended stays.
- Adjust minimum nights based on seasonality – potentially shorter during low season and longer during peak demand periods in Springwater.
Springwater Airbnb Cancellation Policy Trends Analysis (2025)
Super Strict 30 Days
1 listings
2.4% of total
Flexible
6 listings
14.3% of total
Moderate
13 listings
31% of total
Firm
15 listings
35.7% of total
Strict
7 listings
16.7% of total
Cancellation Policy Insights for Springwater
- The prevailing Airbnb cancellation policy trend in Springwater is Firm, used by 35.7% of listings.
- A majority (52.4%) of hosts in Springwater utilize Firm or Strict policies, indicating a market where hosts prioritize booking security.
Recommendations for Hosts
- Consider adopting a Firm policy to align with the 35.7% market standard in Springwater.
- Regularly review your cancellation policy against competitors and market demand shifts in Springwater.
Springwater STR Booking Lead Time Analysis (2025)
Average Booking Lead Time by Month
Booking Lead Time Insights for Springwater
- The overall average booking lead time for vacation rentals in Springwater is 33 days.
- Guests book furthest in advance for stays during July (average 73 days), likely coinciding with peak travel demand or local events.
- The shortest booking windows occur for stays in November (average 26 days), indicating more last-minute travel plans during this time.
- Seasonally, Summer (55 days avg.) sees the longest lead times, while Fall (35 days avg.) has the shortest, reflecting typical travel planning cycles.
Recommendations for Hosts
- Use the overall average lead time (33 days) as a baseline for your pricing and availability strategy in Springwater.
- For July stays, consider implementing length-of-stay discounts or slightly higher rates for bookings made less than 73 days out to capitalize on advance planning.
- Target marketing efforts for the Summer season well in advance (at least 55 days) to capture early planners.
- Monitor your own booking lead times against these Springwater averages to identify opportunities for dynamic pricing adjustments.
Popular & Essential Airbnb Amenities in Springwater (2025)
Amenity Prevalence
Amenity Insights for Springwater
- Essential amenities in Springwater that guests expect include: Heating, Smoke alarm, Free parking on premises, Carbon monoxide alarm, Wifi, TV. Lacking these (any) could significantly impact bookings.
- Popular amenities like Hot water, Coffee maker, Dishes and silverware are common but not universal. Offering these can provide a competitive edge.
Recommendations for Hosts
- Ensure your listing includes all essential amenities for Springwater: Heating, Smoke alarm, Free parking on premises, Carbon monoxide alarm, Wifi, TV.
- Prioritize adding missing essentials: Heating, Smoke alarm, Free parking on premises, Carbon monoxide alarm, Wifi, TV.
- Consider adding popular differentiators like Hot water or Coffee maker to increase appeal.
- Highlight unique or less common amenities you offer (e.g., hot tub, dedicated workspace, EV charger) in your listing description and photos.
- Regularly check competitor amenities in Springwater to stay competitive.
Springwater Airbnb Guest Demographics & Profile Analysis (2025)
Guest Profile Summary for Springwater
- The typical guest profile for Airbnb in Springwater consists of primarily domestic travelers (91%), often arriving from nearby Toronto, typically belonging to the Post-2000s (Gen Z/Alpha) group (50%), primarily speaking English or French.
- Domestic travelers account for 91.3% of guests.
- Key international markets include Canada (91.3%) and United States (5%).
- Top languages spoken are English (64%) followed by French (11.1%).
- A significant demographic segment is the Post-2000s (Gen Z/Alpha) group, representing 50% of guests.
Recommendations for Hosts
- Target domestic marketing efforts towards travelers from Toronto and Mississauga.
- Tailor amenities and listing descriptions to appeal to the dominant Post-2000s (Gen Z/Alpha) demographic (e.g., highlight fast WiFi, smart home features, local guides).
- Highlight unique local experiences or amenities relevant to the primary guest profile.
- Consider seasonal promotions aligned with peak travel times for key origin markets.
Nearby Short-Term Rental Market Comparison
How does the Springwater Airbnb market stack up against its neighbors? Compare key performance metrics like average monthly revenue, ADR, and occupancy rates in surrounding areas to understand the broader regional STR landscape.
| Market | Active Properties | Monthly Revenue | Daily Rate | Avg. Occupancy |
|---|---|---|---|---|
| Town of Porter | 25 | $4,243 | $300.26 | 55% |
| McMurrich/Monteith Township | 26 | $3,922 | $372.53 | 42% |
| South River | 10 | $3,752 | $259.89 | 45% |
| Niagara-on-the-Lake | 413 | $3,358 | $265.20 | 44% |
| Town of Wilson | 27 | $3,195 | $257.32 | 48% |
| Muskoka Lakes Township | 376 | $3,060 | $435.47 | 38% |
| Dysart et al | 264 | $3,046 | $310.03 | 42% |
| McKellar Township | 39 | $2,980 | $368.05 | 40% |
| Huntsville | 305 | $2,978 | $273.77 | 43% |
| Trent Lakes | 197 | $2,968 | $331.60 | 38% |