South Bruce Peninsula Airbnb Market Analysis 2025: Short Term Rental Data & Vacation Rental Statistics in Ontario, Canada
Is Airbnb profitable in South Bruce Peninsula in 2025? Explore comprehensive Airbnb analytics for South Bruce Peninsula, Ontario, Canada to uncover income potential. This 2025 STR market report for South Bruce Peninsula, based on AirROI data from April 2024 to March 2025, reveals key trends in the niche market of 161 active listings.
Whether you're considering an Airbnb investment in South Bruce Peninsula, optimizing your existing vacation rental, or exploring rental arbitrage opportunities, understanding the South Bruce Peninsula Airbnb data is crucial. Leveraging the low regulation environment is key to maximizing your short term rental income potential. Let's dive into the specifics.
Key South Bruce Peninsula Airbnb Performance Metrics Overview
Monthly Airbnb Revenue Variations & Income Potential in South Bruce Peninsula (2025)
Understanding the monthly revenue variations for Airbnb listings in South Bruce Peninsula is key to maximizing your short term rental income potential. Seasonality significantly impacts earnings. Our analysis, based on data from the past 12 months, shows that the peak revenue month for STRs in South Bruce Peninsula is typically August, while February often presents the lowest earnings, highlighting opportunities for strategic pricing adjustments during shoulder and low seasons. Explore the typical Airbnb income in South Bruce Peninsula across different performance tiers:
- Best-in-class properties (Top 10%) achieve $5,797+ monthly, often utilizing dynamic pricing and superior guest experiences.
- Strong performing properties (Top 25%) earn $3,737 or more, indicating effective management and desirable locations/amenities.
- Typical properties (Median) generate around $2,121 per month, representing the average market performance.
- Entry-level properties (Bottom 25%) see earnings around $848, often with potential for optimization.
Average Monthly Airbnb Earnings Trend in South Bruce Peninsula
South Bruce Peninsula Airbnb Occupancy Rate Trends (2025)
Maximize your bookings by understanding the South Bruce Peninsula STR occupancy trends. Seasonal demand shifts significantly influence how often properties are booked. Typically, Augustsees the highest demand (peak season occupancy), while January experiences the lowest (low season). Effective strategies, like adjusting minimum stays or offering promotions, can boost occupancy during slower periods. Here's how different property tiers perform in South Bruce Peninsula:
- Best-in-class properties (Top 10%) achieve 72%+ occupancy, indicating high desirability and potentially optimized availability.
- Strong performing properties (Top 25%) maintain 50% or higher occupancy, suggesting good market fit and guest satisfaction.
- Typical properties (Median) have an occupancy rate around 29%.
- Entry-level properties (Bottom 25%) average 15% occupancy, potentially facing higher vacancy.
Average Monthly Occupancy Rate Trend in South Bruce Peninsula
Average Daily Rate (ADR) Airbnb Trends in South Bruce Peninsula (2025)
Effective short term rental pricing strategy in South Bruce Peninsula involves understanding monthly ADR fluctuations. The Average Daily Rate (ADR) for Airbnb in South Bruce Peninsula typically peaks in August and dips lowest during March. Leveraging Airbnb dynamic pricing tools or strategies based on this seasonality can significantly boost revenue. Here's a look at the typical nightly rates achieved:
- Best-in-class properties (Top 10%) command rates of $353+ per night, often due to premium features or locations.
- Strong performing properties (Top 25%) achieve nightly rates of $265 or more.
- Typical properties (Median) charge around $201 per night.
- Entry-level properties (Bottom 25%) earn around $147 per night.
Average Daily Rate (ADR) Trend by Month in South Bruce Peninsula
Get Live South Bruce Peninsula Market Intelligence 👇

Explore Real-time Analytics
Airbnb Seasonality Analysis & Trends in South Bruce Peninsula (2025)
Peak Season (August, July, June)
- Revenue averages $4,277 per month
- Occupancy rates average 50.7%
- Daily rates average $234
Shoulder Season
- Revenue averages $2,442 per month
- Occupancy maintains around 32.1%
- Daily rates hold near $214
Low Season (January, February, March)
- Revenue drops to average $1,622 per month
- Occupancy decreases to average 25.9%
- Daily rates adjust to average $206
Seasonality Insights for South Bruce Peninsula
- The Airbnb seasonality in South Bruce Peninsula shows highly seasonal trends requiring careful strategy. While the sections above show seasonal averages, it's also insightful to look at the extremes:
- During the high season, the absolute peak month showcases South Bruce Peninsula's highest earning potential, with monthly revenues capable of climbing to $4,877, occupancy reaching a high of 62.0%, and ADRs peaking at $237.
- Conversely, the slowest single month of the year, typically falling within the low season, marks the market's lowest point. In this month, revenue might dip to $1,528, occupancy could drop to 24.2%, and ADRs may adjust down to $203.
- Understanding both the seasonal averages and these monthly peaks and troughs in revenue, occupancy, and ADR is crucial for maximizing your Airbnb profit potential in South Bruce Peninsula.
Seasonal Strategies for Maximizing Profit
- Peak Season: Maximize revenue through premium pricing and potentially longer minimum stays. Ensure high availability.
- Low Season: Offer competitive pricing, special promotions (e.g., extended stay discounts), and flexible cancellation policies. Target off-season travelers like remote workers or budget-conscious guests.
- Shoulder Seasons: Implement dynamic pricing that balances peak and low rates. Target weekend travelers or specific events. Offer slightly more flexible terms than peak season.
- Regularly analyze your own performance against these South Bruce Peninsula seasonality benchmarks and adjust your pricing and availability strategy accordingly.
Best Areas for Airbnb Investment in South Bruce Peninsula (2025)
Exploring the top neighborhoods for short-term rentals in South Bruce Peninsula? This section highlights key areas, outlining why they are attractive for hosts and guests, along with notable local attractions. Consider these locations based on your target guest profile and investment strategy.
| Neighborhood / Area | Why Host Here? (Target Guests & Appeal) | Key Attractions & Landmarks |
|---|---|---|
| Sauble Beach | A popular beach destination known for its long, sandy beaches and vibrant summer atmosphere. Attracts families and travelers seeking sun, sand, and water sports. | Sauble Beach, Sauble Falls Provincial Park, Pinewoods Golf Course, Sauble River, Nearby hiking trails |
| Wiarton | Known for its friendly community and proximity to beautiful natural attractions, Wiarton is great for outdoor enthusiasts and those interested in local culture. | Wiarton Willie Statue, Bruce Peninsula National Park, Colpoys Bay, Wiarton Marina, Local shops and restaurants |
| Tobermory | Gateway to the stunning Bruce Peninsula National Park and Fathom Five National Marine Park, famous for its natural beauty and outdoor activities. A prime spot for eco-tourism. | Grotto at Bruce Peninsula National Park, Flowerpot Island, Fathom Five National Marine Park, Tobermory Harbour, Local boat tours |
| Pinery Provincial Park | A serene park offering beautiful beaches and wooded areas. Great for nature lovers and those looking to explore nature trails and lakes. | Pinery Provincial Park beaches, Nature trails, Kayaking and canoeing opportunities, Camping sites, Wildlife viewing |
| Lions Head | A charming village known for stunning views and outdoor activities such as hiking, making it popular with nature fans and those looking for a peaceful retreat. | Lions Head Provincial Nature Reserve, Bruce Trail, Lions Head Beach, Local art galleries, Scenic views |
| Owen Sound | A larger city with rich culture and history, offering various events, dining, and attractions suitable for families and tourists looking for a more urban experience. | Owen Sound Marine and Rail Museum, Tom Thomson Art Gallery, Harry Lumley Bayshore Community Centre, Colpoy's Bay, Nearby waterfalls |
| South Bruce Peninsula | Encompassing various small towns, this area offers a mix of nature, culture, and community charm, making it attractive for a diverse range of visitors. | Bruce Peninsula National Park, Beaches and lakes, Local festivals and events, Arts and crafts stores, Historic sites |
| Eugenia Falls | A less known but picturesque area featuring the falls and surrounding nature, perfect for those seeking a quiet getaway and outdoor activities. | Eugenia Falls, Hiking trails, Local cafes, Fishing spots, Scenic drives |
Understanding Airbnb License Requirements & STR Laws in South Bruce Peninsula (2025)
While South Bruce Peninsula, Ontario, Canada currently shows low STR regulations, specific Airbnb license requirements might still exist or change. Always verify the latest short term rental regulations and Airbnb license requirements directly with local government authorities for South Bruce Peninsula to ensure full compliance before hosting.
(Source: AirROI data, 2025, based on 2% licensed listings)
Top Performing Airbnb Properties in South Bruce Peninsula (2025)
Benchmark your potential! Explore examples of top-performing Airbnb properties in South Bruce Peninsulabased on Trailing Twelve Month (TTM) revenue. Analyze their characteristics, revenue, occupancy rate, and ADR to understand what drives success in this market.
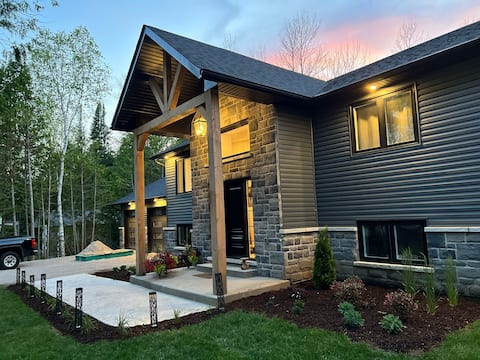
Newly Built Luxurious Cottage
Entire Place • 5 bedrooms
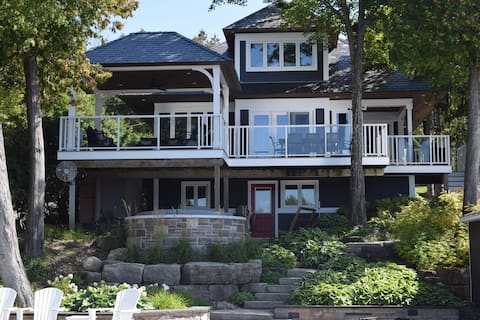
Sheltered Rest Cottage on Chesley Lake
Entire Place • 6 bedrooms

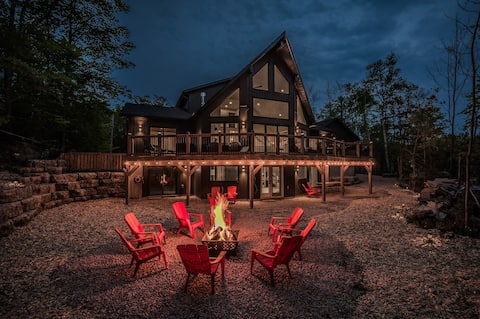
The south Bruce peninsula beauty
Entire Place • 5 bedrooms
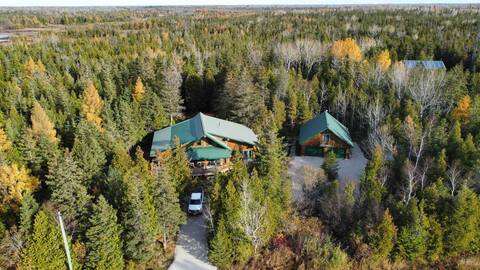
Show stopping retreat near beaches
Entire Place • 4 bedrooms

Heaframe - An A-Frame cabin in the woods
Entire Place • 3 bedrooms
The Morhaven-Hot tub +Sauna + Fire pit
Entire Place • 3 bedrooms
Note: Performance varies based on location, size, amenities, seasonality, and management quality. Data reflects the past 12 months.
Top Performing Airbnb Hosts in South Bruce Peninsula (2025)
Learn from the best! This table showcases top-performing Airbnb hosts in South Bruce Peninsula based on the number of properties managed and estimated total revenue over the past year. Analyze their scale and performance metrics.
| Host Name | Properties | Grossing Revenue | Stay Reviews | Avg Rating |
|---|---|---|---|---|
| Once Upon A Stay | 6 | $190,200 | 189 | 4.57/5.0 |
| Grey Bruce Cottages | 6 | $170,580 | 88 | 4.03/5.0 |
| Sal | 19 | $143,566 | 377 | 4.48/5.0 |
| Mat | 15 | $123,584 | 195 | 3.47/5.0 |
| Atilla | 1 | $107,366 | 38 | 4.68/5.0 |
| Glenda | 1 | $91,662 | 61 | 5.00/5.0 |
| Jer | 1 | $87,399 | 128 | 4.77/5.0 |
| Jodi | 4 | $71,897 | 176 | 4.84/5.0 |
| Reilly & Kourtney | 3 | $71,540 | 47 | 3.17/5.0 |
| Gordana | 1 | $70,826 | 19 | 5.00/5.0 |
Analyzing the strategies of top hosts, such as their property selection, pricing, and guest communication, can offer valuable lessons for optimizing your own Airbnb operations in South Bruce Peninsula.
Dive Deeper: Advanced South Bruce Peninsula STR Market Data (2025)
Ready to unlock more insights? AirROI provides access to advanced metrics and comprehensive Airbnb data for South Bruce Peninsula. Explore detailed analytics beyond this report to refine your investment strategy, optimize pricing, and maximize your vacation rental profits.
Explore Advanced MetricsSouth Bruce Peninsula Short-Term Rental Market Composition (2025): Property & Room Types
Room Type Distribution
Property Type Distribution
Market Composition Insights for South Bruce Peninsula
- The South Bruce Peninsula Airbnb market composition is heavily skewed towards Entire Home/Apt listings, which make up 92.5% of the 161 active rentals. This indicates strong guest preference for privacy and space.
- Looking at the property type distribution in South Bruce Peninsula, House properties are the most common (60.2%), reflecting the local real estate landscape.
- Houses represent a significant 60.2% portion, catering likely to families or larger groups.
- The presence of 6.8% Hotel/Boutique listings indicates integration with traditional hospitality.
- Smaller segments like others, apartment/condo (combined 3.8%) offer potential for unique stay experiences.
South Bruce Peninsula Airbnb Room Capacity Analysis (2025): Bedroom Distribution
Distribution of Listings by Number of Bedrooms
Room Capacity Insights for South Bruce Peninsula
- The dominant room capacity in South Bruce Peninsula is 3 bedrooms listings, making up 34.8% of the market. This suggests a strong demand for properties suitable for families or small groups.
- Together, 3 bedrooms and 1 bedroom properties represent 59.0% of the active Airbnb listings in South Bruce Peninsula, indicating a high concentration in these sizes.
- A significant 52.8% of listings offer 3+ bedrooms, catering to larger groups and families seeking more space in South Bruce Peninsula.
South Bruce Peninsula Vacation Rental Guest Capacity Trends (2025)
Distribution of Listings by Guest Capacity
Guest Capacity Insights for South Bruce Peninsula
- The most common guest capacity trend in South Bruce Peninsula vacation rentals is listings accommodating 8+ guests (26.1%). This suggests the primary traveler segment is likely larger groups.
- Properties designed for 8+ guests and 6 guests dominate the South Bruce Peninsula STR market, accounting for 50.3% of listings.
- 54.6% of properties accommodate 6+ guests, serving the market segment for larger families or group travel in South Bruce Peninsula.
- On average, properties in South Bruce Peninsula are equipped to host 5.4 guests.
South Bruce Peninsula Airbnb Booking Patterns (2025): Available vs. Booked Days
Available Days Distribution
Booked Days Distribution
Booking Pattern Insights for South Bruce Peninsula
- The most common availability pattern in South Bruce Peninsula falls within the 271-366 days range, representing 56.5% of listings. This suggests many properties have significant open periods on their calendars.
- Approximately 91.9% of listings show high availability (181+ days open annually), indicating potential for increased bookings or specific owner usage patterns.
- For booked days, the 91-180 days range is most frequent in South Bruce Peninsula (39.1%), reflecting common guest stay durations or potential owner blocking patterns.
- A notable 9.3% of properties secure long booking periods (181+ days booked per year), highlighting successful long-term rental strategies or significant owner usage.
South Bruce Peninsula Airbnb Minimum Stay Requirements Analysis
Distribution of Listings by Minimum Night Requirement
1 Night
31 listings
20% of total
2 Nights
65 listings
41.9% of total
3 Nights
18 listings
11.6% of total
4-6 Nights
10 listings
6.5% of total
7-29 Nights
9 listings
5.8% of total
30+ Nights
22 listings
14.2% of total
Key Insights
- The most prevalent minimum stay requirement in South Bruce Peninsula is 2 Nights, adopted by 41.9% of listings. This highlights the market's preference for shorter, flexible bookings.
- A strong majority (61.9%) of the South Bruce Peninsula Airbnb data shows acceptance of very short stays (1-2 nights), indicating a dynamic, high-turnover market.
- A significant segment (14.2%) caters to monthly stays (30+ nights) in South Bruce Peninsula, pointing to opportunities in the extended-stay market.
Recommendations
- Align with the market by considering a 2 Nights minimum stay, as 41.9% of South Bruce Peninsula hosts use this setting.
- If feasible, allowing 1-night stays, especially midweek or during low season, could capture last-minute bookings, as only 20% currently do.
- Explore offering discounts for stays of 30+ nights to attract the 14.2% of the market seeking extended stays.
- Adjust minimum nights based on seasonality – potentially shorter during low season and longer during peak demand periods in South Bruce Peninsula.
South Bruce Peninsula Airbnb Cancellation Policy Trends Analysis (2025)
Super Strict 30 Days
1 listings
0.7% of total
Flexible
18 listings
12.1% of total
Moderate
59 listings
39.6% of total
Firm
26 listings
17.4% of total
Strict
45 listings
30.2% of total
Cancellation Policy Insights for South Bruce Peninsula
- The prevailing Airbnb cancellation policy trend in South Bruce Peninsula is Moderate, used by 39.6% of listings.
- There's a relatively balanced mix between guest-friendly (51.7%) and stricter (47.6%) policies, offering choices for different guest needs.
Recommendations for Hosts
- Consider adopting a Moderate policy to align with the 39.6% market standard in South Bruce Peninsula.
- With 30.2% using Strict terms, this is a viable option in South Bruce Peninsula, particularly for high-value properties or during peak demand periods.
- Regularly review your cancellation policy against competitors and market demand shifts in South Bruce Peninsula.
South Bruce Peninsula STR Booking Lead Time Analysis (2025)
Average Booking Lead Time by Month
Booking Lead Time Insights for South Bruce Peninsula
- The overall average booking lead time for vacation rentals in South Bruce Peninsula is 53 days.
- Guests book furthest in advance for stays during August (average 85 days), likely coinciding with peak travel demand or local events.
- The shortest booking windows occur for stays in December (average 29 days), indicating more last-minute travel plans during this time.
- Seasonally, Summer (81 days avg.) sees the longest lead times, while Winter (43 days avg.) has the shortest, reflecting typical travel planning cycles.
Recommendations for Hosts
- Use the overall average lead time (53 days) as a baseline for your pricing and availability strategy in South Bruce Peninsula.
- For August stays, consider implementing length-of-stay discounts or slightly higher rates for bookings made less than 85 days out to capitalize on advance planning.
- Target marketing efforts for the Summer season well in advance (at least 81 days) to capture early planners.
- Monitor your own booking lead times against these South Bruce Peninsula averages to identify opportunities for dynamic pricing adjustments.
Popular & Essential Airbnb Amenities in South Bruce Peninsula (2025)
Amenity Prevalence
Amenity Insights for South Bruce Peninsula
- Essential amenities in South Bruce Peninsula that guests expect include: Free parking on premises. Lacking these (this) could significantly impact bookings.
- Popular amenities like Smoke alarm, Wifi, Hot water are common but not universal. Offering these can provide a competitive edge.
- Warning: Wifi is not universally provided but is considered essential globally. Ensure reliable Wifi is offered.
Recommendations for Hosts
- Ensure your listing includes all essential amenities for South Bruce Peninsula: Free parking on premises.
- Prioritize adding missing essentials: Free parking on premises.
- Consider adding popular differentiators like Smoke alarm or Wifi to increase appeal.
- Highlight unique or less common amenities you offer (e.g., hot tub, dedicated workspace, EV charger) in your listing description and photos.
- Regularly check competitor amenities in South Bruce Peninsula to stay competitive.
South Bruce Peninsula Airbnb Guest Demographics & Profile Analysis (2025)
Guest Profile Summary for South Bruce Peninsula
- The typical guest profile for Airbnb in South Bruce Peninsula consists of primarily domestic travelers (87%), often arriving from nearby Toronto, typically belonging to the Post-2000s (Gen Z/Alpha) group (50%), primarily speaking English or French.
- Domestic travelers account for 86.7% of guests.
- Key international markets include Canada (86.7%) and United States (7.3%).
- Top languages spoken are English (58.5%) followed by French (11.2%).
- A significant demographic segment is the Post-2000s (Gen Z/Alpha) group, representing 50% of guests.
Recommendations for Hosts
- Target domestic marketing efforts towards travelers from Toronto and Mississauga.
- Tailor amenities and listing descriptions to appeal to the dominant Post-2000s (Gen Z/Alpha) demographic (e.g., highlight fast WiFi, smart home features, local guides).
- Highlight unique local experiences or amenities relevant to the primary guest profile.
- Consider seasonal promotions aligned with peak travel times for key origin markets.
Nearby Short-Term Rental Market Comparison
How does the South Bruce Peninsula Airbnb market stack up against its neighbors? Compare key performance metrics like average monthly revenue, ADR, and occupancy rates in surrounding areas to understand the broader regional STR landscape.
| Market | Active Properties | Monthly Revenue | Daily Rate | Avg. Occupancy |
|---|---|---|---|---|
| Forester | 11 | $5,685 | $390.48 | 43% |
| Port Sanilac | 30 | $3,765 | $470.85 | 34% |
| Lexington | 31 | $3,459 | $385.98 | 43% |
| Meaford | 129 | $2,843 | $246.44 | 45% |
| Mulmur | 43 | $2,837 | $283.33 | 42% |
| The Blue Mountains | 612 | $2,777 | $285.62 | 36% |
| Brockton | 10 | $2,605 | $196.96 | 48% |
| Sanilac Township | 24 | $2,588 | $281.06 | 45% |
| Grey Highlands | 161 | $2,519 | $276.21 | 41% |
| Saugeen Shores | 12 | $2,460 | $296.92 | 44% |