Sault Ste. Marie Airbnb Market Analysis 2025: Short Term Rental Data & Vacation Rental Statistics in Ontario, Canada
Is Airbnb profitable in Sault Ste. Marie in 2025? Explore comprehensive Airbnb analytics for Sault Ste. Marie, Ontario, Canada to uncover income potential. This 2025 STR market report for Sault Ste. Marie, based on AirROI data from April 2024 to March 2025, reveals key trends in the niche market of 77 active listings.
Whether you're considering an Airbnb investment in Sault Ste. Marie, optimizing your existing vacation rental, or exploring rental arbitrage opportunities, understanding the Sault Ste. Marie Airbnb data is crucial. Understanding the local regulations is key to maximizing your short term rental income potential. Let's dive into the specifics.
Key Sault Ste. Marie Airbnb Performance Metrics Overview
Monthly Airbnb Revenue Variations & Income Potential in Sault Ste. Marie (2025)
Understanding the monthly revenue variations for Airbnb listings in Sault Ste. Marie is key to maximizing your short term rental income potential. Seasonality significantly impacts earnings. Our analysis, based on data from the past 12 months, shows that the peak revenue month for STRs in Sault Ste. Marie is typically August, while March often presents the lowest earnings, highlighting opportunities for strategic pricing adjustments during shoulder and low seasons. Explore the typical Airbnb income in Sault Ste. Marie across different performance tiers:
- Best-in-class properties (Top 10%) achieve $4,116+ monthly, often utilizing dynamic pricing and superior guest experiences.
- Strong performing properties (Top 25%) earn $2,821 or more, indicating effective management and desirable locations/amenities.
- Typical properties (Median) generate around $1,906 per month, representing the average market performance.
- Entry-level properties (Bottom 25%) see earnings around $1,028, often with potential for optimization.
Average Monthly Airbnb Earnings Trend in Sault Ste. Marie
Sault Ste. Marie Airbnb Occupancy Rate Trends (2025)
Maximize your bookings by understanding the Sault Ste. Marie STR occupancy trends. Seasonal demand shifts significantly influence how often properties are booked. Typically, Augustsees the highest demand (peak season occupancy), while June experiences the lowest (low season). Effective strategies, like adjusting minimum stays or offering promotions, can boost occupancy during slower periods. Here's how different property tiers perform in Sault Ste. Marie:
- Best-in-class properties (Top 10%) achieve 90%+ occupancy, indicating high desirability and potentially optimized availability.
- Strong performing properties (Top 25%) maintain 79% or higher occupancy, suggesting good market fit and guest satisfaction.
- Typical properties (Median) have an occupancy rate around 60%.
- Entry-level properties (Bottom 25%) average 35% occupancy, potentially facing higher vacancy.
Average Monthly Occupancy Rate Trend in Sault Ste. Marie
Average Daily Rate (ADR) Airbnb Trends in Sault Ste. Marie (2025)
Effective short term rental pricing strategy in Sault Ste. Marie involves understanding monthly ADR fluctuations. The Average Daily Rate (ADR) for Airbnb in Sault Ste. Marie typically peaks in July and dips lowest during March. Leveraging Airbnb dynamic pricing tools or strategies based on this seasonality can significantly boost revenue. Here's a look at the typical nightly rates achieved:
- Best-in-class properties (Top 10%) command rates of $187+ per night, often due to premium features or locations.
- Strong performing properties (Top 25%) achieve nightly rates of $120 or more.
- Typical properties (Median) charge around $84 per night.
- Entry-level properties (Bottom 25%) earn around $60 per night.
Average Daily Rate (ADR) Trend by Month in Sault Ste. Marie
Get Live Sault Ste. Marie Market Intelligence 👇

Explore Real-time Analytics
Airbnb Seasonality Analysis & Trends in Sault Ste. Marie (2025)
Peak Season (August, July, September)
- Revenue averages $2,458 per month
- Occupancy rates average 66.8%
- Daily rates average $104
Shoulder Season
- Revenue averages $2,116 per month
- Occupancy maintains around 54.8%
- Daily rates hold near $103
Low Season (March, November, December)
- Revenue drops to average $1,721 per month
- Occupancy decreases to average 49.2%
- Daily rates adjust to average $103
Seasonality Insights for Sault Ste. Marie
- The Airbnb seasonality in Sault Ste. Marie shows moderate seasonality with distinct peak and low periods. While the sections above show seasonal averages, it's also insightful to look at the extremes:
- During the high season, the absolute peak month showcases Sault Ste. Marie's highest earning potential, with monthly revenues capable of climbing to $2,540, occupancy reaching a high of 69.2%, and ADRs peaking at $106.
- Conversely, the slowest single month of the year, typically falling within the low season, marks the market's lowest point. In this month, revenue might dip to $1,626, occupancy could drop to 47.6%, and ADRs may adjust down to $101.
- Understanding both the seasonal averages and these monthly peaks and troughs in revenue, occupancy, and ADR is crucial for maximizing your Airbnb profit potential in Sault Ste. Marie.
Seasonal Strategies for Maximizing Profit
- Peak Season: Maximize revenue through premium pricing and potentially longer minimum stays. Ensure high availability.
- Low Season: Offer competitive pricing, special promotions (e.g., extended stay discounts), and flexible cancellation policies. Target off-season travelers like remote workers or budget-conscious guests.
- Shoulder Seasons: Implement dynamic pricing that balances peak and low rates. Target weekend travelers or specific events. Offer slightly more flexible terms than peak season.
- Regularly analyze your own performance against these Sault Ste. Marie seasonality benchmarks and adjust your pricing and availability strategy accordingly.
Best Areas for Airbnb Investment in Sault Ste. Marie (2025)
Exploring the top neighborhoods for short-term rentals in Sault Ste. Marie? This section highlights key areas, outlining why they are attractive for hosts and guests, along with notable local attractions. Consider these locations based on your target guest profile and investment strategy.
| Neighborhood / Area | Why Host Here? (Target Guests & Appeal) | Key Attractions & Landmarks |
|---|---|---|
| Downtown Sault Ste. Marie | The heart of the city with a mix of historic sites, restaurants, and shops. It attracts both tourists and business travelers due to its central location and amenities. | Sault Ste. Marie Museum, Essar Centre, Canadian Bushplane Heritage Centre, Roberta Bondar Park, Great Lakes Shipwreck Museum |
| Sault Ste. Marie Waterfront | A scenic area along the waterfront that offers stunning views of the St. Marys River. Popular with visitors for leisure activities and waterfront events. | Waterfront Park, Lock View Park, Sault Ste. Marie Canal National Historic Site, St. Marys River, Marina |
| Algoma District | A natural paradise attracting outdoor enthusiasts and those looking for adventure in nature. Great for eco-tourism with abundant wildlife and scenic spots. | Batchawana Bay Provincial Park, Lake Superior Provincial Park, Searchmont Resort, Hiawatha Highlands, Garden River |
| Lake Superior Shoreline | Offers breathtaking views and unique access to seasonal activities like fishing and snowmobiling. Attracts travelers seeking outdoor adventures. | Pigeon River Provincial Park, Agawa Canyon, Pic River, Lake Superior Provincial Park, Wawa |
| Sault Ste. Marie International Bridge | An important border crossing with easy access to Michigan. Ideal for guests traveling between Canada and the U.S. | International Bridge, St. Marys River, Voyageurs' National Park (nearby), Parks and Recreation areas |
| Fairview Mall | A hub for shopping and dining, drawing visitors for a day out. It has various shops and restaurants, ideal for Airbnb hosts targeting shoppers. | Fairview Mall, Cineplex theatres, Restaurants, Nearby parks |
| Group of Seven Discovery Centre | Celebrates the famous Canadian painters known as the Group of Seven. Attractive to art lovers and educational tourists. | Art exhibits, Workshops, Exploration of the local landscape, Cultural events |
| Sault Ste. Marie Historic Sites | Contains historic landmarks and sites that tell the story of the area. Suitable for history buffs and educational tourism. | Ermatinger Clergue National Historic Site, Old Stone House, Historic Pulp Mill, Various heritage buildings |
Understanding Airbnb License Requirements & STR Laws in Sault Ste. Marie (2025)
With 17% of listings showing registration in 2025, understanding potential Airbnb license requirements is crucial in Sault Ste. Marie. Always verify the latest short term rental regulations and Airbnb license requirements directly with local government authorities for Sault Ste. Marie to ensure full compliance before hosting.
(Source: AirROI data, 2025, based on 17% licensed listings)
Top Performing Airbnb Properties in Sault Ste. Marie (2025)
Benchmark your potential! Explore examples of top-performing Airbnb properties in Sault Ste. Mariebased on Trailing Twelve Month (TTM) revenue. Analyze their characteristics, revenue, occupancy rate, and ADR to understand what drives success in this market.
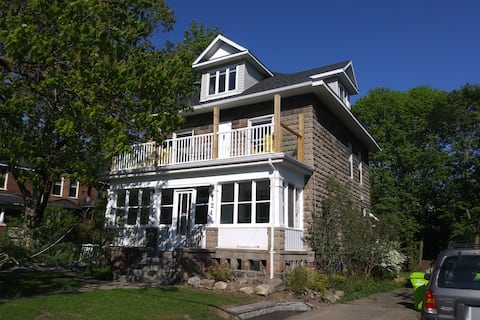
Downtown Century Home
Entire Place • 5 bedrooms
Entire 4BR/2BA House with Deck and 2 Kitchens
Entire Place • 4 bedrooms

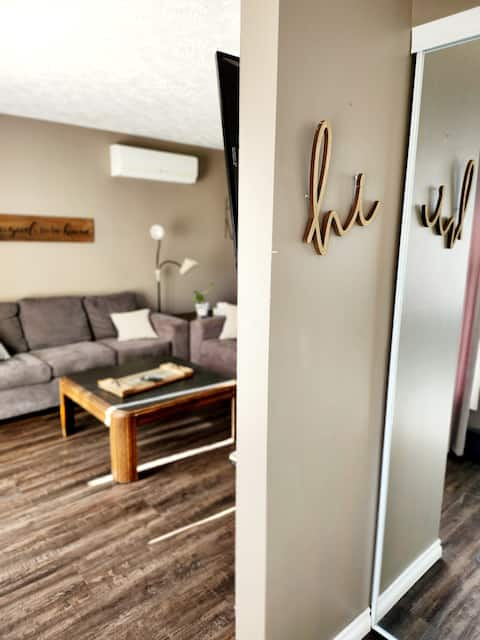
Luxury home w/ hot tub, PS5, EV, 75in 4k TV, & BBQ
Entire Place • 3 bedrooms

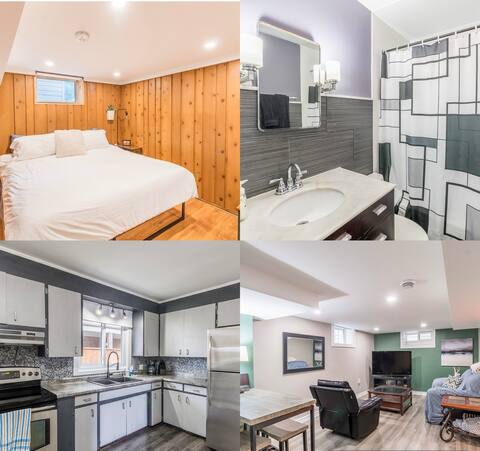
Bright & Airy Lower Level of Walk-Out Bungalow
Entire Place • 3 bedrooms
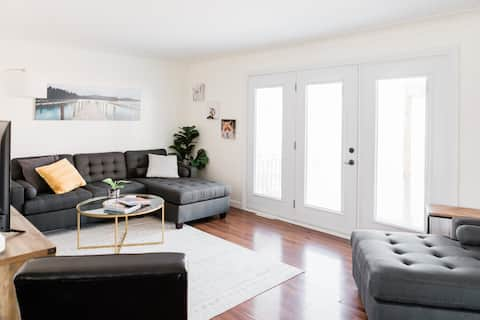
Tasteful 3 bedroom home with private yard and deck
Entire Place • 3 bedrooms
Spacious 4-BR Home with Pool Table & Jacuzzi Tub
Entire Place • 4 bedrooms
Note: Performance varies based on location, size, amenities, seasonality, and management quality. Data reflects the past 12 months.
Top Performing Airbnb Hosts in Sault Ste. Marie (2025)
Learn from the best! This table showcases top-performing Airbnb hosts in Sault Ste. Marie based on the number of properties managed and estimated total revenue over the past year. Analyze their scale and performance metrics.
| Host Name | Properties | Grossing Revenue | Stay Reviews | Avg Rating |
|---|---|---|---|---|
| Joe | 3 | $100,955 | 1510 | 4.80/5.0 |
| Gil | 3 | $89,611 | 666 | 4.84/5.0 |
| Sara | 3 | $76,723 | 122 | 4.78/5.0 |
| Glenn & Sonja | 1 | $60,704 | 102 | 4.94/5.0 |
| Ryan | 1 | $54,260 | 66 | 5.00/5.0 |
| Sarah | 2 | $53,553 | 122 | 4.86/5.0 |
| Marc | 4 | $45,340 | 81 | 4.62/5.0 |
| Melissa And Dunbar | 2 | $44,798 | 753 | 4.79/5.0 |
| Tom | 1 | $43,247 | 140 | 4.99/5.0 |
| Althea | 2 | $43,130 | 52 | 4.69/5.0 |
Analyzing the strategies of top hosts, such as their property selection, pricing, and guest communication, can offer valuable lessons for optimizing your own Airbnb operations in Sault Ste. Marie.
Dive Deeper: Advanced Sault Ste. Marie STR Market Data (2025)
Ready to unlock more insights? AirROI provides access to advanced metrics and comprehensive Airbnb data for Sault Ste. Marie. Explore detailed analytics beyond this report to refine your investment strategy, optimize pricing, and maximize your vacation rental profits.
Explore Advanced MetricsSault Ste. Marie Short-Term Rental Market Composition (2025): Property & Room Types
Room Type Distribution
Property Type Distribution
Market Composition Insights for Sault Ste. Marie
- The Sault Ste. Marie Airbnb market composition is heavily skewed towards Entire Home/Apt listings, which make up 80.5% of the 77 active rentals. This indicates strong guest preference for privacy and space.
- Looking at the property type distribution in Sault Ste. Marie, House properties are the most common (59.7%), reflecting the local real estate landscape.
- Houses represent a significant 59.7% portion, catering likely to families or larger groups.
- Smaller segments like hotel/boutique (combined 1.3%) offer potential for unique stay experiences.
Sault Ste. Marie Airbnb Room Capacity Analysis (2025): Bedroom Distribution
Distribution of Listings by Number of Bedrooms
Room Capacity Insights for Sault Ste. Marie
- The dominant room capacity in Sault Ste. Marie is 1 bedroom listings, making up 35.1% of the market. This suggests a strong demand for properties suitable for couples or solo travelers.
- Together, 1 bedroom and 3 bedrooms properties represent 58.5% of the active Airbnb listings in Sault Ste. Marie, indicating a high concentration in these sizes.
- A significant 29.9% of listings offer 3+ bedrooms, catering to larger groups and families seeking more space in Sault Ste. Marie.
Sault Ste. Marie Vacation Rental Guest Capacity Trends (2025)
Distribution of Listings by Guest Capacity
Guest Capacity Insights for Sault Ste. Marie
- The most common guest capacity trend in Sault Ste. Marie vacation rentals is listings accommodating 4 guests (23.4%). This suggests the primary traveler segment is likely small families or groups.
- Properties designed for 4 guests and 2 guests dominate the Sault Ste. Marie STR market, accounting for 42.9% of listings.
- 24.7% of properties accommodate 6+ guests, serving the market segment for larger families or group travel in Sault Ste. Marie.
- On average, properties in Sault Ste. Marie are equipped to host 3.6 guests.
Sault Ste. Marie Airbnb Booking Patterns (2025): Available vs. Booked Days
Available Days Distribution
Booked Days Distribution
Booking Pattern Insights for Sault Ste. Marie
- The most common availability pattern in Sault Ste. Marie falls within the 271-366 days range, representing 26% of listings. This suggests many properties have significant open periods on their calendars.
- Approximately 52.0% of listings show high availability (181+ days open annually), indicating potential for increased bookings or specific owner usage patterns.
- For booked days, the 91-180 days range is most frequent in Sault Ste. Marie (27.3%), reflecting common guest stay durations or potential owner blocking patterns.
- A notable 49.4% of properties secure long booking periods (181+ days booked per year), highlighting successful long-term rental strategies or significant owner usage.
Sault Ste. Marie Airbnb Minimum Stay Requirements Analysis
Distribution of Listings by Minimum Night Requirement
1 Night
20 listings
27.8% of total
2 Nights
22 listings
30.6% of total
3 Nights
13 listings
18.1% of total
4-6 Nights
3 listings
4.2% of total
7-29 Nights
8 listings
11.1% of total
30+ Nights
6 listings
8.3% of total
Key Insights
- The most prevalent minimum stay requirement in Sault Ste. Marie is 2 Nights, adopted by 30.6% of listings. This highlights the market's preference for shorter, flexible bookings.
Recommendations
- Align with the market by considering a 2 Nights minimum stay, as 30.6% of Sault Ste. Marie hosts use this setting.
- If feasible, allowing 1-night stays, especially midweek or during low season, could capture last-minute bookings, as only 27.8% currently do.
- Explore offering discounts for stays of 30+ nights to attract the 8.3% of the market seeking extended stays.
- Adjust minimum nights based on seasonality – potentially shorter during low season and longer during peak demand periods in Sault Ste. Marie.
Sault Ste. Marie Airbnb Cancellation Policy Trends Analysis (2025)
Flexible
18 listings
26.1% of total
Moderate
28 listings
40.6% of total
Firm
10 listings
14.5% of total
Strict
13 listings
18.8% of total
Cancellation Policy Insights for Sault Ste. Marie
- The prevailing Airbnb cancellation policy trend in Sault Ste. Marie is Moderate, used by 40.6% of listings.
- There's a relatively balanced mix between guest-friendly (66.7%) and stricter (33.3%) policies, offering choices for different guest needs.
Recommendations for Hosts
- Consider adopting a Moderate policy to align with the 40.6% market standard in Sault Ste. Marie.
- Regularly review your cancellation policy against competitors and market demand shifts in Sault Ste. Marie.
Sault Ste. Marie STR Booking Lead Time Analysis (2025)
Average Booking Lead Time by Month
Booking Lead Time Insights for Sault Ste. Marie
- The overall average booking lead time for vacation rentals in Sault Ste. Marie is 41 days.
- Guests book furthest in advance for stays during July (average 73 days), likely coinciding with peak travel demand or local events.
- The shortest booking windows occur for stays in May (average 34 days), indicating more last-minute travel plans during this time.
- Seasonally, Summer (65 days avg.) sees the longest lead times, while Spring (35 days avg.) has the shortest, reflecting typical travel planning cycles.
Recommendations for Hosts
- Use the overall average lead time (41 days) as a baseline for your pricing and availability strategy in Sault Ste. Marie.
- For July stays, consider implementing length-of-stay discounts or slightly higher rates for bookings made less than 73 days out to capitalize on advance planning.
- Target marketing efforts for the Summer season well in advance (at least 65 days) to capture early planners.
- Monitor your own booking lead times against these Sault Ste. Marie averages to identify opportunities for dynamic pricing adjustments.
Popular & Essential Airbnb Amenities in Sault Ste. Marie (2025)
Amenity Prevalence
Amenity Insights for Sault Ste. Marie
- Essential amenities in Sault Ste. Marie that guests expect include: TV, Smoke alarm, Wifi, Free parking on premises, Heating. Lacking these (any) could significantly impact bookings.
- Popular amenities like Carbon monoxide alarm, Kitchen, Hot water are common but not universal. Offering these can provide a competitive edge.
Recommendations for Hosts
- Ensure your listing includes all essential amenities for Sault Ste. Marie: TV, Smoke alarm, Wifi, Free parking on premises, Heating.
- Prioritize adding missing essentials: Free parking on premises, Heating.
- Consider adding popular differentiators like Carbon monoxide alarm or Kitchen to increase appeal.
- Highlight unique or less common amenities you offer (e.g., hot tub, dedicated workspace, EV charger) in your listing description and photos.
- Regularly check competitor amenities in Sault Ste. Marie to stay competitive.
Sault Ste. Marie Airbnb Guest Demographics & Profile Analysis (2025)
Guest Profile Summary for Sault Ste. Marie
- The typical guest profile for Airbnb in Sault Ste. Marie consists of primarily domestic travelers (70%), often arriving from nearby Toronto, typically belonging to the Post-2000s (Gen Z/Alpha) group (50%), primarily speaking English or French.
- Domestic travelers account for 69.7% of guests.
- Key international markets include Canada (69.7%) and United States (27.1%).
- Top languages spoken are English (67.6%) followed by French (10.7%).
- A significant demographic segment is the Post-2000s (Gen Z/Alpha) group, representing 50% of guests.
Recommendations for Hosts
- Target domestic marketing efforts towards travelers from Toronto and Greater Sudbury.
- Tailor amenities and listing descriptions to appeal to the dominant Post-2000s (Gen Z/Alpha) demographic (e.g., highlight fast WiFi, smart home features, local guides).
- Highlight unique local experiences or amenities relevant to the primary guest profile.
- Consider seasonal promotions aligned with peak travel times for key origin markets.
Nearby Short-Term Rental Market Comparison
How does the Sault Ste. Marie Airbnb market stack up against its neighbors? Compare key performance metrics like average monthly revenue, ADR, and occupancy rates in surrounding areas to understand the broader regional STR landscape.
| Market | Active Properties | Monthly Revenue | Daily Rate | Avg. Occupancy |
|---|---|---|---|---|
| Friendship Township | 14 | $5,118 | $376.04 | 59% |
| Bay Township | 10 | $4,782 | $550.14 | 44% |
| Livingston Township | 11 | $4,649 | $293.80 | 53% |
| Leelanau Township | 50 | $4,620 | $377.36 | 50% |
| Leland Township | 40 | $4,579 | $568.06 | 37% |
| Walloon Lake | 25 | $4,534 | $401.80 | 44% |
| Beaugrand Township | 16 | $4,296 | $321.54 | 60% |
| Maple River Township | 10 | $4,137 | $332.91 | 45% |
| Charlevoix Township | 29 | $4,067 | $441.77 | 45% |
| West Traverse Township | 36 | $3,878 | $434.63 | 45% |