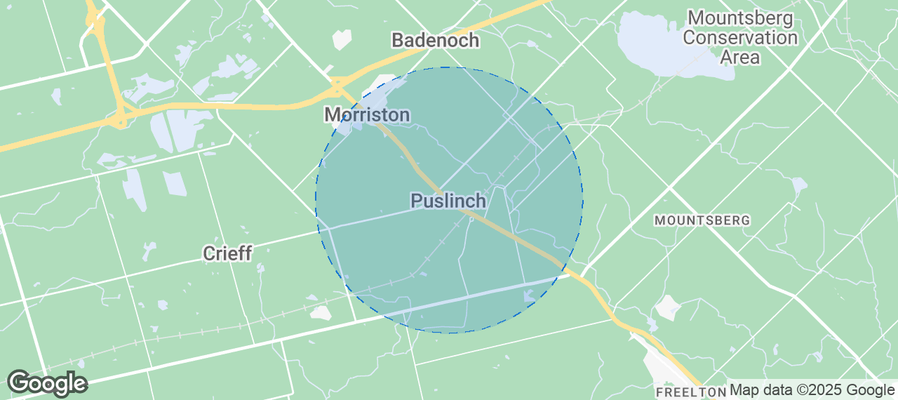
Puslinch Airbnb Market Analysis 2025: Short Term Rental Data & Vacation Rental Statistics in Ontario, Canada
Is Airbnb profitable in Puslinch in 2025? Explore comprehensive Airbnb analytics for Puslinch, Ontario, Canada to uncover income potential. This 2025 STR market report for Puslinch, based on AirROI data from April 2024 to March 2025, reveals key trends in the niche market of 19 active listings.
Whether you're considering an Airbnb investment in Puslinch, optimizing your existing vacation rental, or exploring rental arbitrage opportunities, understanding the Puslinch Airbnb data is crucial. Leveraging the low regulation environment is key to maximizing your short term rental income potential. Let's dive into the specifics.
Key Puslinch Airbnb Performance Metrics Overview
Monthly Airbnb Revenue Variations & Income Potential in Puslinch (2025)
Understanding the monthly revenue variations for Airbnb listings in Puslinch is key to maximizing your short term rental income potential. Seasonality significantly impacts earnings. Our analysis, based on data from the past 12 months, shows that the peak revenue month for STRs in Puslinch is typically May, while November often presents the lowest earnings, highlighting opportunities for strategic pricing adjustments during shoulder and low seasons. Explore the typical Airbnb income in Puslinch across different performance tiers:
- Best-in-class properties (Top 10%) achieve $4,593+ monthly, often utilizing dynamic pricing and superior guest experiences.
- Strong performing properties (Top 25%) earn $3,220 or more, indicating effective management and desirable locations/amenities.
- Typical properties (Median) generate around $1,737 per month, representing the average market performance.
- Entry-level properties (Bottom 25%) see earnings around $1,157, often with potential for optimization.
Average Monthly Airbnb Earnings Trend in Puslinch
Puslinch Airbnb Occupancy Rate Trends (2025)
Maximize your bookings by understanding the Puslinch STR occupancy trends. Seasonal demand shifts significantly influence how often properties are booked. Typically, Augustsees the highest demand (peak season occupancy), while November experiences the lowest (low season). Effective strategies, like adjusting minimum stays or offering promotions, can boost occupancy during slower periods. Here's how different property tiers perform in Puslinch:
- Best-in-class properties (Top 10%) achieve 80%+ occupancy, indicating high desirability and potentially optimized availability.
- Strong performing properties (Top 25%) maintain 63% or higher occupancy, suggesting good market fit and guest satisfaction.
- Typical properties (Median) have an occupancy rate around 39%.
- Entry-level properties (Bottom 25%) average 19% occupancy, potentially facing higher vacancy.
Average Monthly Occupancy Rate Trend in Puslinch
Average Daily Rate (ADR) Airbnb Trends in Puslinch (2025)
Effective short term rental pricing strategy in Puslinch involves understanding monthly ADR fluctuations. The Average Daily Rate (ADR) for Airbnb in Puslinch typically peaks in June and dips lowest during February. Leveraging Airbnb dynamic pricing tools or strategies based on this seasonality can significantly boost revenue. Here's a look at the typical nightly rates achieved:
- Best-in-class properties (Top 10%) command rates of $410+ per night, often due to premium features or locations.
- Strong performing properties (Top 25%) achieve nightly rates of $257 or more.
- Typical properties (Median) charge around $163 per night.
- Entry-level properties (Bottom 25%) earn around $90 per night.
Average Daily Rate (ADR) Trend by Month in Puslinch
Get Live Puslinch Market Intelligence 👇
Explore Real-time Analytics
Airbnb Seasonality Analysis & Trends in Puslinch (2025)
Peak Season (May, August, July)
- Revenue averages $3,548 per month
- Occupancy rates average 50.0%
- Daily rates average $207
Shoulder Season
- Revenue averages $2,214 per month
- Occupancy maintains around 40.8%
- Daily rates hold near $200
Low Season (January, March, November)
- Revenue drops to average $1,667 per month
- Occupancy decreases to average 39.4%
- Daily rates adjust to average $188
Seasonality Insights for Puslinch
- The Airbnb seasonality in Puslinch shows highly seasonal trends requiring careful strategy. While the sections above show seasonal averages, it's also insightful to look at the extremes:
- During the high season, the absolute peak month showcases Puslinch's highest earning potential, with monthly revenues capable of climbing to $3,923, occupancy reaching a high of 58.6%, and ADRs peaking at $215.
- Conversely, the slowest single month of the year, typically falling within the low season, marks the market's lowest point. In this month, revenue might dip to $1,604, occupancy could drop to 30.3%, and ADRs may adjust down to $178.
- Understanding both the seasonal averages and these monthly peaks and troughs in revenue, occupancy, and ADR is crucial for maximizing your Airbnb profit potential in Puslinch.
Seasonal Strategies for Maximizing Profit
- Peak Season: Maximize revenue through premium pricing and potentially longer minimum stays. Ensure high availability.
- Low Season: Offer competitive pricing, special promotions (e.g., extended stay discounts), and flexible cancellation policies. Target off-season travelers like remote workers or budget-conscious guests.
- Shoulder Seasons: Implement dynamic pricing that balances peak and low rates. Target weekend travelers or specific events. Offer slightly more flexible terms than peak season.
- Regularly analyze your own performance against these Puslinch seasonality benchmarks and adjust your pricing and availability strategy accordingly.
Best Areas for Airbnb Investment in Puslinch (2025)
Exploring the top neighborhoods for short-term rentals in Puslinch? This section highlights key areas, outlining why they are attractive for hosts and guests, along with notable local attractions. Consider these locations based on your target guest profile and investment strategy.
| Neighborhood / Area | Why Host Here? (Target Guests & Appeal) | Key Attractions & Landmarks |
|---|---|---|
| Puslinch Lake | A serene, picturesque location perfect for vacations and getaways, attracting families and nature lovers. | Puslinch Lake, Puslinch Marsh, Hiking trails, Fishing spots |
| Victoria Park | A beautiful park area ideal for outdoor activities and close to amenities, attracting tourists and locals alike. | Victoria Park, Walking trails, Picnic areas, Local wildlife |
| Guelph | A nearby city offering a vibrant cultural scene and university town atmosphere, appealing to students and travelers. | University of Guelph, Downtown Guelph, Heritage buildings, Guelph Farmer's Market |
| Cambridge | A historic city nearby with charming neighborhoods and cultural attractions, perfect for attracting diverse guests. | Doon Heritage Village, Cambridge Butterfly Conservatory, Historic sites, Waterloo Region Museum |
| Kitchener-Waterloo | A tech hub with a growing population, appealing to business travelers and young professionals. | Tech companies, Cultural events, Local breweries, Public parks |
| Rural Puslinch | Offering quiet, spacious accommodations in a rural setting, ideal for those seeking tranquility and nature. | Open fields, Farmland, Nature walks, Secluded retreats |
| Golf Courses | Homes near popular golf courses, attracting golf enthusiasts and visitors looking for leisure and recreation. | Puslinch Lake Golf Course, Golfing events, Clubhouse amenities, Beautiful landscapes |
| Local Wineries | Puslinch is part of Ontario's wine country, attracting wine lovers looking for vineyard experiences and tastings. | Local wineries, Wine tours, Tasting events, Rural beauty |
Understanding Airbnb License Requirements & STR Laws in Puslinch (2025)
While Puslinch, Ontario, Canada currently shows low STR regulations, specific Airbnb license requirements might still exist or change. Always verify the latest short term rental regulations and Airbnb license requirements directly with local government authorities for Puslinch to ensure full compliance before hosting.
(Source: AirROI data, 2025, finding no licensed listings among those analyzed)
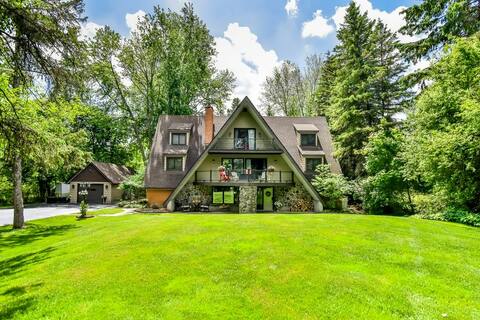
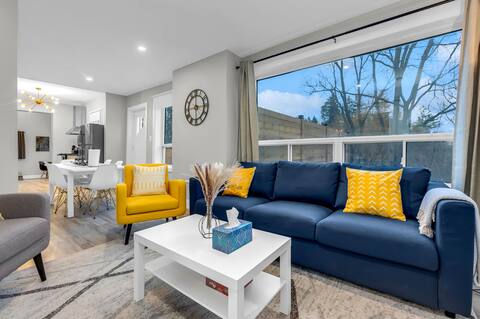
Top Performing Airbnb Properties in Puslinch (2025)
Benchmark your potential! Explore examples of top-performing Airbnb properties in Puslinchbased on Trailing Twelve Month (TTM) revenue. Analyze their characteristics, revenue, occupancy rate, and ADR to understand what drives success in this market.

Forest Hideaway
Entire Place • 3 bedrooms

Luxury Farm w/ pool & hot tub. Weekend Getaway
Entire Place • 3 bedrooms
Little Lake Chalet! A-Frame Fish, Golf, Hike, Bike
Entire Place • 3 bedrooms
Guelph - Hot Tub - Cozy 3 Bed 1 Bath Loft House
Entire Place • 3 bedrooms

Wildwood Tiny Home ‘NEW’ Wood fired barrel sauna!
Entire Place • 1 bedroom

Alpacas & Luxury Glamping for 2 at Brae Ridge Farm
Entire Place • N/A
Note: Performance varies based on location, size, amenities, seasonality, and management quality. Data reflects the past 12 months.
Top Performing Airbnb Hosts in Puslinch (2025)
Learn from the best! This table showcases top-performing Airbnb hosts in Puslinch based on the number of properties managed and estimated total revenue over the past year. Analyze their scale and performance metrics.
| Host Name | Properties | Grossing Revenue | Stay Reviews | Avg Rating |
|---|---|---|---|---|
| Eli Farms | 3 | $73,503 | 110 | 4.71/5.0 |
| Rav | 1 | $60,748 | 124 | 4.95/5.0 |
| Lynn | 1 | $44,579 | 45 | 4.98/5.0 |
| Punit | 2 | $35,422 | 94 | 2.44/5.0 |
| Mike | 1 | $33,598 | 60 | 4.98/5.0 |
| Penny | 1 | $26,067 | 86 | 4.99/5.0 |
| Tanya | 1 | $23,614 | 8 | 4.88/5.0 |
| Tasha | 1 | $21,627 | 8 | 4.88/5.0 |
| Daniel | 1 | $19,221 | 49 | 4.94/5.0 |
| Esteban | 1 | $16,057 | 26 | 4.58/5.0 |
Analyzing the strategies of top hosts, such as their property selection, pricing, and guest communication, can offer valuable lessons for optimizing your own Airbnb operations in Puslinch.
Dive Deeper: Advanced Puslinch STR Market Data (2025)
Ready to unlock more insights? AirROI provides access to advanced metrics and comprehensive Airbnb data for Puslinch. Explore detailed analytics beyond this report to refine your investment strategy, optimize pricing, and maximize your vacation rental profits.
Explore Advanced MetricsPuslinch Short-Term Rental Market Composition (2025): Property & Room Types
Room Type Distribution
Property Type Distribution
Market Composition Insights for Puslinch
- The Puslinch Airbnb market composition is heavily skewed towards Entire Home/Apt listings, which make up 94.7% of the 19 active rentals. This indicates strong guest preference for privacy and space.
- Looking at the property type distribution in Puslinch, House properties are the most common (52.6%), reflecting the local real estate landscape.
- Houses represent a significant 52.6% portion, catering likely to families or larger groups.
- The presence of 5.3% Hotel/Boutique listings indicates integration with traditional hospitality.
Puslinch Airbnb Room Capacity Analysis (2025): Bedroom Distribution
Distribution of Listings by Number of Bedrooms
Room Capacity Insights for Puslinch
- The dominant room capacity in Puslinch is 3 bedrooms listings, making up 42.1% of the market. This suggests a strong demand for properties suitable for families or small groups.
- Together, 3 bedrooms and 2 bedrooms properties represent 63.2% of the active Airbnb listings in Puslinch, indicating a high concentration in these sizes.
- A significant 47.4% of listings offer 3+ bedrooms, catering to larger groups and families seeking more space in Puslinch.
Puslinch Vacation Rental Guest Capacity Trends (2025)
Distribution of Listings by Guest Capacity
Guest Capacity Insights for Puslinch
- The most common guest capacity trend in Puslinch vacation rentals is listings accommodating 2 guests (21.1%). This suggests the primary traveler segment is likely couples or solo travelers.
- Properties designed for 2 guests and 6 guests dominate the Puslinch STR market, accounting for 42.2% of listings.
- 42.2% of properties accommodate 6+ guests, serving the market segment for larger families or group travel in Puslinch.
- On average, properties in Puslinch are equipped to host 4.7 guests.
Puslinch Airbnb Booking Patterns (2025): Available vs. Booked Days
Available Days Distribution
Booked Days Distribution
Booking Pattern Insights for Puslinch
- The most common availability pattern in Puslinch falls within the 271-366 days range, representing 42.1% of listings. This suggests many properties have significant open periods on their calendars.
- Approximately 63.2% of listings show high availability (181+ days open annually), indicating potential for increased bookings or specific owner usage patterns.
- For booked days, the 181-270 days range is most frequent in Puslinch (31.6%), reflecting common guest stay durations or potential owner blocking patterns.
- A notable 42.1% of properties secure long booking periods (181+ days booked per year), highlighting successful long-term rental strategies or significant owner usage.
Puslinch Airbnb Minimum Stay Requirements Analysis
Distribution of Listings by Minimum Night Requirement
1 Night
8 listings
42.1% of total
2 Nights
2 listings
10.5% of total
3 Nights
3 listings
15.8% of total
4-6 Nights
1 listings
5.3% of total
7-29 Nights
3 listings
15.8% of total
30+ Nights
2 listings
10.5% of total
Key Insights
- The most prevalent minimum stay requirement in Puslinch is 1 Night, adopted by 42.1% of listings. This highlights the market's preference for shorter, flexible bookings.
- A significant segment (10.5%) caters to monthly stays (30+ nights) in Puslinch, pointing to opportunities in the extended-stay market.
Recommendations
- Align with the market by considering a 1 Night minimum stay, as 42.1% of Puslinch hosts use this setting.
- Explore offering discounts for stays of 30+ nights to attract the 10.5% of the market seeking extended stays.
- Adjust minimum nights based on seasonality – potentially shorter during low season and longer during peak demand periods in Puslinch.
Puslinch Airbnb Cancellation Policy Trends Analysis (2025)
Flexible
5 listings
29.4% of total
Moderate
4 listings
23.5% of total
Firm
5 listings
29.4% of total
Strict
3 listings
17.6% of total
Cancellation Policy Insights for Puslinch
- The prevailing Airbnb cancellation policy trend in Puslinch is Flexible, used by 29.4% of listings.
- There's a relatively balanced mix between guest-friendly (52.9%) and stricter (47.0%) policies, offering choices for different guest needs.
Recommendations for Hosts
- Consider adopting a Flexible policy to align with the 29.4% market standard in Puslinch.
- Regularly review your cancellation policy against competitors and market demand shifts in Puslinch.
Puslinch STR Booking Lead Time Analysis (2025)
Average Booking Lead Time by Month
Booking Lead Time Insights for Puslinch
- The overall average booking lead time for vacation rentals in Puslinch is 48 days.
- Guests book furthest in advance for stays during July (average 85 days), likely coinciding with peak travel demand or local events.
- The shortest booking windows occur for stays in March (average 22 days), indicating more last-minute travel plans during this time.
- Seasonally, Summer (64 days avg.) sees the longest lead times, while Winter (32 days avg.) has the shortest, reflecting typical travel planning cycles.
Recommendations for Hosts
- Use the overall average lead time (48 days) as a baseline for your pricing and availability strategy in Puslinch.
- For July stays, consider implementing length-of-stay discounts or slightly higher rates for bookings made less than 85 days out to capitalize on advance planning.
- Target marketing efforts for the Summer season well in advance (at least 64 days) to capture early planners.
- Monitor your own booking lead times against these Puslinch averages to identify opportunities for dynamic pricing adjustments.
Popular & Essential Airbnb Amenities in Puslinch (2025)
Amenity Prevalence
Amenity Insights for Puslinch
- Essential amenities in Puslinch that guests expect include: Free parking on premises, Smoke alarm, Carbon monoxide alarm. Lacking these (any) could significantly impact bookings.
- Popular amenities like Wifi, Fire extinguisher, Dishes and silverware are common but not universal. Offering these can provide a competitive edge.
- Warning: Wifi is not universally provided but is considered essential globally. Ensure reliable Wifi is offered.
Recommendations for Hosts
- Ensure your listing includes all essential amenities for Puslinch: Free parking on premises, Smoke alarm, Carbon monoxide alarm.
- Consider adding popular differentiators like Wifi or Fire extinguisher to increase appeal.
- Highlight unique or less common amenities you offer (e.g., hot tub, dedicated workspace, EV charger) in your listing description and photos.
- Regularly check competitor amenities in Puslinch to stay competitive.
Puslinch Airbnb Guest Demographics & Profile Analysis (2025)
Guest Profile Summary for Puslinch
- The typical guest profile for Airbnb in Puslinch consists of primarily domestic travelers (83%), often arriving from nearby Toronto, typically belonging to the Post-2000s (Gen Z/Alpha) group (50%), primarily speaking English or French.
- Domestic travelers account for 83.4% of guests.
- Key international markets include Canada (83.4%) and United States (10.8%).
- Top languages spoken are English (59.2%) followed by French (14.8%).
- A significant demographic segment is the Post-2000s (Gen Z/Alpha) group, representing 50% of guests.
Recommendations for Hosts
- Target domestic marketing efforts towards travelers from Toronto and Guelph.
- Tailor amenities and listing descriptions to appeal to the dominant Post-2000s (Gen Z/Alpha) demographic (e.g., highlight fast WiFi, smart home features, local guides).
- Highlight unique local experiences or amenities relevant to the primary guest profile.
- Consider seasonal promotions aligned with peak travel times for key origin markets.
Nearby Short-Term Rental Market Comparison
How does the Puslinch Airbnb market stack up against its neighbors? Compare key performance metrics like average monthly revenue, ADR, and occupancy rates in surrounding areas to understand the broader regional STR landscape.
| Market | Active Properties | Monthly Revenue | Daily Rate | Avg. Occupancy |
|---|---|---|---|---|
| North East Township | 34 | $3,530 | $264.33 | 48% |
| Niagara-on-the-Lake | 413 | $3,358 | $265.20 | 44% |
| Town of Stockton | 16 | $3,172 | $232.49 | 46% |
| Town of Brant | 10 | $2,928 | $274.43 | 43% |
| Severn | 154 | $2,845 | $306.35 | 39% |
| Meaford | 129 | $2,843 | $246.44 | 45% |
| Town of French Creek | 46 | $2,842 | $286.58 | 33% |
| King | 29 | $2,840 | $269.07 | 33% |
| Mulmur | 43 | $2,837 | $283.33 | 42% |
| Gravenhurst | 220 | $2,834 | $308.96 | 41% |