Port Hope Airbnb Market Analysis 2025: Short Term Rental Data & Vacation Rental Statistics in Ontario, Canada
Is Airbnb profitable in Port Hope in 2025? Explore comprehensive Airbnb analytics for Port Hope, Ontario, Canada to uncover income potential. This 2025 STR market report for Port Hope, based on AirROI data from April 2024 to March 2025, reveals key trends in the niche market of 40 active listings.
Whether you're considering an Airbnb investment in Port Hope, optimizing your existing vacation rental, or exploring rental arbitrage opportunities, understanding the Port Hope Airbnb data is crucial. Leveraging the low regulation environment is key to maximizing your short term rental income potential. Let's dive into the specifics.
Key Port Hope Airbnb Performance Metrics Overview
Monthly Airbnb Revenue Variations & Income Potential in Port Hope (2025)
Understanding the monthly revenue variations for Airbnb listings in Port Hope is key to maximizing your short term rental income potential. Seasonality significantly impacts earnings. Our analysis, based on data from the past 12 months, shows that the peak revenue month for STRs in Port Hope is typically August, while February often presents the lowest earnings, highlighting opportunities for strategic pricing adjustments during shoulder and low seasons. Explore the typical Airbnb income in Port Hope across different performance tiers:
- Best-in-class properties (Top 10%) achieve $4,345+ monthly, often utilizing dynamic pricing and superior guest experiences.
- Strong performing properties (Top 25%) earn $2,897 or more, indicating effective management and desirable locations/amenities.
- Typical properties (Median) generate around $1,650 per month, representing the average market performance.
- Entry-level properties (Bottom 25%) see earnings around $901, often with potential for optimization.
Average Monthly Airbnb Earnings Trend in Port Hope
Port Hope Airbnb Occupancy Rate Trends (2025)
Maximize your bookings by understanding the Port Hope STR occupancy trends. Seasonal demand shifts significantly influence how often properties are booked. Typically, Augustsees the highest demand (peak season occupancy), while February experiences the lowest (low season). Effective strategies, like adjusting minimum stays or offering promotions, can boost occupancy during slower periods. Here's how different property tiers perform in Port Hope:
- Best-in-class properties (Top 10%) achieve 70%+ occupancy, indicating high desirability and potentially optimized availability.
- Strong performing properties (Top 25%) maintain 54% or higher occupancy, suggesting good market fit and guest satisfaction.
- Typical properties (Median) have an occupancy rate around 34%.
- Entry-level properties (Bottom 25%) average 17% occupancy, potentially facing higher vacancy.
Average Monthly Occupancy Rate Trend in Port Hope
Average Daily Rate (ADR) Airbnb Trends in Port Hope (2025)
Effective short term rental pricing strategy in Port Hope involves understanding monthly ADR fluctuations. The Average Daily Rate (ADR) for Airbnb in Port Hope typically peaks in August and dips lowest during April. Leveraging Airbnb dynamic pricing tools or strategies based on this seasonality can significantly boost revenue. Here's a look at the typical nightly rates achieved:
- Best-in-class properties (Top 10%) command rates of $266+ per night, often due to premium features or locations.
- Strong performing properties (Top 25%) achieve nightly rates of $213 or more.
- Typical properties (Median) charge around $174 per night.
- Entry-level properties (Bottom 25%) earn around $100 per night.
Average Daily Rate (ADR) Trend by Month in Port Hope
Get Live Port Hope Market Intelligence 👇

Explore Real-time Analytics
Airbnb Seasonality Analysis & Trends in Port Hope (2025)
Peak Season (August, July, May)
- Revenue averages $2,818 per month
- Occupancy rates average 44.9%
- Daily rates average $170
Shoulder Season
- Revenue averages $2,108 per month
- Occupancy maintains around 39.1%
- Daily rates hold near $168
Low Season (January, February, March)
- Revenue drops to average $1,315 per month
- Occupancy decreases to average 28.5%
- Daily rates adjust to average $169
Seasonality Insights for Port Hope
- The Airbnb seasonality in Port Hope shows highly seasonal trends requiring careful strategy. While the sections above show seasonal averages, it's also insightful to look at the extremes:
- During the high season, the absolute peak month showcases Port Hope's highest earning potential, with monthly revenues capable of climbing to $2,953, occupancy reaching a high of 52.0%, and ADRs peaking at $173.
- Conversely, the slowest single month of the year, typically falling within the low season, marks the market's lowest point. In this month, revenue might dip to $1,189, occupancy could drop to 25.7%, and ADRs may adjust down to $161.
- Understanding both the seasonal averages and these monthly peaks and troughs in revenue, occupancy, and ADR is crucial for maximizing your Airbnb profit potential in Port Hope.
Seasonal Strategies for Maximizing Profit
- Peak Season: Maximize revenue through premium pricing and potentially longer minimum stays. Ensure high availability.
- Low Season: Offer competitive pricing, special promotions (e.g., extended stay discounts), and flexible cancellation policies. Target off-season travelers like remote workers or budget-conscious guests.
- Shoulder Seasons: Implement dynamic pricing that balances peak and low rates. Target weekend travelers or specific events. Offer slightly more flexible terms than peak season.
- Regularly analyze your own performance against these Port Hope seasonality benchmarks and adjust your pricing and availability strategy accordingly.
Best Areas for Airbnb Investment in Port Hope (2025)
Exploring the top neighborhoods for short-term rentals in Port Hope? This section highlights key areas, outlining why they are attractive for hosts and guests, along with notable local attractions. Consider these locations based on your target guest profile and investment strategy.
| Neighborhood / Area | Why Host Here? (Target Guests & Appeal) | Key Attractions & Landmarks |
|---|---|---|
| Downtown Port Hope | Charming and historic downtown area with boutique shops, cafes, and restaurants. A lively spot for visitors wanting to explore local culture and enjoy events. | Capitol Theatre, Port Hope Marina, Downtown Shops, Annual Port Hope Festival of Lights, Heather's Bakery |
| Lake Ontario Waterfront | Scenic waterfront area perfect for relaxation and outdoor activities. Attracts nature lovers, families, and those looking to enjoy water sports and scenic views. | Port Hope Beach, East Beach, Lake Ontario, Daniel Blvd Trail, Port Hope Park |
| Port Hope Conservation Area | Natural area for hiking and outdoor activities, great for families and nature enthusiasts looking to escape to nature while still being close to town. | Trails, Picnic Areas, Wildlife Watching, Fishing, Birding |
| Victoria Park | A tranquil park area close to downtown that is popular for summer events, picnics, and outdoor activities. | Victoria Park Pavilion, Summer Concerts, Open Green Spaces, Childrens' Playground, Walking Paths |
| Port Hope Golf Club | A popular destination for golf enthusiasts and those looking to enjoy a relaxing day outside. Attracts visitors from both the local area and beyond. | 18-hole Golf Course, Clubhouse Dining, Pro Shop, Scenic Landscapes, Golf Tournaments |
| Historic Home District | Known for its beautiful historic homes that attract visitors interested in heritage and architecture. Great for tourists seeking local history. | Heritage Walks, Port Hope Archives, Old Town Hall, Gardens, Street Art |
| Cobourg Beach | Just a short drive, this beach attracts visitors looking for a day by the water. It's perfect for families and those interested in sandy beaches and swimming. | Georgian Bay, Boardwalk, Picnic Areas, Swimming, Water Sports |
| Ganaraska Forest | A vast natural area offering hiking, mountain biking, and winter sports. Draws adventure seekers and nature lovers who enjoy outdoor activities. | Hiking Trails, Mountain Biking Trails, Skiing and Snowboarding, Nature Observation, Campsites |
Understanding Airbnb License Requirements & STR Laws in Port Hope (2025)
While Port Hope, Ontario, Canada currently shows low STR regulations, specific Airbnb license requirements might still exist or change. Always verify the latest short term rental regulations and Airbnb license requirements directly with local government authorities for Port Hope to ensure full compliance before hosting.
(Source: AirROI data, 2025, finding no licensed listings among those analyzed)
Top Performing Airbnb Properties in Port Hope (2025)
Benchmark your potential! Explore examples of top-performing Airbnb properties in Port Hopebased on Trailing Twelve Month (TTM) revenue. Analyze their characteristics, revenue, occupancy rate, and ADR to understand what drives success in this market.
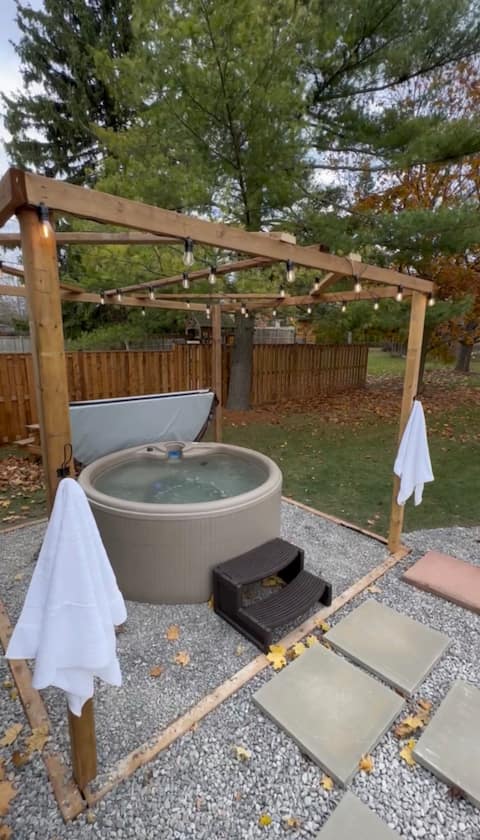
Charming 3BR Bungalow + Hot Tub in Port Hope
Entire Place • 3 bedrooms

The Wilf Jones & Colette Rose
Entire Place • 4 bedrooms
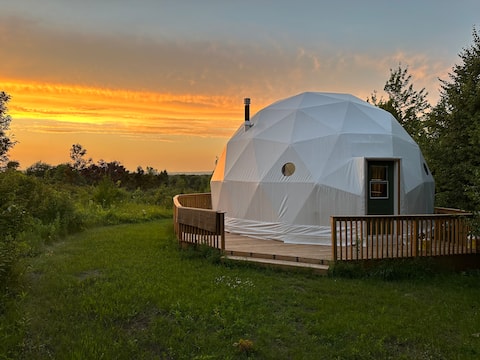
foxberry domes | unique glamping 1hr from Toronto
Entire Place • 1 bedroom

PoHo House: Cozy, Curated, Central & Dog-Friendly
Entire Place • 2 bedrooms

Historic 1850s Walton St. Apt w/ Rooftop Hot Tub
Entire Place • 2 bedrooms

Parisian 1850s Walton Street Heritage Pied A Terre
Entire Place • 2 bedrooms
Note: Performance varies based on location, size, amenities, seasonality, and management quality. Data reflects the past 12 months.
Top Performing Airbnb Hosts in Port Hope (2025)
Learn from the best! This table showcases top-performing Airbnb hosts in Port Hope based on the number of properties managed and estimated total revenue over the past year. Analyze their scale and performance metrics.
| Host Name | Properties | Grossing Revenue | Stay Reviews | Avg Rating |
|---|---|---|---|---|
| Jasmine | 3 | $110,704 | 227 | 3.33/5.0 |
| Doug | 2 | $74,797 | 52 | 4.99/5.0 |
| Samantha | 2 | $59,451 | 208 | 4.57/5.0 |
| R O | 2 | $55,835 | 26 | 4.76/5.0 |
| Nicole | 2 | $50,441 | 249 | 4.76/5.0 |
| Heather | 2 | $48,180 | 189 | 4.84/5.0 |
| Debbie | 4 | $38,752 | 167 | 4.92/5.0 |
| Port Hope Suites | 3 | $35,407 | 14 | 4.67/5.0 |
| K. Dee | 1 | $33,216 | 176 | 4.99/5.0 |
| Scott | 1 | $27,557 | 192 | 4.84/5.0 |
Analyzing the strategies of top hosts, such as their property selection, pricing, and guest communication, can offer valuable lessons for optimizing your own Airbnb operations in Port Hope.
Dive Deeper: Advanced Port Hope STR Market Data (2025)
Ready to unlock more insights? AirROI provides access to advanced metrics and comprehensive Airbnb data for Port Hope. Explore detailed analytics beyond this report to refine your investment strategy, optimize pricing, and maximize your vacation rental profits.
Explore Advanced MetricsPort Hope Short-Term Rental Market Composition (2025): Property & Room Types
Room Type Distribution
Property Type Distribution
Market Composition Insights for Port Hope
- The Port Hope Airbnb market composition is heavily skewed towards Entire Home/Apt listings, which make up 80% of the 40 active rentals. This indicates strong guest preference for privacy and space.
- Looking at the property type distribution in Port Hope, House properties are the most common (40%), reflecting the local real estate landscape.
- Houses represent a significant 40% portion, catering likely to families or larger groups.
- The presence of 12.5% Hotel/Boutique listings indicates integration with traditional hospitality.
Port Hope Airbnb Room Capacity Analysis (2025): Bedroom Distribution
Distribution of Listings by Number of Bedrooms
Room Capacity Insights for Port Hope
- The dominant room capacity in Port Hope is 1 bedroom listings, making up 52.5% of the market. This suggests a strong demand for properties suitable for couples or solo travelers.
- Together, 1 bedroom and 2 bedrooms properties represent 67.5% of the active Airbnb listings in Port Hope, indicating a high concentration in these sizes.
- With over half the market (52.5%) consisting of studios or 1-bedroom units, Port Hope is particularly well-suited for individuals or couples.
- A significant 22.5% of listings offer 3+ bedrooms, catering to larger groups and families seeking more space in Port Hope.
Port Hope Vacation Rental Guest Capacity Trends (2025)
Distribution of Listings by Guest Capacity
Guest Capacity Insights for Port Hope
- The most common guest capacity trend in Port Hope vacation rentals is listings accommodating 2 guests (40%). This suggests the primary traveler segment is likely couples or solo travelers.
- Properties designed for 2 guests and 4 guests dominate the Port Hope STR market, accounting for 65.0% of listings.
- 22.5% of properties accommodate 6+ guests, serving the market segment for larger families or group travel in Port Hope.
- On average, properties in Port Hope are equipped to host 3.6 guests.
Port Hope Airbnb Booking Patterns (2025): Available vs. Booked Days
Available Days Distribution
Booked Days Distribution
Booking Pattern Insights for Port Hope
- The most common availability pattern in Port Hope falls within the 271-366 days range, representing 45% of listings. This suggests many properties have significant open periods on their calendars.
- Approximately 75.0% of listings show high availability (181+ days open annually), indicating potential for increased bookings or specific owner usage patterns.
- For booked days, the 31-90 days range is most frequent in Port Hope (30%), reflecting common guest stay durations or potential owner blocking patterns.
- A notable 27.5% of properties secure long booking periods (181+ days booked per year), highlighting successful long-term rental strategies or significant owner usage.
Port Hope Airbnb Minimum Stay Requirements Analysis
Distribution of Listings by Minimum Night Requirement
1 Night
17 listings
43.6% of total
2 Nights
17 listings
43.6% of total
3 Nights
1 listings
2.6% of total
4-6 Nights
1 listings
2.6% of total
7-29 Nights
1 listings
2.6% of total
30+ Nights
2 listings
5.1% of total
Key Insights
- The most prevalent minimum stay requirement in Port Hope is 1 Night, adopted by 43.6% of listings. This highlights the market's preference for shorter, flexible bookings.
- A strong majority (87.2%) of the Port Hope Airbnb data shows acceptance of very short stays (1-2 nights), indicating a dynamic, high-turnover market.
Recommendations
- Align with the market by considering a 1 Night minimum stay, as 43.6% of Port Hope hosts use this setting.
- Explore offering discounts for stays of 30+ nights to attract the 5.1% of the market seeking extended stays.
- Adjust minimum nights based on seasonality – potentially shorter during low season and longer during peak demand periods in Port Hope.
Port Hope Airbnb Cancellation Policy Trends Analysis (2025)
Flexible
9 listings
23.7% of total
Moderate
10 listings
26.3% of total
Firm
6 listings
15.8% of total
Strict
13 listings
34.2% of total
Cancellation Policy Insights for Port Hope
- The prevailing Airbnb cancellation policy trend in Port Hope is Strict, used by 34.2% of listings.
- There's a relatively balanced mix between guest-friendly (50.0%) and stricter (50.0%) policies, offering choices for different guest needs.
Recommendations for Hosts
- Consider adopting a Strict policy to align with the 34.2% market standard in Port Hope.
- With 34.2% using Strict terms, this is a viable option in Port Hope, particularly for high-value properties or during peak demand periods.
- Regularly review your cancellation policy against competitors and market demand shifts in Port Hope.
Port Hope STR Booking Lead Time Analysis (2025)
Average Booking Lead Time by Month
Booking Lead Time Insights for Port Hope
- The overall average booking lead time for vacation rentals in Port Hope is 37 days.
- Guests book furthest in advance for stays during June (average 75 days), likely coinciding with peak travel demand or local events.
- The shortest booking windows occur for stays in February (average 16 days), indicating more last-minute travel plans during this time.
- Seasonally, Summer (66 days avg.) sees the longest lead times, while Winter (29 days avg.) has the shortest, reflecting typical travel planning cycles.
Recommendations for Hosts
- Use the overall average lead time (37 days) as a baseline for your pricing and availability strategy in Port Hope.
- For June stays, consider implementing length-of-stay discounts or slightly higher rates for bookings made less than 75 days out to capitalize on advance planning.
- Target marketing efforts for the Summer season well in advance (at least 66 days) to capture early planners.
- Monitor your own booking lead times against these Port Hope averages to identify opportunities for dynamic pricing adjustments.
Popular & Essential Airbnb Amenities in Port Hope (2025)
Amenity Prevalence
Amenity Insights for Port Hope
- Essential amenities in Port Hope that guests expect include: Smoke alarm, Carbon monoxide alarm, Heating. Lacking these (any) could significantly impact bookings.
- Popular amenities like Fire extinguisher, Bed linens, Essentials are common but not universal. Offering these can provide a competitive edge.
- Warning: Wifi is not universally provided but is considered essential globally. Ensure reliable Wifi is offered.
Recommendations for Hosts
- Ensure your listing includes all essential amenities for Port Hope: Smoke alarm, Carbon monoxide alarm, Heating.
- Prioritize adding missing essentials: Heating.
- Consider adding popular differentiators like Fire extinguisher or Bed linens to increase appeal.
- Highlight unique or less common amenities you offer (e.g., hot tub, dedicated workspace, EV charger) in your listing description and photos.
- Regularly check competitor amenities in Port Hope to stay competitive.
Port Hope Airbnb Guest Demographics & Profile Analysis (2025)
Guest Profile Summary for Port Hope
- The typical guest profile for Airbnb in Port Hope consists of primarily domestic travelers (85%), often arriving from nearby Toronto, typically belonging to the Post-2000s (Gen Z/Alpha) group (50%), primarily speaking English or French.
- Domestic travelers account for 84.5% of guests.
- Key international markets include Canada (84.5%) and United States (8.9%).
- Top languages spoken are English (61.6%) followed by French (15.1%).
- A significant demographic segment is the Post-2000s (Gen Z/Alpha) group, representing 50% of guests.
Recommendations for Hosts
- Target domestic marketing efforts towards travelers from Toronto and Ottawa.
- Tailor amenities and listing descriptions to appeal to the dominant Post-2000s (Gen Z/Alpha) demographic (e.g., highlight fast WiFi, smart home features, local guides).
- Highlight unique local experiences or amenities relevant to the primary guest profile.
- Consider seasonal promotions aligned with peak travel times for key origin markets.
Nearby Short-Term Rental Market Comparison
How does the Port Hope Airbnb market stack up against its neighbors? Compare key performance metrics like average monthly revenue, ADR, and occupancy rates in surrounding areas to understand the broader regional STR landscape.
| Market | Active Properties | Monthly Revenue | Daily Rate | Avg. Occupancy |
|---|---|---|---|---|
| Rushville | 13 | $6,613 | $489.17 | 50% |
| Naples | 21 | $6,262 | $553.45 | 47% |
| Town of Canandaigua | 84 | $4,922 | $429.04 | 44% |
| Town of Mansfield | 58 | $4,670 | $517.93 | 32% |
| Town of Pulteney | 63 | $4,627 | $428.38 | 46% |
| Town of West Seneca | 15 | $4,337 | $246.11 | 52% |
| Town of Porter | 25 | $4,243 | $300.26 | 55% |
| Town of Ellicottville | 201 | $3,840 | $380.95 | 36% |
| Town of Barrington | 50 | $3,791 | $333.22 | 47% |
| Carrying Place | 20 | $3,737 | $315.96 | 48% |