Perth Airbnb Market Analysis 2025: Short Term Rental Data & Vacation Rental Statistics in Ontario, Canada
Is Airbnb profitable in Perth in 2025? Explore comprehensive Airbnb analytics for Perth, Ontario, Canada to uncover income potential. This 2025 STR market report for Perth, based on AirROI data from April 2024 to March 2025, reveals key trends in the niche market of 30 active listings.
Whether you're considering an Airbnb investment in Perth, optimizing your existing vacation rental, or exploring rental arbitrage opportunities, understanding the Perth Airbnb data is crucial. Leveraging the low regulation environment is key to maximizing your short term rental income potential. Let's dive into the specifics.
Key Perth Airbnb Performance Metrics Overview
Monthly Airbnb Revenue Variations & Income Potential in Perth (2025)
Understanding the monthly revenue variations for Airbnb listings in Perth is key to maximizing your short term rental income potential. Seasonality significantly impacts earnings. Our analysis, based on data from the past 12 months, shows that the peak revenue month for STRs in Perth is typically June, while March often presents the lowest earnings, highlighting opportunities for strategic pricing adjustments during shoulder and low seasons. Explore the typical Airbnb income in Perth across different performance tiers:
- Best-in-class properties (Top 10%) achieve $4,168+ monthly, often utilizing dynamic pricing and superior guest experiences.
- Strong performing properties (Top 25%) earn $2,492 or more, indicating effective management and desirable locations/amenities.
- Typical properties (Median) generate around $1,460 per month, representing the average market performance.
- Entry-level properties (Bottom 25%) see earnings around $743, often with potential for optimization.
Average Monthly Airbnb Earnings Trend in Perth
Perth Airbnb Occupancy Rate Trends (2025)
Maximize your bookings by understanding the Perth STR occupancy trends. Seasonal demand shifts significantly influence how often properties are booked. Typically, Augustsees the highest demand (peak season occupancy), while March experiences the lowest (low season). Effective strategies, like adjusting minimum stays or offering promotions, can boost occupancy during slower periods. Here's how different property tiers perform in Perth:
- Best-in-class properties (Top 10%) achieve 79%+ occupancy, indicating high desirability and potentially optimized availability.
- Strong performing properties (Top 25%) maintain 60% or higher occupancy, suggesting good market fit and guest satisfaction.
- Typical properties (Median) have an occupancy rate around 32%.
- Entry-level properties (Bottom 25%) average 17% occupancy, potentially facing higher vacancy.
Average Monthly Occupancy Rate Trend in Perth
Average Daily Rate (ADR) Airbnb Trends in Perth (2025)
Effective short term rental pricing strategy in Perth involves understanding monthly ADR fluctuations. The Average Daily Rate (ADR) for Airbnb in Perth typically peaks in November and dips lowest during September. Leveraging Airbnb dynamic pricing tools or strategies based on this seasonality can significantly boost revenue. Here's a look at the typical nightly rates achieved:
- Best-in-class properties (Top 10%) command rates of $251+ per night, often due to premium features or locations.
- Strong performing properties (Top 25%) achieve nightly rates of $166 or more.
- Typical properties (Median) charge around $128 per night.
- Entry-level properties (Bottom 25%) earn around $78 per night.
Average Daily Rate (ADR) Trend by Month in Perth
Get Live Perth Market Intelligence 👇

Explore Real-time Analytics
Airbnb Seasonality Analysis & Trends in Perth (2025)
Peak Season (June, August, May)
- Revenue averages $2,394 per month
- Occupancy rates average 46.6%
- Daily rates average $149
Shoulder Season
- Revenue averages $1,877 per month
- Occupancy maintains around 39.1%
- Daily rates hold near $153
Low Season (February, March, November)
- Revenue drops to average $1,506 per month
- Occupancy decreases to average 32.1%
- Daily rates adjust to average $162
Seasonality Insights for Perth
- The Airbnb seasonality in Perth shows moderate seasonality with distinct peak and low periods. While the sections above show seasonal averages, it's also insightful to look at the extremes:
- During the high season, the absolute peak month showcases Perth's highest earning potential, with monthly revenues capable of climbing to $2,669, occupancy reaching a high of 49.4%, and ADRs peaking at $167.
- Conversely, the slowest single month of the year, typically falling within the low season, marks the market's lowest point. In this month, revenue might dip to $1,342, occupancy could drop to 28.4%, and ADRs may adjust down to $148.
- Understanding both the seasonal averages and these monthly peaks and troughs in revenue, occupancy, and ADR is crucial for maximizing your Airbnb profit potential in Perth.
Seasonal Strategies for Maximizing Profit
- Peak Season: Maximize revenue through premium pricing and potentially longer minimum stays. Ensure high availability.
- Low Season: Offer competitive pricing, special promotions (e.g., extended stay discounts), and flexible cancellation policies. Target off-season travelers like remote workers or budget-conscious guests.
- Shoulder Seasons: Implement dynamic pricing that balances peak and low rates. Target weekend travelers or specific events. Offer slightly more flexible terms than peak season.
- Regularly analyze your own performance against these Perth seasonality benchmarks and adjust your pricing and availability strategy accordingly.
Best Areas for Airbnb Investment in Perth (2025)
Exploring the top neighborhoods for short-term rentals in Perth? This section highlights key areas, outlining why they are attractive for hosts and guests, along with notable local attractions. Consider these locations based on your target guest profile and investment strategy.
| Neighborhood / Area | Why Host Here? (Target Guests & Appeal) | Key Attractions & Landmarks |
|---|---|---|
| Downtown Perth | Central business area with restaurants, shops, and cultural venues. Great for attracting both business travelers and tourists who want to experience local attractions. | Perth Museum, Stewart Park, Conlon Farm, Perth Farmers' Market, Crystal Palace |
| Smiths Falls | Nearby town with access to the Rideau Canal and significant historical sites. Appeals to visitors interested in outdoor activities and heritage tourism. | Rideau Canal, Heritage House Museum, Smiths Falls Railway Museum, Outdoor recreation areas, Local craft breweries |
| Westport | Charming village on the Rideau Lakes, perfect for outdoor enthusiasts and vacationers looking for a peaceful retreat. Popular for water-related activities. | Rideau Lakes, Westport Harbour, Spa Spa, Local art galleries, Kayaking and canoeing |
| Lanark Highlands | Scenic natural landscapes and outdoor recreational opportunities. Ideal for visitors seeking nature retreats and country getaways. | Maberly Heritage Park, Bennett Lake, Local hiking trails, Fishing spots, Nature conservation areas |
| Tatlock | A small community known for natural beauty and lakeside activities. Great for rural tourism and attracting visitors looking for relaxation. | Lakeside parks, Local trails, Adventure tourism spots, Fishing and boating, Community events |
| Rideau Ferry | A picturesque village located on the shores of Upper Rideau Lake, popular for summer vacations and water sports. | Rideau Ferry Conservation Area, Water activities, Lake access, Local eateries, Scenic views |
| Perth Road | Strategically located for those looking to explore the greater region while enjoying a quieter community vibe. Appeals to families and travelers seeking tranquility. | Local parks, Scenic drives, Nearby attractions in Perth, Community gatherings, Cultural events |
| Fallbrook | A rural community with a strong sense of local character. Perfect for visitors wanting to experience rural Ontario life and outdoor adventures. | Local farms, Nature trails, Birdwatching, Quiet retreats, Cultural heritage sites |
Understanding Airbnb License Requirements & STR Laws in Perth (2025)
While Perth, Ontario, Canada currently shows low STR regulations, specific Airbnb license requirements might still exist or change. Always verify the latest short term rental regulations and Airbnb license requirements directly with local government authorities for Perth to ensure full compliance before hosting.
(Source: AirROI data, 2025, finding no licensed listings among those analyzed)
Top Performing Airbnb Properties in Perth (2025)
Benchmark your potential! Explore examples of top-performing Airbnb properties in Perthbased on Trailing Twelve Month (TTM) revenue. Analyze their characteristics, revenue, occupancy rate, and ADR to understand what drives success in this market.
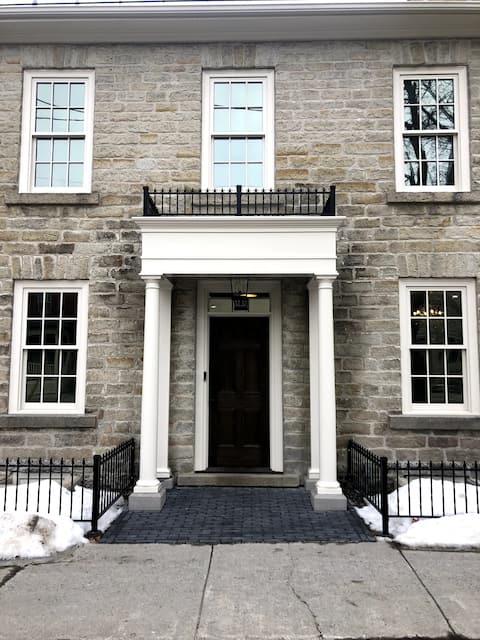
The Stonehouse on Gore
Entire Place • 3 bedrooms
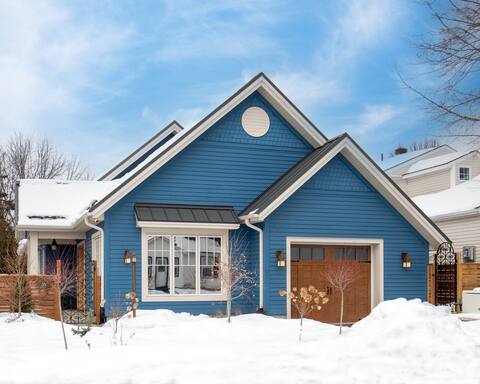
The Haven on Halton
Entire Place • 2 bedrooms
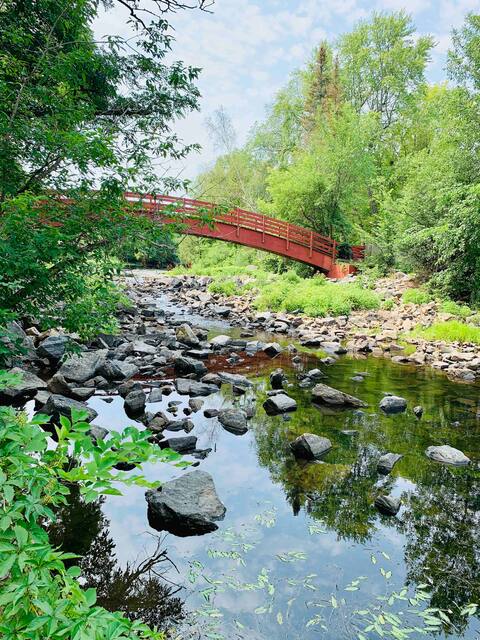
Riverfront 1832 stone home in the heart of Perth!
Entire Place • 3 bedrooms
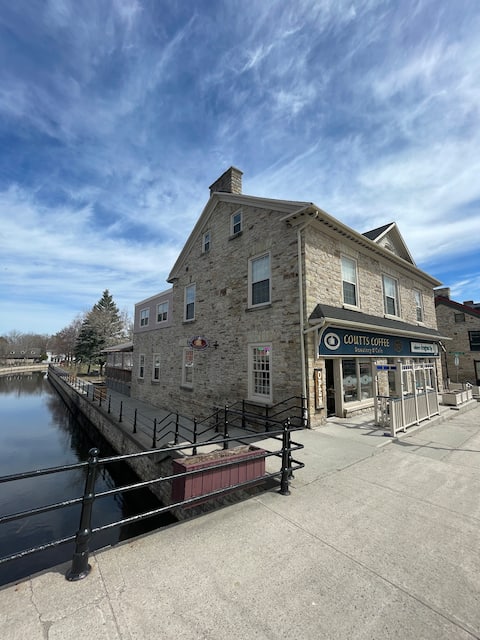
The Sheriff's Quarters
Entire Place • 1 bedroom
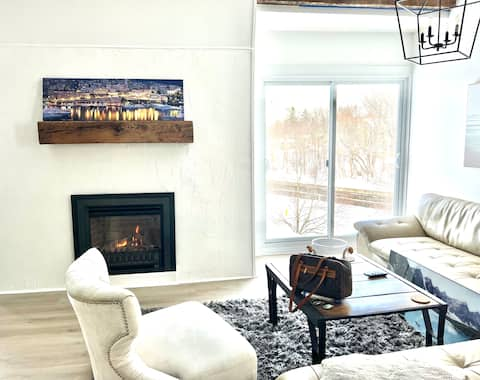
Monte Carlo Chic Water view Loft (2 bedrooms/2 FL)
Entire Place • 2 bedrooms
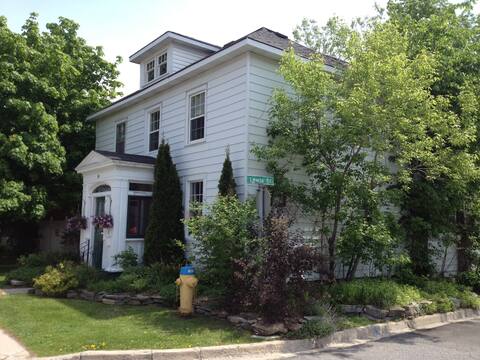
"Quinn’s Guesthouse" Private 2 Bedroom apartment
Entire Place • 2 bedrooms
Note: Performance varies based on location, size, amenities, seasonality, and management quality. Data reflects the past 12 months.
Top Performing Airbnb Hosts in Perth (2025)
Learn from the best! This table showcases top-performing Airbnb hosts in Perth based on the number of properties managed and estimated total revenue over the past year. Analyze their scale and performance metrics.
| Host Name | Properties | Grossing Revenue | Stay Reviews | Avg Rating |
|---|---|---|---|---|
| Shayne.D | 3 | $161,413 | 77 | 4.95/5.0 |
| Randa Catherine | 5 | $88,016 | 591 | 4.89/5.0 |
| Host #465207694 | 5 | $42,158 | 7 | 0.00/5.0 |
| Robyn | 1 | $39,467 | 54 | 4.81/5.0 |
| John | 1 | $25,023 | 387 | 4.92/5.0 |
| Amanda | 1 | $24,418 | 33 | 4.94/5.0 |
| Sharon | 1 | $24,333 | 32 | 4.91/5.0 |
| Sheldon | 1 | $21,384 | 14 | 4.93/5.0 |
| Dan | 1 | $16,767 | 67 | 4.96/5.0 |
| Diana | 1 | $14,951 | 28 | 5.00/5.0 |
Analyzing the strategies of top hosts, such as their property selection, pricing, and guest communication, can offer valuable lessons for optimizing your own Airbnb operations in Perth.
Dive Deeper: Advanced Perth STR Market Data (2025)
Ready to unlock more insights? AirROI provides access to advanced metrics and comprehensive Airbnb data for Perth. Explore detailed analytics beyond this report to refine your investment strategy, optimize pricing, and maximize your vacation rental profits.
Explore Advanced MetricsPerth Short-Term Rental Market Composition (2025): Property & Room Types
Room Type Distribution
Property Type Distribution
Market Composition Insights for Perth
- The Perth Airbnb market composition is heavily skewed towards Entire Home/Apt listings, which make up 66.7% of the 30 active rentals. This indicates strong guest preference for privacy and space.
- However, a notable 33.3% share for Private Rooms suggests opportunities for budget-conscious travelers or hosts renting out spare rooms.
- Looking at the property type distribution in Perth, Apartment/Condo properties are the most common (36.7%), reflecting the local real estate landscape.
- Houses represent a significant 23.3% portion, catering likely to families or larger groups.
- The presence of 30% Hotel/Boutique listings indicates integration with traditional hospitality.
- Smaller segments like outdoor/unique (combined 3.3%) offer potential for unique stay experiences.
Perth Airbnb Room Capacity Analysis (2025): Bedroom Distribution
Distribution of Listings by Number of Bedrooms
Room Capacity Insights for Perth
- The dominant room capacity in Perth is 1 bedroom listings, making up 60% of the market. This suggests a strong demand for properties suitable for couples or solo travelers.
- Together, 1 bedroom and 2 bedrooms properties represent 83.3% of the active Airbnb listings in Perth, indicating a high concentration in these sizes.
- With over half the market (60%) consisting of studios or 1-bedroom units, Perth is particularly well-suited for individuals or couples.
Perth Vacation Rental Guest Capacity Trends (2025)
Distribution of Listings by Guest Capacity
Guest Capacity Insights for Perth
- The most common guest capacity trend in Perth vacation rentals is listings accommodating 2 guests (36.7%). This suggests the primary traveler segment is likely couples or solo travelers.
- Properties designed for 2 guests and 4 guests dominate the Perth STR market, accounting for 66.7% of listings.
- A significant 43.4% of listings cater specifically to 1-2 guests, highlighting strong demand from couples and solo travelers in Perth.
- 16.7% of properties accommodate 6+ guests, serving the market segment for larger families or group travel in Perth.
- On average, properties in Perth are equipped to host 3.5 guests.
Perth Airbnb Booking Patterns (2025): Available vs. Booked Days
Available Days Distribution
Booked Days Distribution
Booking Pattern Insights for Perth
- The most common availability pattern in Perth falls within the 271-366 days range, representing 46.7% of listings. This suggests many properties have significant open periods on their calendars.
- Approximately 83.4% of listings show high availability (181+ days open annually), indicating potential for increased bookings or specific owner usage patterns.
- For booked days, the 91-180 days range is most frequent in Perth (43.3%), reflecting common guest stay durations or potential owner blocking patterns.
- A notable 16.6% of properties secure long booking periods (181+ days booked per year), highlighting successful long-term rental strategies or significant owner usage.
Perth Airbnb Minimum Stay Requirements Analysis
Distribution of Listings by Minimum Night Requirement
1 Night
19 listings
70.4% of total
2 Nights
8 listings
29.6% of total
Key Insights
- The most prevalent minimum stay requirement in Perth is 1 Night, adopted by 70.4% of listings. This highlights the market's preference for shorter, flexible bookings.
- A strong majority (100.0%) of the Perth Airbnb data shows acceptance of very short stays (1-2 nights), indicating a dynamic, high-turnover market.
Recommendations
- Align with the market by considering a 1 Night minimum stay, as 70.4% of Perth hosts use this setting.
- Adjust minimum nights based on seasonality – potentially shorter during low season and longer during peak demand periods in Perth.
Perth Airbnb Cancellation Policy Trends Analysis (2025)
Flexible
4 listings
19% of total
Moderate
7 listings
33.3% of total
Firm
9 listings
42.9% of total
Strict
1 listings
4.8% of total
Cancellation Policy Insights for Perth
- The prevailing Airbnb cancellation policy trend in Perth is Firm, used by 42.9% of listings.
- There's a relatively balanced mix between guest-friendly (52.3%) and stricter (47.7%) policies, offering choices for different guest needs.
- Strict cancellation policies are quite rare (4.8%), potentially making listings with this policy less competitive unless justified by high demand or property type.
Recommendations for Hosts
- Consider adopting a Firm policy to align with the 42.9% market standard in Perth.
- Using a Strict policy might deter some guests, as only 4.8% of listings use it. Evaluate if potential revenue protection outweighs possible lower booking rates.
- Regularly review your cancellation policy against competitors and market demand shifts in Perth.
Perth STR Booking Lead Time Analysis (2025)
Average Booking Lead Time by Month
Booking Lead Time Insights for Perth
- The overall average booking lead time for vacation rentals in Perth is 41 days.
- Guests book furthest in advance for stays during June (average 77 days), likely coinciding with peak travel demand or local events.
- The shortest booking windows occur for stays in March (average 21 days), indicating more last-minute travel plans during this time.
- Seasonally, Summer (62 days avg.) sees the longest lead times, while Winter (29 days avg.) has the shortest, reflecting typical travel planning cycles.
Recommendations for Hosts
- Use the overall average lead time (41 days) as a baseline for your pricing and availability strategy in Perth.
- For June stays, consider implementing length-of-stay discounts or slightly higher rates for bookings made less than 77 days out to capitalize on advance planning.
- Target marketing efforts for the Summer season well in advance (at least 62 days) to capture early planners.
- Monitor your own booking lead times against these Perth averages to identify opportunities for dynamic pricing adjustments.
Popular & Essential Airbnb Amenities in Perth (2025)
Amenity Prevalence
Amenity Insights for Perth
- Essential amenities in Perth that guests expect include: Air conditioning, Wifi, Smoke alarm, Hot water, Heating. Lacking these (any) could significantly impact bookings.
- Popular amenities like Fire extinguisher, Kitchen, Essentials are common but not universal. Offering these can provide a competitive edge.
Recommendations for Hosts
- Ensure your listing includes all essential amenities for Perth: Air conditioning, Wifi, Smoke alarm, Hot water, Heating.
- Prioritize adding missing essentials: Heating.
- Consider adding popular differentiators like Fire extinguisher or Kitchen to increase appeal.
- Highlight unique or less common amenities you offer (e.g., hot tub, dedicated workspace, EV charger) in your listing description and photos.
- Regularly check competitor amenities in Perth to stay competitive.
Perth Airbnb Guest Demographics & Profile Analysis (2025)
Guest Profile Summary for Perth
- The typical guest profile for Airbnb in Perth consists of primarily domestic travelers (89%), often arriving from nearby Toronto, typically belonging to the Post-2000s (Gen Z/Alpha) group (50%), primarily speaking English or French.
- Domestic travelers account for 88.7% of guests.
- Key international markets include Canada (88.7%) and United States (3%).
- Top languages spoken are English (65.7%) followed by French (16.4%).
- A significant demographic segment is the Post-2000s (Gen Z/Alpha) group, representing 50% of guests.
Recommendations for Hosts
- Target domestic marketing efforts towards travelers from Toronto and Ottawa.
- Tailor amenities and listing descriptions to appeal to the dominant Post-2000s (Gen Z/Alpha) demographic (e.g., highlight fast WiFi, smart home features, local guides).
- Highlight unique local experiences or amenities relevant to the primary guest profile.
- Consider seasonal promotions aligned with peak travel times for key origin markets.
Nearby Short-Term Rental Market Comparison
How does the Perth Airbnb market stack up against its neighbors? Compare key performance metrics like average monthly revenue, ADR, and occupancy rates in surrounding areas to understand the broader regional STR landscape.
| Market | Active Properties | Monthly Revenue | Daily Rate | Avg. Occupancy |
|---|---|---|---|---|
| Town of Trenton | 11 | $8,040 | $458.56 | 54% |
| Cantley | 22 | $3,741 | $242.96 | 50% |
| Carrying Place | 20 | $3,737 | $315.96 | 48% |
| Town of Pittsford | 53 | $3,628 | $410.81 | 43% |
| Town of Cicero | 33 | $3,611 | $238.12 | 54% |
| Town of Sullivan | 29 | $3,459 | $293.24 | 47% |
| Town of Constantia | 26 | $3,449 | $311.45 | 38% |
| Town of Lenox | 20 | $3,440 | $328.91 | 46% |
| Town of Vernon | 10 | $3,396 | $206.81 | 47% |
| Rossmore | 10 | $3,345 | $268.20 | 56% |