Niagara-on-the-Lake Airbnb Market Analysis 2025: Short Term Rental Data & Vacation Rental Statistics in Ontario, Canada
Is Airbnb profitable in Niagara-on-the-Lake in 2025? Explore comprehensive Airbnb analytics for Niagara-on-the-Lake, Ontario, Canada to uncover income potential. This 2025 STR market report for Niagara-on-the-Lake, based on AirROI data from April 2024 to March 2025, reveals key trends in the market of 413 active listings.
Whether you're considering an Airbnb investment in Niagara-on-the-Lake, optimizing your existing vacation rental, or exploring rental arbitrage opportunities, understanding the Niagara-on-the-Lake Airbnb data is crucial. Navigating the high regulation landscape is key to maximizing your short term rental income potential. Let's dive into the specifics.
Key Niagara-on-the-Lake Airbnb Performance Metrics Overview
Monthly Airbnb Revenue Variations & Income Potential in Niagara-on-the-Lake (2025)
Understanding the monthly revenue variations for Airbnb listings in Niagara-on-the-Lake is key to maximizing your short term rental income potential. Seasonality significantly impacts earnings. Our analysis, based on data from the past 12 months, shows that the peak revenue month for STRs in Niagara-on-the-Lake is typically August, while February often presents the lowest earnings, highlighting opportunities for strategic pricing adjustments during shoulder and low seasons. Explore the typical Airbnb income in Niagara-on-the-Lake across different performance tiers:
- Best-in-class properties (Top 10%) achieve $7,900+ monthly, often utilizing dynamic pricing and superior guest experiences.
- Strong performing properties (Top 25%) earn $5,214 or more, indicating effective management and desirable locations/amenities.
- Typical properties (Median) generate around $3,186 per month, representing the average market performance.
- Entry-level properties (Bottom 25%) see earnings around $1,651, often with potential for optimization.
Average Monthly Airbnb Earnings Trend in Niagara-on-the-Lake
Niagara-on-the-Lake Airbnb Occupancy Rate Trends (2025)
Maximize your bookings by understanding the Niagara-on-the-Lake STR occupancy trends. Seasonal demand shifts significantly influence how often properties are booked. Typically, Augustsees the highest demand (peak season occupancy), while January experiences the lowest (low season). Effective strategies, like adjusting minimum stays or offering promotions, can boost occupancy during slower periods. Here's how different property tiers perform in Niagara-on-the-Lake:
- Best-in-class properties (Top 10%) achieve 74%+ occupancy, indicating high desirability and potentially optimized availability.
- Strong performing properties (Top 25%) maintain 58% or higher occupancy, suggesting good market fit and guest satisfaction.
- Typical properties (Median) have an occupancy rate around 41%.
- Entry-level properties (Bottom 25%) average 23% occupancy, potentially facing higher vacancy.
Average Monthly Occupancy Rate Trend in Niagara-on-the-Lake
Average Daily Rate (ADR) Airbnb Trends in Niagara-on-the-Lake (2025)
Effective short term rental pricing strategy in Niagara-on-the-Lake involves understanding monthly ADR fluctuations. The Average Daily Rate (ADR) for Airbnb in Niagara-on-the-Lake typically peaks in August and dips lowest during February. Leveraging Airbnb dynamic pricing tools or strategies based on this seasonality can significantly boost revenue. Here's a look at the typical nightly rates achieved:
- Best-in-class properties (Top 10%) command rates of $426+ per night, often due to premium features or locations.
- Strong performing properties (Top 25%) achieve nightly rates of $317 or more.
- Typical properties (Median) charge around $222 per night.
- Entry-level properties (Bottom 25%) earn around $162 per night.
Average Daily Rate (ADR) Trend by Month in Niagara-on-the-Lake
Get Live Niagara-on-the-Lake Market Intelligence 👇

Explore Real-time Analytics
Airbnb Seasonality Analysis & Trends in Niagara-on-the-Lake (2025)
Peak Season (August, July, June)
- Revenue averages $6,316 per month
- Occupancy rates average 60.2%
- Daily rates average $289
Shoulder Season
- Revenue averages $3,852 per month
- Occupancy maintains around 40.7%
- Daily rates hold near $259
Low Season (January, February, March)
- Revenue drops to average $1,766 per month
- Occupancy decreases to average 25.4%
- Daily rates adjust to average $238
Seasonality Insights for Niagara-on-the-Lake
- The Airbnb seasonality in Niagara-on-the-Lake shows highly seasonal trends requiring careful strategy. While the sections above show seasonal averages, it's also insightful to look at the extremes:
- During the high season, the absolute peak month showcases Niagara-on-the-Lake's highest earning potential, with monthly revenues capable of climbing to $6,901, occupancy reaching a high of 67.6%, and ADRs peaking at $293.
- Conversely, the slowest single month of the year, typically falling within the low season, marks the market's lowest point. In this month, revenue might dip to $1,648, occupancy could drop to 23.3%, and ADRs may adjust down to $236.
- Understanding both the seasonal averages and these monthly peaks and troughs in revenue, occupancy, and ADR is crucial for maximizing your Airbnb profit potential in Niagara-on-the-Lake.
Seasonal Strategies for Maximizing Profit
- Peak Season: Maximize revenue through premium pricing and potentially longer minimum stays. Ensure high availability.
- Low Season: Offer competitive pricing, special promotions (e.g., extended stay discounts), and flexible cancellation policies. Target off-season travelers like remote workers or budget-conscious guests.
- Shoulder Seasons: Implement dynamic pricing that balances peak and low rates. Target weekend travelers or specific events. Offer slightly more flexible terms than peak season.
- Regularly analyze your own performance against these Niagara-on-the-Lake seasonality benchmarks and adjust your pricing and availability strategy accordingly.
Best Areas for Airbnb Investment in Niagara-on-the-Lake (2025)
Exploring the top neighborhoods for short-term rentals in Niagara-on-the-Lake? This section highlights key areas, outlining why they are attractive for hosts and guests, along with notable local attractions. Consider these locations based on your target guest profile and investment strategy.
| Neighborhood / Area | Why Host Here? (Target Guests & Appeal) | Key Attractions & Landmarks |
|---|---|---|
| Old Town | Historic district renowned for its well-preserved 19th-century architecture and charming streets. Attracts tourists interested in history, culture, and a vibrant arts scene. | Shaw Festival, Niagara-on-the-Lake Heritage District, Queen Street shops, Fort George National Historic Site, Niagara River Parkway |
| Pine Street | A quieter neighborhood with a focus on relaxation and natural beauty, ideal for families and those looking for a peaceful retreat. | Niagara-on-the-Lake Golf Club, Lake Ontario, Niagara Parks Botanical Gardens, AJ McKinley Park |
| Nigh Road | Close proximity to wineries and vineyards, appealing to wine enthusiasts and couples looking for romantic getaways. | Road 13 Vineyards, Peller Estates Winery, Two Sisters Vineyards, Palatine Hills Estate Winery |
| The Commons | A residential area with easy access to parklands and community activities, perfect for families traveling to Niagara-on-the-Lake. | Niagara-on-the-Lake Community Centre, Queenston Heights Park, Larry's Market |
| Virgil | Located near major attractions outside of the town center, appealing to guests wanting a combination of local experiences and proximity to the wineries. | Niagara College Teaching winery, The Niagara Golf Course, Lock 7 Viewing Complex |
| Nutts Corners | Offers a blend of rural charm and accessibility, suitable for guests looking for a serene getaway while being close to attractions. | Angus Glen Golf Club, Tranquil Backyard Gardens |
| Rural Niagara | Ideal for those looking for a picturesque countryside experience, with plenty of outdoor activities and nature to explore. | Biking trails, Hiking pathways, Scenic views of vineyards |
| Queenston | Rich in history and scenic views, this area draws visitors interested in culture and the great outdoors, combined with local dining experiences. | Mackenzie Printery, Queenston Heights, The Olde Angel Inn |
Understanding Airbnb License Requirements & STR Laws in Niagara-on-the-Lake (2025)
Yes, Niagara-on-the-Lake, Ontario, Canada enforces high STR regulations. Obtaining a license and ensuring compliance is almost certainly required according to current 2025 STR laws. Always verify the latest short term rental regulations and Airbnb license requirements directly with local government authorities for Niagara-on-the-Lake to ensure full compliance before hosting.
(Source: AirROI data, 2025, based on 43% licensed listings)
Top Performing Airbnb Properties in Niagara-on-the-Lake (2025)
Benchmark your potential! Explore examples of top-performing Airbnb properties in Niagara-on-the-Lakebased on Trailing Twelve Month (TTM) revenue. Analyze their characteristics, revenue, occupancy rate, and ADR to understand what drives success in this market.

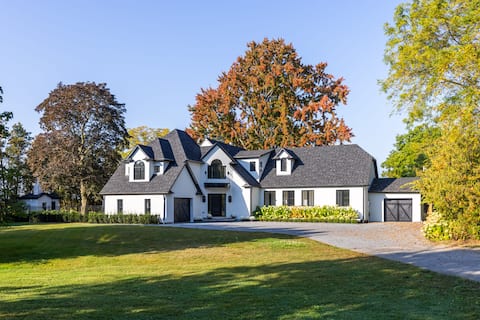
NOTL Lakefront living 5 Bedrooms w/ Ensuite baths
Entire Place • 5 bedrooms

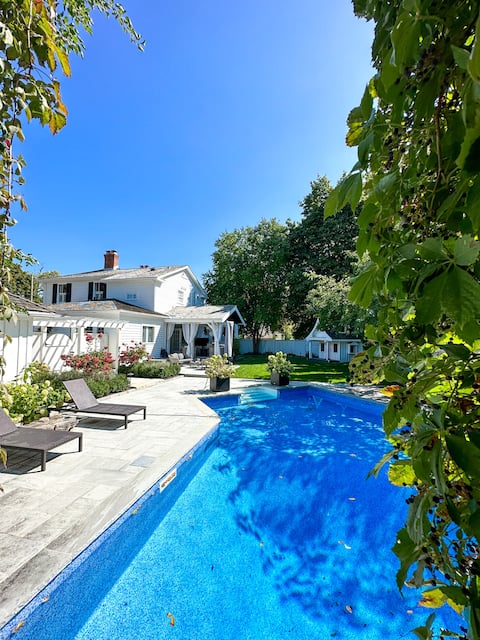
Amberlea House, home with pool, located in NOTL
Entire Place • 5 bedrooms
Beautiful Historical Luxury Getaway
Entire Place • 3 bedrooms
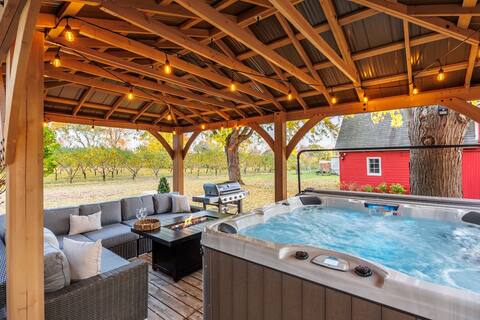
Scenic NOTL Farmhouse-Orchard Views-Hot Tub-Sauna
Entire Place • 3 bedrooms
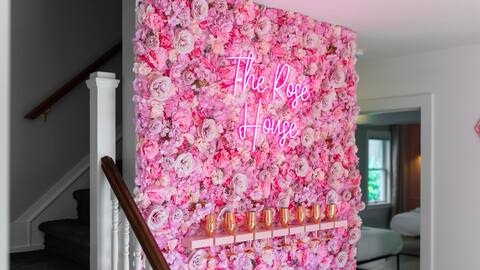
The Rosé House NOTL - Glam room - Old Town
Entire Place • 3 bedrooms
Vineyard Estate by the River with Pool!
Entire Place • 3 bedrooms
Note: Performance varies based on location, size, amenities, seasonality, and management quality. Data reflects the past 12 months.
Top Performing Airbnb Hosts in Niagara-on-the-Lake (2025)
Learn from the best! This table showcases top-performing Airbnb hosts in Niagara-on-the-Lake based on the number of properties managed and estimated total revenue over the past year. Analyze their scale and performance metrics.
| Host Name | Properties | Grossing Revenue | Stay Reviews | Avg Rating |
|---|---|---|---|---|
| Niagara Holiday Rentals | 27 | $1,869,717 | 1070 | 4.85/5.0 |
| Erica | 30 | $1,350,909 | 3050 | 4.96/5.0 |
| Travelluxe | 8 | $638,131 | 563 | 4.97/5.0 |
| Spencer & Ashley | 2 | $313,266 | 280 | 4.95/5.0 |
| Greg | 3 | $300,391 | 321 | 4.89/5.0 |
| Grace | 5 | $276,735 | 487 | 4.85/5.0 |
| Kent | 4 | $225,540 | 49 | 4.94/5.0 |
| Daniel | 5 | $204,502 | 376 | 4.93/5.0 |
| John | 1 | $199,888 | 34 | 4.76/5.0 |
| Paul & Jing | 3 | $196,548 | 757 | 4.88/5.0 |
Analyzing the strategies of top hosts, such as their property selection, pricing, and guest communication, can offer valuable lessons for optimizing your own Airbnb operations in Niagara-on-the-Lake.
Dive Deeper: Advanced Niagara-on-the-Lake STR Market Data (2025)
Ready to unlock more insights? AirROI provides access to advanced metrics and comprehensive Airbnb data for Niagara-on-the-Lake. Explore detailed analytics beyond this report to refine your investment strategy, optimize pricing, and maximize your vacation rental profits.
Explore Advanced MetricsNiagara-on-the-Lake Short-Term Rental Market Composition (2025): Property & Room Types
Room Type Distribution
Property Type Distribution
Market Composition Insights for Niagara-on-the-Lake
- The Niagara-on-the-Lake Airbnb market composition is heavily skewed towards Entire Home/Apt listings, which make up 74.6% of the 413 active rentals. This indicates strong guest preference for privacy and space.
- Looking at the property type distribution in Niagara-on-the-Lake, House properties are the most common (67.1%), reflecting the local real estate landscape.
- Houses represent a significant 67.1% portion, catering likely to families or larger groups.
- The presence of 16.2% Hotel/Boutique listings indicates integration with traditional hospitality.
- Smaller segments like outdoor/unique (combined 3.6%) offer potential for unique stay experiences.
Niagara-on-the-Lake Airbnb Room Capacity Analysis (2025): Bedroom Distribution
Distribution of Listings by Number of Bedrooms
Room Capacity Insights for Niagara-on-the-Lake
- The dominant room capacity in Niagara-on-the-Lake is 3 bedrooms listings, making up 40% of the market. This suggests a strong demand for properties suitable for families or small groups.
- Together, 3 bedrooms and 2 bedrooms properties represent 62.5% of the active Airbnb listings in Niagara-on-the-Lake, indicating a high concentration in these sizes.
- A significant 44.8% of listings offer 3+ bedrooms, catering to larger groups and families seeking more space in Niagara-on-the-Lake.
Niagara-on-the-Lake Vacation Rental Guest Capacity Trends (2025)
Distribution of Listings by Guest Capacity
Guest Capacity Insights for Niagara-on-the-Lake
- The most common guest capacity trend in Niagara-on-the-Lake vacation rentals is listings accommodating 6 guests (29.1%). This suggests the primary traveler segment is likely larger groups.
- Properties designed for 6 guests and 8+ guests dominate the Niagara-on-the-Lake STR market, accounting for 49.4% of listings.
- 51.6% of properties accommodate 6+ guests, serving the market segment for larger families or group travel in Niagara-on-the-Lake.
- On average, properties in Niagara-on-the-Lake are equipped to host 4.6 guests.
Niagara-on-the-Lake Airbnb Booking Patterns (2025): Available vs. Booked Days
Available Days Distribution
Booked Days Distribution
Booking Pattern Insights for Niagara-on-the-Lake
- The most common availability pattern in Niagara-on-the-Lake falls within the 181-270 days range, representing 41.9% of listings. This suggests many properties have significant open periods on their calendars.
- Approximately 71.2% of listings show high availability (181+ days open annually), indicating potential for increased bookings or specific owner usage patterns.
- For booked days, the 91-180 days range is most frequent in Niagara-on-the-Lake (41.9%), reflecting common guest stay durations or potential owner blocking patterns.
- A notable 30.7% of properties secure long booking periods (181+ days booked per year), highlighting successful long-term rental strategies or significant owner usage.
Niagara-on-the-Lake Airbnb Minimum Stay Requirements Analysis
Distribution of Listings by Minimum Night Requirement
1 Night
158 listings
39.4% of total
2 Nights
179 listings
44.6% of total
3 Nights
13 listings
3.2% of total
4-6 Nights
2 listings
0.5% of total
7-29 Nights
13 listings
3.2% of total
30+ Nights
36 listings
9% of total
Key Insights
- The most prevalent minimum stay requirement in Niagara-on-the-Lake is 2 Nights, adopted by 44.6% of listings. This highlights the market's preference for shorter, flexible bookings.
- A strong majority (84.0%) of the Niagara-on-the-Lake Airbnb data shows acceptance of very short stays (1-2 nights), indicating a dynamic, high-turnover market.
Recommendations
- Align with the market by considering a 2 Nights minimum stay, as 44.6% of Niagara-on-the-Lake hosts use this setting.
- Explore offering discounts for stays of 30+ nights to attract the 9% of the market seeking extended stays.
- Adjust minimum nights based on seasonality – potentially shorter during low season and longer during peak demand periods in Niagara-on-the-Lake.
Niagara-on-the-Lake Airbnb Cancellation Policy Trends Analysis (2025)
Super Strict 30 Days
30 listings
7.8% of total
Flexible
36 listings
9.4% of total
Moderate
105 listings
27.3% of total
Firm
107 listings
27.9% of total
Strict
106 listings
27.6% of total
Cancellation Policy Insights for Niagara-on-the-Lake
- The prevailing Airbnb cancellation policy trend in Niagara-on-the-Lake is Firm, used by 27.9% of listings.
- A majority (55.5%) of hosts in Niagara-on-the-Lake utilize Firm or Strict policies, indicating a market where hosts prioritize booking security.
Recommendations for Hosts
- Consider adopting a Firm policy to align with the 27.9% market standard in Niagara-on-the-Lake.
- Regularly review your cancellation policy against competitors and market demand shifts in Niagara-on-the-Lake.
Niagara-on-the-Lake STR Booking Lead Time Analysis (2025)
Average Booking Lead Time by Month
Booking Lead Time Insights for Niagara-on-the-Lake
- The overall average booking lead time for vacation rentals in Niagara-on-the-Lake is 59 days.
- Guests book furthest in advance for stays during June (average 91 days), likely coinciding with peak travel demand or local events.
- The shortest booking windows occur for stays in January (average 36 days), indicating more last-minute travel plans during this time.
- Seasonally, Summer (86 days avg.) sees the longest lead times, while Winter (42 days avg.) has the shortest, reflecting typical travel planning cycles.
Recommendations for Hosts
- Use the overall average lead time (59 days) as a baseline for your pricing and availability strategy in Niagara-on-the-Lake.
- For June stays, consider implementing length-of-stay discounts or slightly higher rates for bookings made less than 91 days out to capitalize on advance planning.
- Target marketing efforts for the Summer season well in advance (at least 86 days) to capture early planners.
- Monitor your own booking lead times against these Niagara-on-the-Lake averages to identify opportunities for dynamic pricing adjustments.
Popular & Essential Airbnb Amenities in Niagara-on-the-Lake (2025)
Amenity Prevalence
Amenity Insights for Niagara-on-the-Lake
- Essential amenities in Niagara-on-the-Lake that guests expect include: Air conditioning, Smoke alarm, Free parking on premises, Wifi, Heating, TV, Carbon monoxide alarm. Lacking these (any) could significantly impact bookings.
- Popular amenities like Fire extinguisher, Hot water, Hair dryer are common but not universal. Offering these can provide a competitive edge.
Recommendations for Hosts
- Ensure your listing includes all essential amenities for Niagara-on-the-Lake: Air conditioning, Smoke alarm, Free parking on premises, Wifi, Heating, TV, Carbon monoxide alarm.
- Prioritize adding missing essentials: Air conditioning, Smoke alarm, Free parking on premises, Wifi, Heating, TV, Carbon monoxide alarm.
- Consider adding popular differentiators like Fire extinguisher or Hot water to increase appeal.
- Highlight unique or less common amenities you offer (e.g., hot tub, dedicated workspace, EV charger) in your listing description and photos.
- Regularly check competitor amenities in Niagara-on-the-Lake to stay competitive.
Niagara-on-the-Lake Airbnb Guest Demographics & Profile Analysis (2025)
Guest Profile Summary for Niagara-on-the-Lake
- The typical guest profile for Airbnb in Niagara-on-the-Lake consists of a mix of domestic (55%) and international guests, often arriving from nearby Toronto, typically belonging to the Post-2000s (Gen Z/Alpha) group (50%), primarily speaking English or French.
- Domestic travelers account for 55.2% of guests.
- Key international markets include Canada (55.2%) and United States (37.2%).
- Top languages spoken are English (68.6%) followed by French (10.4%).
- A significant demographic segment is the Post-2000s (Gen Z/Alpha) group, representing 50% of guests.
Recommendations for Hosts
- Balance marketing efforts between domestic and international channels based on the guest mix.
- Tailor amenities and listing descriptions to appeal to the dominant Post-2000s (Gen Z/Alpha) demographic (e.g., highlight fast WiFi, smart home features, local guides).
- Highlight unique local experiences or amenities relevant to the primary guest profile.
- Consider seasonal promotions aligned with peak travel times for key origin markets.
Nearby Short-Term Rental Market Comparison
How does the Niagara-on-the-Lake Airbnb market stack up against its neighbors? Compare key performance metrics like average monthly revenue, ADR, and occupancy rates in surrounding areas to understand the broader regional STR landscape.
| Market | Active Properties | Monthly Revenue | Daily Rate | Avg. Occupancy |
|---|---|---|---|---|
| Town of Mansfield | 58 | $4,670 | $517.93 | 32% |
| Town of West Seneca | 15 | $4,337 | $246.11 | 52% |
| Town of Porter | 25 | $4,243 | $300.26 | 55% |
| Town of Ellicottville | 201 | $3,840 | $380.95 | 36% |
| North East Township | 34 | $3,530 | $264.33 | 48% |
| Town of Elma | 10 | $3,377 | $418.28 | 48% |
| Town of Orchard Park | 38 | $3,302 | $252.95 | 46% |
| Tonawanda Town | 21 | $3,213 | $206.17 | 53% |
| Town of Wilson | 27 | $3,195 | $257.32 | 48% |
| Town of Stockton | 16 | $3,172 | $232.49 | 46% |