Niagara Falls Airbnb Market Analysis 2025: Short Term Rental Data & Vacation Rental Statistics in Ontario, Canada
Is Airbnb profitable in Niagara Falls in 2025? Explore comprehensive Airbnb analytics for Niagara Falls, Ontario, Canada to uncover income potential. This 2025 STR market report for Niagara Falls, based on AirROI data from April 2024 to March 2025, reveals key trends in the bustling market of 1,088 active listings.
Whether you're considering an Airbnb investment in Niagara Falls, optimizing your existing vacation rental, or exploring rental arbitrage opportunities, understanding the Niagara Falls Airbnb data is crucial. Leveraging the low regulation environment is key to maximizing your short term rental income potential. Let's dive into the specifics.
Key Niagara Falls Airbnb Performance Metrics Overview
Monthly Airbnb Revenue Variations & Income Potential in Niagara Falls (2025)
Understanding the monthly revenue variations for Airbnb listings in Niagara Falls is key to maximizing your short term rental income potential. Seasonality significantly impacts earnings. Our analysis, based on data from the past 12 months, shows that the peak revenue month for STRs in Niagara Falls is typically July, while February often presents the lowest earnings, highlighting opportunities for strategic pricing adjustments during shoulder and low seasons. Explore the typical Airbnb income in Niagara Falls across different performance tiers:
- Best-in-class properties (Top 10%) achieve $5,326+ monthly, often utilizing dynamic pricing and superior guest experiences.
- Strong performing properties (Top 25%) earn $3,364 or more, indicating effective management and desirable locations/amenities.
- Typical properties (Median) generate around $1,946 per month, representing the average market performance.
- Entry-level properties (Bottom 25%) see earnings around $935, often with potential for optimization.
Average Monthly Airbnb Earnings Trend in Niagara Falls
Niagara Falls Airbnb Occupancy Rate Trends (2025)
Maximize your bookings by understanding the Niagara Falls STR occupancy trends. Seasonal demand shifts significantly influence how often properties are booked. Typically, Julysees the highest demand (peak season occupancy), while February experiences the lowest (low season). Effective strategies, like adjusting minimum stays or offering promotions, can boost occupancy during slower periods. Here's how different property tiers perform in Niagara Falls:
- Best-in-class properties (Top 10%) achieve 77%+ occupancy, indicating high desirability and potentially optimized availability.
- Strong performing properties (Top 25%) maintain 61% or higher occupancy, suggesting good market fit and guest satisfaction.
- Typical properties (Median) have an occupancy rate around 40%.
- Entry-level properties (Bottom 25%) average 20% occupancy, potentially facing higher vacancy.
Average Monthly Occupancy Rate Trend in Niagara Falls
Average Daily Rate (ADR) Airbnb Trends in Niagara Falls (2025)
Effective short term rental pricing strategy in Niagara Falls involves understanding monthly ADR fluctuations. The Average Daily Rate (ADR) for Airbnb in Niagara Falls typically peaks in July and dips lowest during February. Leveraging Airbnb dynamic pricing tools or strategies based on this seasonality can significantly boost revenue. Here's a look at the typical nightly rates achieved:
- Best-in-class properties (Top 10%) command rates of $321+ per night, often due to premium features or locations.
- Strong performing properties (Top 25%) achieve nightly rates of $214 or more.
- Typical properties (Median) charge around $136 per night.
- Entry-level properties (Bottom 25%) earn around $91 per night.
Average Daily Rate (ADR) Trend by Month in Niagara Falls
Get Live Niagara Falls Market Intelligence 👇

Explore Real-time Analytics
Airbnb Seasonality Analysis & Trends in Niagara Falls (2025)
Peak Season (July, June, August)
- Revenue averages $4,050 per month
- Occupancy rates average 57.3%
- Daily rates average $198
Shoulder Season
- Revenue averages $2,381 per month
- Occupancy maintains around 39.1%
- Daily rates hold near $178
Low Season (January, February, March)
- Revenue drops to average $1,292 per month
- Occupancy decreases to average 31.0%
- Daily rates adjust to average $152
Seasonality Insights for Niagara Falls
- The Airbnb seasonality in Niagara Falls shows highly seasonal trends requiring careful strategy. While the sections above show seasonal averages, it's also insightful to look at the extremes:
- During the high season, the absolute peak month showcases Niagara Falls's highest earning potential, with monthly revenues capable of climbing to $4,141, occupancy reaching a high of 62.0%, and ADRs peaking at $201.
- Conversely, the slowest single month of the year, typically falling within the low season, marks the market's lowest point. In this month, revenue might dip to $1,110, occupancy could drop to 29.6%, and ADRs may adjust down to $149.
- Understanding both the seasonal averages and these monthly peaks and troughs in revenue, occupancy, and ADR is crucial for maximizing your Airbnb profit potential in Niagara Falls.
Seasonal Strategies for Maximizing Profit
- Peak Season: Maximize revenue through premium pricing and potentially longer minimum stays. Ensure high availability.
- Low Season: Offer competitive pricing, special promotions (e.g., extended stay discounts), and flexible cancellation policies. Target off-season travelers like remote workers or budget-conscious guests.
- Shoulder Seasons: Implement dynamic pricing that balances peak and low rates. Target weekend travelers or specific events. Offer slightly more flexible terms than peak season.
- Regularly analyze your own performance against these Niagara Falls seasonality benchmarks and adjust your pricing and availability strategy accordingly.
Best Areas for Airbnb Investment in Niagara Falls (2025)
Exploring the top neighborhoods for short-term rentals in Niagara Falls? This section highlights key areas, outlining why they are attractive for hosts and guests, along with notable local attractions. Consider these locations based on your target guest profile and investment strategy.
| Neighborhood / Area | Why Host Here? (Target Guests & Appeal) | Key Attractions & Landmarks |
|---|---|---|
| Downtown Niagara Falls | The bustling heart of Niagara Falls, attracting tourists with its proximity to the falls and entertainment options. Ideal for travelers seeking convenience and a vibrant atmosphere. | Niagara Falls, Clifton Hill, Niagara SkyWheel, Casino Niagara, Niagara Fallsview Casino Resort |
| Fallsview Boulevard | Offers stunning views of the falls and luxury accommodations, making it a prime location for romantic getaways and special occasions. | Horseshoe Falls, Journey Behind the Falls, Fallsview Casino Resort, Queen Victoria Park |
| Old Town Niagara-on-the-Lake | A charming historic area known for its wineries and quaint shops, appealing to visitors looking for a relaxed experience away from the hustle of the falls. | Lake Ontario, Shaw Festival Theatre, Niagara-on-the-Lake Heritage District, Wineries |
| Queenston Heights | Rich in history and nature, this area offers beautiful parks and access to hiking trails, attracting tourists who enjoy outdoor activities and local history. | Queenston Heights Park, Laura Secord Homestead, Niagara Parkway, Toronto Golf Club |
| Welland Canal | A unique area for those interested in maritime activities and ship watching, providing a different perspective of the Niagara region's natural beauty. | Welland Canal Discovery Centre, Lock 3, Marina Park |
| Niagara Region Wine Country | A sought-after destination for wine lovers, with many vineyards and wineries offering tours and tastings, appealing to those on culinary adventures. | Winery tours, Wine festivals, Vineyard views |
| Marineland | A family-friendly attraction with marine life shows and amusement rides, making it a popular spot for families traveling to see the falls. | Marineland amusement park, dolphin and sea lion shows |
| Chippawa | A quieter neighborhood that gives visitors access to natural beauty along the river, ideal for those seeking a relaxed atmosphere away from tourist crowds. | Chippawa Park, Niagara River, Heritage Trail |
Understanding Airbnb License Requirements & STR Laws in Niagara Falls (2025)
While Niagara Falls, Ontario, Canada currently shows low STR regulations, specific Airbnb license requirements might still exist or change. Always verify the latest short term rental regulations and Airbnb license requirements directly with local government authorities for Niagara Falls to ensure full compliance before hosting.
(Source: AirROI data, 2025, based on 0% licensed listings)
Top Performing Airbnb Properties in Niagara Falls (2025)
Benchmark your potential! Explore examples of top-performing Airbnb properties in Niagara Fallsbased on Trailing Twelve Month (TTM) revenue. Analyze their characteristics, revenue, occupancy rate, and ADR to understand what drives success in this market.
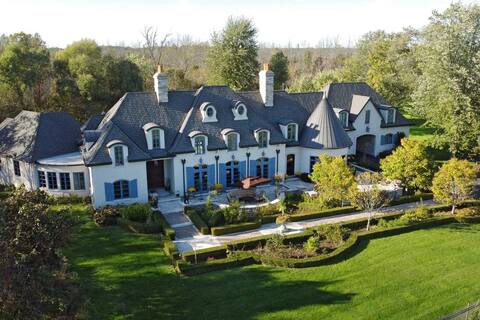
Rosehill Estate in Niagara Falls/ Waterfront view
Entire Place • 8 bedrooms
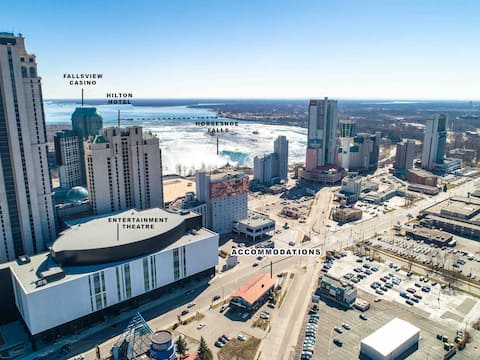
FALLS CLOSEST AIRBNB 20 GUESTS !
Entire Place • 3 bedrooms

La Dolce Vita Villa
Entire Place • 5 bedrooms
Victoria Vacation Home - Closest to The Falls
Entire Place • 7 bedrooms
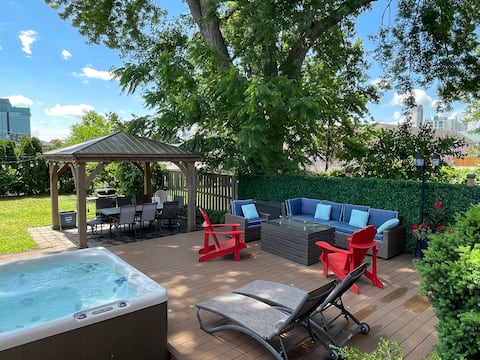
Luxury Custom Home with Hot Tub
Entire Place • 4 bedrooms
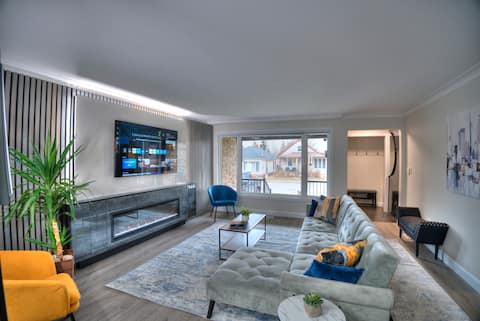
Free Parking| Walk to Falls&Clifton Hill | Fits 13
Entire Place • 3 bedrooms
Note: Performance varies based on location, size, amenities, seasonality, and management quality. Data reflects the past 12 months.
Top Performing Airbnb Hosts in Niagara Falls (2025)
Learn from the best! This table showcases top-performing Airbnb hosts in Niagara Falls based on the number of properties managed and estimated total revenue over the past year. Analyze their scale and performance metrics.
| Host Name | Properties | Grossing Revenue | Stay Reviews | Avg Rating |
|---|---|---|---|---|
| Niagara Grandview | 15 | $491,896 | 116 | 2.91/5.0 |
| Jonathan | 8 | $468,609 | 900 | 4.87/5.0 |
| Dan | 8 | $463,143 | 494 | 4.19/5.0 |
| Legends | 6 | $338,402 | 239 | 4.94/5.0 |
| Di | 5 | $307,001 | 362 | 4.54/5.0 |
| John | 7 | $303,269 | 183 | 4.61/5.0 |
| Alexandra | 4 | $274,827 | 293 | 4.85/5.0 |
| Frankie | 4 | $219,269 | 278 | 4.84/5.0 |
| Sarah | 4 | $215,523 | 2662 | 4.78/5.0 |
| Emily | 4 | $205,535 | 171 | 3.69/5.0 |
Analyzing the strategies of top hosts, such as their property selection, pricing, and guest communication, can offer valuable lessons for optimizing your own Airbnb operations in Niagara Falls.
Dive Deeper: Advanced Niagara Falls STR Market Data (2025)
Ready to unlock more insights? AirROI provides access to advanced metrics and comprehensive Airbnb data for Niagara Falls. Explore detailed analytics beyond this report to refine your investment strategy, optimize pricing, and maximize your vacation rental profits.
Explore Advanced MetricsNiagara Falls Short-Term Rental Market Composition (2025): Property & Room Types
Room Type Distribution
Property Type Distribution
Market Composition Insights for Niagara Falls
- The Niagara Falls Airbnb market composition is heavily skewed towards Entire Home/Apt listings, which make up 78.2% of the 1,088 active rentals. This indicates strong guest preference for privacy and space.
- Looking at the property type distribution in Niagara Falls, House properties are the most common (56.5%), reflecting the local real estate landscape.
- Houses represent a significant 56.5% portion, catering likely to families or larger groups.
- The presence of 9.3% Hotel/Boutique listings indicates integration with traditional hospitality.
- Smaller segments like unique stays, outdoor/unique (combined 2.2%) offer potential for unique stay experiences.
Niagara Falls Airbnb Room Capacity Analysis (2025): Bedroom Distribution
Distribution of Listings by Number of Bedrooms
Room Capacity Insights for Niagara Falls
- The dominant room capacity in Niagara Falls is 1 bedroom listings, making up 28.3% of the market. This suggests a strong demand for properties suitable for couples or solo travelers.
- Together, 1 bedroom and 2 bedrooms properties represent 50.5% of the active Airbnb listings in Niagara Falls, indicating a high concentration in these sizes.
- A significant 38.0% of listings offer 3+ bedrooms, catering to larger groups and families seeking more space in Niagara Falls.
Niagara Falls Vacation Rental Guest Capacity Trends (2025)
Distribution of Listings by Guest Capacity
Guest Capacity Insights for Niagara Falls
- The most common guest capacity trend in Niagara Falls vacation rentals is listings accommodating 8+ guests (24.1%). This suggests the primary traveler segment is likely larger groups.
- Properties designed for 8+ guests and 4 guests dominate the Niagara Falls STR market, accounting for 44.5% of listings.
- 44.0% of properties accommodate 6+ guests, serving the market segment for larger families or group travel in Niagara Falls.
- On average, properties in Niagara Falls are equipped to host 4.6 guests.
Niagara Falls Airbnb Booking Patterns (2025): Available vs. Booked Days
Available Days Distribution
Booked Days Distribution
Booking Pattern Insights for Niagara Falls
- The most common availability pattern in Niagara Falls falls within the 271-366 days range, representing 36.9% of listings. This suggests many properties have significant open periods on their calendars.
- Approximately 71.2% of listings show high availability (181+ days open annually), indicating potential for increased bookings or specific owner usage patterns.
- For booked days, the 91-180 days range is most frequent in Niagara Falls (35.9%), reflecting common guest stay durations or potential owner blocking patterns.
- A notable 29.5% of properties secure long booking periods (181+ days booked per year), highlighting successful long-term rental strategies or significant owner usage.
Niagara Falls Airbnb Minimum Stay Requirements Analysis
Distribution of Listings by Minimum Night Requirement
1 Night
542 listings
59.6% of total
2 Nights
208 listings
22.9% of total
3 Nights
10 listings
1.1% of total
4-6 Nights
10 listings
1.1% of total
7-29 Nights
62 listings
6.8% of total
30+ Nights
77 listings
8.5% of total
Key Insights
- The most prevalent minimum stay requirement in Niagara Falls is 1 Night, adopted by 59.6% of listings. This highlights the market's preference for shorter, flexible bookings.
- A strong majority (82.5%) of the Niagara Falls Airbnb data shows acceptance of very short stays (1-2 nights), indicating a dynamic, high-turnover market.
Recommendations
- Align with the market by considering a 1 Night minimum stay, as 59.6% of Niagara Falls hosts use this setting.
- Explore offering discounts for stays of 30+ nights to attract the 8.5% of the market seeking extended stays.
- Adjust minimum nights based on seasonality – potentially shorter during low season and longer during peak demand periods in Niagara Falls.
Niagara Falls Airbnb Cancellation Policy Trends Analysis (2025)
Super Strict 30 Days
3 listings
0.3% of total
Limited
1 listings
0.1% of total
Flexible
143 listings
16.1% of total
Moderate
363 listings
40.8% of total
Firm
143 listings
16.1% of total
Strict
236 listings
26.5% of total
Cancellation Policy Insights for Niagara Falls
- The prevailing Airbnb cancellation policy trend in Niagara Falls is Moderate, used by 40.8% of listings.
- There's a relatively balanced mix between guest-friendly (56.9%) and stricter (42.6%) policies, offering choices for different guest needs.
Recommendations for Hosts
- Consider adopting a Moderate policy to align with the 40.8% market standard in Niagara Falls.
- Regularly review your cancellation policy against competitors and market demand shifts in Niagara Falls.
Niagara Falls STR Booking Lead Time Analysis (2025)
Average Booking Lead Time by Month
Booking Lead Time Insights for Niagara Falls
- The overall average booking lead time for vacation rentals in Niagara Falls is 38 days.
- Guests book furthest in advance for stays during April (average 80 days), likely coinciding with peak travel demand or local events.
- The shortest booking windows occur for stays in March (average 28 days), indicating more last-minute travel plans during this time.
- Seasonally, Summer (57 days avg.) sees the longest lead times, while Winter (29 days avg.) has the shortest, reflecting typical travel planning cycles.
Recommendations for Hosts
- Use the overall average lead time (38 days) as a baseline for your pricing and availability strategy in Niagara Falls.
- For April stays, consider implementing length-of-stay discounts or slightly higher rates for bookings made less than 80 days out to capitalize on advance planning.
- Target marketing efforts for the Summer season well in advance (at least 57 days) to capture early planners.
- Monitor your own booking lead times against these Niagara Falls averages to identify opportunities for dynamic pricing adjustments.
Popular & Essential Airbnb Amenities in Niagara Falls (2025)
Amenity Prevalence
Amenity Insights for Niagara Falls
- Essential amenities in Niagara Falls that guests expect include: Wifi, Smoke alarm, Air conditioning, Free parking on premises, Heating, Carbon monoxide alarm, Hot water. Lacking these (any) could significantly impact bookings.
- Popular amenities like TV, Essentials, Kitchen are common but not universal. Offering these can provide a competitive edge.
Recommendations for Hosts
- Ensure your listing includes all essential amenities for Niagara Falls: Wifi, Smoke alarm, Air conditioning, Free parking on premises, Heating, Carbon monoxide alarm, Hot water.
- Prioritize adding missing essentials: Wifi, Smoke alarm, Air conditioning, Free parking on premises, Heating, Carbon monoxide alarm, Hot water.
- Consider adding popular differentiators like TV or Essentials to increase appeal.
- Highlight unique or less common amenities you offer (e.g., hot tub, dedicated workspace, EV charger) in your listing description and photos.
- Regularly check competitor amenities in Niagara Falls to stay competitive.
Niagara Falls Airbnb Guest Demographics & Profile Analysis (2025)
Guest Profile Summary for Niagara Falls
- The typical guest profile for Airbnb in Niagara Falls consists of a mix of domestic (46%) and international guests, with top international origins including United States, typically belonging to the Post-2000s (Gen Z/Alpha) group (50%), primarily speaking English or Spanish.
- Domestic travelers account for 45.7% of guests.
- Key international markets include Canada (45.7%) and United States (43.8%).
- Top languages spoken are English (60.3%) followed by Spanish (9.1%).
- A significant demographic segment is the Post-2000s (Gen Z/Alpha) group, representing 50% of guests.
Recommendations for Hosts
- Balance marketing efforts between domestic and international channels based on the guest mix.
- Tailor amenities and listing descriptions to appeal to the dominant Post-2000s (Gen Z/Alpha) demographic (e.g., highlight fast WiFi, smart home features, local guides).
- Highlight unique local experiences or amenities relevant to the primary guest profile.
- Consider seasonal promotions aligned with peak travel times for key origin markets.
Nearby Short-Term Rental Market Comparison
How does the Niagara Falls Airbnb market stack up against its neighbors? Compare key performance metrics like average monthly revenue, ADR, and occupancy rates in surrounding areas to understand the broader regional STR landscape.
| Market | Active Properties | Monthly Revenue | Daily Rate | Avg. Occupancy |
|---|---|---|---|---|
| Town of Mansfield | 58 | $4,670 | $517.93 | 32% |
| Town of West Seneca | 15 | $4,337 | $246.11 | 52% |
| Town of Porter | 25 | $4,243 | $300.26 | 55% |
| Town of Ellicottville | 201 | $3,840 | $380.95 | 36% |
| North East Township | 34 | $3,530 | $264.33 | 48% |
| Town of Elma | 10 | $3,377 | $418.28 | 48% |
| Niagara-on-the-Lake | 413 | $3,358 | $265.20 | 44% |
| Town of Orchard Park | 38 | $3,302 | $252.95 | 46% |
| Tonawanda Town | 21 | $3,213 | $206.17 | 53% |
| Town of Wilson | 27 | $3,195 | $257.32 | 48% |