Mulmur Airbnb Market Analysis 2025: Short Term Rental Data & Vacation Rental Statistics in Ontario, Canada
Is Airbnb profitable in Mulmur in 2025? Explore comprehensive Airbnb analytics for Mulmur, Ontario, Canada to uncover income potential. This 2025 STR market report for Mulmur, based on AirROI data from April 2024 to March 2025, reveals key trends in the niche market of 43 active listings.
Whether you're considering an Airbnb investment in Mulmur, optimizing your existing vacation rental, or exploring rental arbitrage opportunities, understanding the Mulmur Airbnb data is crucial. Leveraging the low regulation environment is key to maximizing your short term rental income potential. Let's dive into the specifics.
Key Mulmur Airbnb Performance Metrics Overview
Monthly Airbnb Revenue Variations & Income Potential in Mulmur (2025)
Understanding the monthly revenue variations for Airbnb listings in Mulmur is key to maximizing your short term rental income potential. Seasonality significantly impacts earnings. Our analysis, based on data from the past 12 months, shows that the peak revenue month for STRs in Mulmur is typically August, while March often presents the lowest earnings, highlighting opportunities for strategic pricing adjustments during shoulder and low seasons. Explore the typical Airbnb income in Mulmur across different performance tiers:
- Best-in-class properties (Top 10%) achieve $7,789+ monthly, often utilizing dynamic pricing and superior guest experiences.
- Strong performing properties (Top 25%) earn $3,934 or more, indicating effective management and desirable locations/amenities.
- Typical properties (Median) generate around $2,142 per month, representing the average market performance.
- Entry-level properties (Bottom 25%) see earnings around $960, often with potential for optimization.
Average Monthly Airbnb Earnings Trend in Mulmur
Mulmur Airbnb Occupancy Rate Trends (2025)
Maximize your bookings by understanding the Mulmur STR occupancy trends. Seasonal demand shifts significantly influence how often properties are booked. Typically, Augustsees the highest demand (peak season occupancy), while March experiences the lowest (low season). Effective strategies, like adjusting minimum stays or offering promotions, can boost occupancy during slower periods. Here's how different property tiers perform in Mulmur:
- Best-in-class properties (Top 10%) achieve 78%+ occupancy, indicating high desirability and potentially optimized availability.
- Strong performing properties (Top 25%) maintain 61% or higher occupancy, suggesting good market fit and guest satisfaction.
- Typical properties (Median) have an occupancy rate around 37%.
- Entry-level properties (Bottom 25%) average 16% occupancy, potentially facing higher vacancy.
Average Monthly Occupancy Rate Trend in Mulmur
Average Daily Rate (ADR) Airbnb Trends in Mulmur (2025)
Effective short term rental pricing strategy in Mulmur involves understanding monthly ADR fluctuations. The Average Daily Rate (ADR) for Airbnb in Mulmur typically peaks in January and dips lowest during October. Leveraging Airbnb dynamic pricing tools or strategies based on this seasonality can significantly boost revenue. Here's a look at the typical nightly rates achieved:
- Best-in-class properties (Top 10%) command rates of $475+ per night, often due to premium features or locations.
- Strong performing properties (Top 25%) achieve nightly rates of $267 or more.
- Typical properties (Median) charge around $156 per night.
- Entry-level properties (Bottom 25%) earn around $110 per night.
Average Daily Rate (ADR) Trend by Month in Mulmur
Get Live Mulmur Market Intelligence 👇

Explore Real-time Analytics
Airbnb Seasonality Analysis & Trends in Mulmur (2025)
Peak Season (August, July, January)
- Revenue averages $5,259 per month
- Occupancy rates average 47.5%
- Daily rates average $267
Shoulder Season
- Revenue averages $3,582 per month
- Occupancy maintains around 39.9%
- Daily rates hold near $242
Low Season (March, November, December)
- Revenue drops to average $2,503 per month
- Occupancy decreases to average 34.1%
- Daily rates adjust to average $247
Seasonality Insights for Mulmur
- The Airbnb seasonality in Mulmur shows highly seasonal trends requiring careful strategy. While the sections above show seasonal averages, it's also insightful to look at the extremes:
- During the high season, the absolute peak month showcases Mulmur's highest earning potential, with monthly revenues capable of climbing to $5,955, occupancy reaching a high of 58.8%, and ADRs peaking at $308.
- Conversely, the slowest single month of the year, typically falling within the low season, marks the market's lowest point. In this month, revenue might dip to $1,804, occupancy could drop to 25.4%, and ADRs may adjust down to $234.
- Understanding both the seasonal averages and these monthly peaks and troughs in revenue, occupancy, and ADR is crucial for maximizing your Airbnb profit potential in Mulmur.
Seasonal Strategies for Maximizing Profit
- Peak Season: Maximize revenue through premium pricing and potentially longer minimum stays. Ensure high availability.
- Low Season: Offer competitive pricing, special promotions (e.g., extended stay discounts), and flexible cancellation policies. Target off-season travelers like remote workers or budget-conscious guests.
- Shoulder Seasons: Implement dynamic pricing that balances peak and low rates. Target weekend travelers or specific events. Offer slightly more flexible terms than peak season.
- Regularly analyze your own performance against these Mulmur seasonality benchmarks and adjust your pricing and availability strategy accordingly.
Best Areas for Airbnb Investment in Mulmur (2025)
Exploring the top neighborhoods for short-term rentals in Mulmur? This section highlights key areas, outlining why they are attractive for hosts and guests, along with notable local attractions. Consider these locations based on your target guest profile and investment strategy.
| Neighborhood / Area | Why Host Here? (Target Guests & Appeal) | Key Attractions & Landmarks |
|---|---|---|
| Hockley Valley | A popular destination for outdoor activities such as skiing in the winter and hiking in the summer. Its picturesque landscape attracts nature lovers and adventure seekers. | Hockley Valley Resort, Hockley Valley Provincial Park, Local vineyards, Golf courses, Scenic hiking trails |
| Shelburne | A charming small town that offers a quaint atmosphere with local shops and community events. It's becoming a popular spot for families and those looking for a peaceful getaway. | Shelburne Farmer's Market, Tim Hortons Museum, Sugarbush Maple Farm, Local parks, Historic buildings |
| Mono Cliffs Provincial Park | Known for its stunning landscapes and hiking trails, it's a perfect spot for nature enthusiasts and those looking to escape to the great outdoors. | Mono Cliffs trails, Lookout points, Picnic areas, Natural beauty, Wildlife viewing |
| Orangeville | A vibrant town with a strong arts presence, shopping, and dining options. Ideal for visitors looking for a mix of cultural experiences and urban convenience. | Orangeville Mall, Theatre Orangeville, Local art galleries, Island Lake Conservation Area, Downtown shopping |
| Lake Belwood | A serene area popular for water activities like kayaking and fishing. Attracts families and individuals looking for a lakeside retreat. | Belwood Lake, Canoeing, Fishing, Picnic spots, Lakeside trails |
| Grand Valley | A quiet village atmosphere with nearby natural attractions making it a perfect escape for those looking to slow down and enjoy the countryside. | Grand River, Local parks, Scenic countryside, Community events, Biking trails |
| Melancthon | Known for its rolling hills and agricultural landscape. Offers a rural experience with wineries and farm tours, attracting those looking for tranquility. | Local wineries, Farm tours, Scenic viewpoints, Biking routes, Nature walks |
| Dufferin County Forest | An expansive area offering a vast network of trails for enthusiasts of hiking, biking, and nature exploration. Perfect for those who love outdoor activities. | Hiking trails, Biking paths, Nature walks, Wildflower viewing, Bird watching |
Understanding Airbnb License Requirements & STR Laws in Mulmur (2025)
While Mulmur, Ontario, Canada currently shows low STR regulations, specific Airbnb license requirements might still exist or change. Always verify the latest short term rental regulations and Airbnb license requirements directly with local government authorities for Mulmur to ensure full compliance before hosting.
(Source: AirROI data, 2025, finding no licensed listings among those analyzed)
Top Performing Airbnb Properties in Mulmur (2025)
Benchmark your potential! Explore examples of top-performing Airbnb properties in Mulmurbased on Trailing Twelve Month (TTM) revenue. Analyze their characteristics, revenue, occupancy rate, and ADR to understand what drives success in this market.
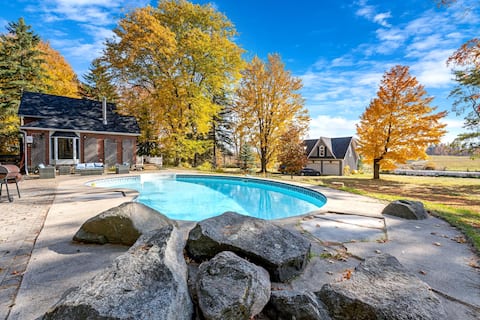
Hidden Oasis: Pool, Hot Tubs, & Starry Fire Pits
Entire Place • 4 bedrooms

Into the Woods Log Home
Entire Place • 5 bedrooms
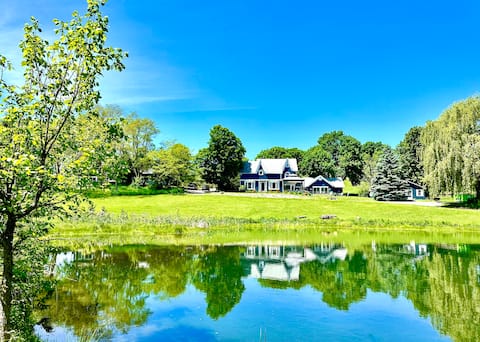
HeavenOn5th*9 bedrooms*hot tub*pool*pond & views
Entire Place • 9 bedrooms

Spacious Getaway w/ Swiming Pool & hot tub
Entire Place • 4 bedrooms

Sunnylea Acres
Entire Place • 4 bedrooms

Country Oasis - 5 private acres with hot tub
Entire Place • 3 bedrooms
Note: Performance varies based on location, size, amenities, seasonality, and management quality. Data reflects the past 12 months.
Top Performing Airbnb Hosts in Mulmur (2025)
Learn from the best! This table showcases top-performing Airbnb hosts in Mulmur based on the number of properties managed and estimated total revenue over the past year. Analyze their scale and performance metrics.
| Host Name | Properties | Grossing Revenue | Stay Reviews | Avg Rating |
|---|---|---|---|---|
| Yingtian | 1 | $213,958 | 22 | 4.86/5.0 |
| M. Kinneret | 1 | $153,009 | 40 | 5.00/5.0 |
| Shannon | 1 | $108,421 | 14 | 5.00/5.0 |
| Kaitlin | 2 | $96,805 | 73 | 4.96/5.0 |
| Dalene | 2 | $78,823 | 283 | 4.93/5.0 |
| Rahim | 1 | $72,754 | 53 | 4.75/5.0 |
| Jennifer | 1 | $61,508 | 35 | 5.00/5.0 |
| Emily | 1 | $58,544 | 15 | 4.40/5.0 |
| Michelle | 2 | $56,941 | 58 | 5.00/5.0 |
| Mike And Michelle | 3 | $48,820 | 303 | 4.96/5.0 |
Analyzing the strategies of top hosts, such as their property selection, pricing, and guest communication, can offer valuable lessons for optimizing your own Airbnb operations in Mulmur.
Dive Deeper: Advanced Mulmur STR Market Data (2025)
Ready to unlock more insights? AirROI provides access to advanced metrics and comprehensive Airbnb data for Mulmur. Explore detailed analytics beyond this report to refine your investment strategy, optimize pricing, and maximize your vacation rental profits.
Explore Advanced MetricsMulmur Short-Term Rental Market Composition (2025): Property & Room Types
Room Type Distribution
Property Type Distribution
Market Composition Insights for Mulmur
- The Mulmur Airbnb market composition is heavily skewed towards Entire Home/Apt listings, which make up 83.7% of the 43 active rentals. This indicates strong guest preference for privacy and space.
- Looking at the property type distribution in Mulmur, House properties are the most common (62.8%), reflecting the local real estate landscape.
- Houses represent a significant 62.8% portion, catering likely to families or larger groups.
- The presence of 14% Hotel/Boutique listings indicates integration with traditional hospitality.
- Smaller segments like others, apartment/condo (combined 4.6%) offer potential for unique stay experiences.
Mulmur Airbnb Room Capacity Analysis (2025): Bedroom Distribution
Distribution of Listings by Number of Bedrooms
Room Capacity Insights for Mulmur
- The dominant room capacity in Mulmur is 1 bedroom listings, making up 34.9% of the market. This suggests a strong demand for properties suitable for couples or solo travelers.
- Together, 1 bedroom and 2 bedrooms properties represent 51.2% of the active Airbnb listings in Mulmur, indicating a high concentration in these sizes.
- A significant 39.6% of listings offer 3+ bedrooms, catering to larger groups and families seeking more space in Mulmur.
Mulmur Vacation Rental Guest Capacity Trends (2025)
Distribution of Listings by Guest Capacity
Guest Capacity Insights for Mulmur
- The most common guest capacity trend in Mulmur vacation rentals is listings accommodating 8+ guests (37.2%). This suggests the primary traveler segment is likely larger groups.
- Properties designed for 8+ guests and 4 guests dominate the Mulmur STR market, accounting for 60.5% of listings.
- 46.5% of properties accommodate 6+ guests, serving the market segment for larger families or group travel in Mulmur.
- On average, properties in Mulmur are equipped to host 5.0 guests.
Mulmur Airbnb Booking Patterns (2025): Available vs. Booked Days
Available Days Distribution
Booked Days Distribution
Booking Pattern Insights for Mulmur
- The most common availability pattern in Mulmur falls within the 181-270 days range, representing 44.2% of listings. This suggests many properties have significant open periods on their calendars.
- Approximately 79.1% of listings show high availability (181+ days open annually), indicating potential for increased bookings or specific owner usage patterns.
- For booked days, the 91-180 days range is most frequent in Mulmur (46.5%), reflecting common guest stay durations or potential owner blocking patterns.
- A notable 20.9% of properties secure long booking periods (181+ days booked per year), highlighting successful long-term rental strategies or significant owner usage.
Mulmur Airbnb Minimum Stay Requirements Analysis
Distribution of Listings by Minimum Night Requirement
1 Night
12 listings
30% of total
2 Nights
22 listings
55% of total
3 Nights
3 listings
7.5% of total
7-29 Nights
1 listings
2.5% of total
30+ Nights
2 listings
5% of total
Key Insights
- The most prevalent minimum stay requirement in Mulmur is 2 Nights, adopted by 55% of listings. This highlights the market's preference for shorter, flexible bookings.
- A strong majority (85.0%) of the Mulmur Airbnb data shows acceptance of very short stays (1-2 nights), indicating a dynamic, high-turnover market.
Recommendations
- Align with the market by considering a 2 Nights minimum stay, as 55% of Mulmur hosts use this setting.
- Adjust minimum nights based on seasonality – potentially shorter during low season and longer during peak demand periods in Mulmur.
Mulmur Airbnb Cancellation Policy Trends Analysis (2025)
Flexible
8 listings
20.5% of total
Moderate
14 listings
35.9% of total
Firm
4 listings
10.3% of total
Strict
13 listings
33.3% of total
Cancellation Policy Insights for Mulmur
- The prevailing Airbnb cancellation policy trend in Mulmur is Moderate, used by 35.9% of listings.
- There's a relatively balanced mix between guest-friendly (56.4%) and stricter (43.6%) policies, offering choices for different guest needs.
Recommendations for Hosts
- Consider adopting a Moderate policy to align with the 35.9% market standard in Mulmur.
- With 33.3% using Strict terms, this is a viable option in Mulmur, particularly for high-value properties or during peak demand periods.
- Regularly review your cancellation policy against competitors and market demand shifts in Mulmur.
Mulmur STR Booking Lead Time Analysis (2025)
Average Booking Lead Time by Month
Booking Lead Time Insights for Mulmur
- The overall average booking lead time for vacation rentals in Mulmur is 54 days.
- Guests book furthest in advance for stays during June (average 72 days), likely coinciding with peak travel demand or local events.
- The shortest booking windows occur for stays in March (average 32 days), indicating more last-minute travel plans during this time.
- Seasonally, Winter (60 days avg.) sees the longest lead times, while Fall (44 days avg.) has the shortest, reflecting typical travel planning cycles.
Recommendations for Hosts
- Use the overall average lead time (54 days) as a baseline for your pricing and availability strategy in Mulmur.
- For June stays, consider implementing length-of-stay discounts or slightly higher rates for bookings made less than 72 days out to capitalize on advance planning.
- Target marketing efforts for the Winter season well in advance (at least 60 days) to capture early planners.
- Monitor your own booking lead times against these Mulmur averages to identify opportunities for dynamic pricing adjustments.
Popular & Essential Airbnb Amenities in Mulmur (2025)
Amenity Prevalence
Amenity Insights for Mulmur
- Essential amenities in Mulmur that guests expect include: Heating, Free parking on premises, Smoke alarm. Lacking these (any) could significantly impact bookings.
- Popular amenities like Carbon monoxide alarm, Backyard, Fire extinguisher are common but not universal. Offering these can provide a competitive edge.
Recommendations for Hosts
- Ensure your listing includes all essential amenities for Mulmur: Heating, Free parking on premises, Smoke alarm.
- Prioritize adding missing essentials: Heating, Free parking on premises, Smoke alarm.
- Consider adding popular differentiators like Carbon monoxide alarm or Backyard to increase appeal.
- Highlight unique or less common amenities you offer (e.g., hot tub, dedicated workspace, EV charger) in your listing description and photos.
- Regularly check competitor amenities in Mulmur to stay competitive.
Mulmur Airbnb Guest Demographics & Profile Analysis (2025)
Guest Profile Summary for Mulmur
- The typical guest profile for Airbnb in Mulmur consists of primarily domestic travelers (92%), often arriving from nearby Toronto, typically belonging to the Post-2000s (Gen Z/Alpha) group (50%), primarily speaking English or French.
- Domestic travelers account for 92.0% of guests.
- Key international markets include Canada (92%) and United States (4.5%).
- Top languages spoken are English (60.3%) followed by French (12%).
- A significant demographic segment is the Post-2000s (Gen Z/Alpha) group, representing 50% of guests.
Recommendations for Hosts
- Target domestic marketing efforts towards travelers from Toronto and Mississauga.
- Tailor amenities and listing descriptions to appeal to the dominant Post-2000s (Gen Z/Alpha) demographic (e.g., highlight fast WiFi, smart home features, local guides).
- Highlight unique local experiences or amenities relevant to the primary guest profile.
- Consider seasonal promotions aligned with peak travel times for key origin markets.
Nearby Short-Term Rental Market Comparison
How does the Mulmur Airbnb market stack up against its neighbors? Compare key performance metrics like average monthly revenue, ADR, and occupancy rates in surrounding areas to understand the broader regional STR landscape.
| Market | Active Properties | Monthly Revenue | Daily Rate | Avg. Occupancy |
|---|---|---|---|---|
| McMurrich/Monteith Township | 26 | $3,922 | $372.53 | 42% |
| South River | 10 | $3,752 | $259.89 | 45% |
| Niagara-on-the-Lake | 413 | $3,358 | $265.20 | 44% |
| Muskoka Lakes Township | 376 | $3,060 | $435.47 | 38% |
| McKellar Township | 39 | $2,980 | $368.05 | 40% |
| Huntsville | 305 | $2,978 | $273.77 | 43% |
| Kearney | 59 | $2,897 | $263.86 | 44% |
| Bracebridge | 207 | $2,862 | $321.96 | 40% |
| Perry Township | 61 | $2,845 | $282.82 | 43% |
| Severn | 154 | $2,845 | $306.35 | 39% |