Mississauga Airbnb Market Analysis 2025: Short Term Rental Data & Vacation Rental Statistics in Ontario, Canada
Is Airbnb profitable in Mississauga in 2025? Explore comprehensive Airbnb analytics for Mississauga, Ontario, Canada to uncover income potential. This 2025 STR market report for Mississauga, based on AirROI data from April 2024 to March 2025, reveals key trends in the bustling market of 1,545 active listings.
Whether you're considering an Airbnb investment in Mississauga, optimizing your existing vacation rental, or exploring rental arbitrage opportunities, understanding the Mississauga Airbnb data is crucial. Understanding the local regulations is key to maximizing your short term rental income potential. Let's dive into the specifics.
Key Mississauga Airbnb Performance Metrics Overview
Monthly Airbnb Revenue Variations & Income Potential in Mississauga (2025)
Understanding the monthly revenue variations for Airbnb listings in Mississauga is key to maximizing your short term rental income potential. Seasonality significantly impacts earnings. Our analysis, based on data from the past 12 months, shows that the peak revenue month for STRs in Mississauga is typically June, while March often presents the lowest earnings, highlighting opportunities for strategic pricing adjustments during shoulder and low seasons. Explore the typical Airbnb income in Mississauga across different performance tiers:
- Best-in-class properties (Top 10%) achieve $3,946+ monthly, often utilizing dynamic pricing and superior guest experiences.
- Strong performing properties (Top 25%) earn $2,388 or more, indicating effective management and desirable locations/amenities.
- Typical properties (Median) generate around $1,286 per month, representing the average market performance.
- Entry-level properties (Bottom 25%) see earnings around $663, often with potential for optimization.
Average Monthly Airbnb Earnings Trend in Mississauga
Mississauga Airbnb Occupancy Rate Trends (2025)
Maximize your bookings by understanding the Mississauga STR occupancy trends. Seasonal demand shifts significantly influence how often properties are booked. Typically, Augustsees the highest demand (peak season occupancy), while March experiences the lowest (low season). Effective strategies, like adjusting minimum stays or offering promotions, can boost occupancy during slower periods. Here's how different property tiers perform in Mississauga:
- Best-in-class properties (Top 10%) achieve 86%+ occupancy, indicating high desirability and potentially optimized availability.
- Strong performing properties (Top 25%) maintain 72% or higher occupancy, suggesting good market fit and guest satisfaction.
- Typical properties (Median) have an occupancy rate around 48%.
- Entry-level properties (Bottom 25%) average 24% occupancy, potentially facing higher vacancy.
Average Monthly Occupancy Rate Trend in Mississauga
Average Daily Rate (ADR) Airbnb Trends in Mississauga (2025)
Effective short term rental pricing strategy in Mississauga involves understanding monthly ADR fluctuations. The Average Daily Rate (ADR) for Airbnb in Mississauga typically peaks in July and dips lowest during February. Leveraging Airbnb dynamic pricing tools or strategies based on this seasonality can significantly boost revenue. Here's a look at the typical nightly rates achieved:
- Best-in-class properties (Top 10%) command rates of $196+ per night, often due to premium features or locations.
- Strong performing properties (Top 25%) achieve nightly rates of $124 or more.
- Typical properties (Median) charge around $78 per night.
- Entry-level properties (Bottom 25%) earn around $47 per night.
Average Daily Rate (ADR) Trend by Month in Mississauga
Get Live Mississauga Market Intelligence 👇

Explore Real-time Analytics
Airbnb Seasonality Analysis & Trends in Mississauga (2025)
Peak Season (June, May, July)
- Revenue averages $2,411 per month
- Occupancy rates average 52.5%
- Daily rates average $112
Shoulder Season
- Revenue averages $1,855 per month
- Occupancy maintains around 51.2%
- Daily rates hold near $107
Low Season (January, February, March)
- Revenue drops to average $1,096 per month
- Occupancy decreases to average 39.3%
- Daily rates adjust to average $91
Seasonality Insights for Mississauga
- The Airbnb seasonality in Mississauga shows highly seasonal trends requiring careful strategy. While the sections above show seasonal averages, it's also insightful to look at the extremes:
- During the high season, the absolute peak month showcases Mississauga's highest earning potential, with monthly revenues capable of climbing to $2,478, occupancy reaching a high of 61.1%, and ADRs peaking at $114.
- Conversely, the slowest single month of the year, typically falling within the low season, marks the market's lowest point. In this month, revenue might dip to $1,044, occupancy could drop to 37.3%, and ADRs may adjust down to $90.
- Understanding both the seasonal averages and these monthly peaks and troughs in revenue, occupancy, and ADR is crucial for maximizing your Airbnb profit potential in Mississauga.
Seasonal Strategies for Maximizing Profit
- Peak Season: Maximize revenue through premium pricing and potentially longer minimum stays. Ensure high availability.
- Low Season: Offer competitive pricing, special promotions (e.g., extended stay discounts), and flexible cancellation policies. Target off-season travelers like remote workers or budget-conscious guests.
- Shoulder Seasons: Implement dynamic pricing that balances peak and low rates. Target weekend travelers or specific events. Offer slightly more flexible terms than peak season.
- Regularly analyze your own performance against these Mississauga seasonality benchmarks and adjust your pricing and availability strategy accordingly.
Best Areas for Airbnb Investment in Mississauga (2025)
Exploring the top neighborhoods for short-term rentals in Mississauga? This section highlights key areas, outlining why they are attractive for hosts and guests, along with notable local attractions. Consider these locations based on your target guest profile and investment strategy.
| Neighborhood / Area | Why Host Here? (Target Guests & Appeal) | Key Attractions & Landmarks |
|---|---|---|
| Port Credit | Charming lakeside community known for its scenic waterfront and vibrant village atmosphere. Ideal for tourists looking to enjoy nature, local shops, and dining. | Credit River, Port Credit Marina, J.C. Saddington Park, Lakefront Promenade Park, Restaurants and cafes along Lakeshore |
| Downtown Mississauga | The bustling urban center of Mississauga with a mix of residential, commercial, and entertainment options. Great for business travelers and tourists visiting the area. | Square One Shopping Centre, Living Arts Centre, Mississauga Celebration Square, Art Gallery of Mississauga, Public transit access |
| Erin Mills | Family-friendly neighborhood with parks, schools, and shopping, making it attractive for families and longer stays. Close proximity to nature trails and parks. | Erin Mills Town Centre, Credit Valley Hospital, Civic Centre Park, University of Toronto Mississauga, Nature trails and parks |
| Streetsville | Historic village known for its quaint atmosphere and local shops. This area appeals to visitors looking for a charming experience with a small-town feel. | Streetsville Village Square, Credit River, Local restaurants and cafes, Streetsville Historical Society, Festivals and events throughout the year |
| Lorne Park | Affluent neighborhood featuring upscale homes and expansive parks. Appeals to wealthy travelers and those looking for a quieter stay close to nature. | Lorne Park Trail, Rattray Marsh Conservation Area, Lorne Park Marina, Private schools and country clubs, Nearby waterfront access |
| Mississauga Valleys | Affordable area with a mix of housing types and close proximity to parks, making it attractive for budget-conscious travelers and families. | Mississauga Valleys Community Centre, Local parks and trails, Mississauga Golf & Country Club, Shopping centers nearby, Easy access to public transportation |
| Cooksville | Diverse community with cultural amenities and easy access to transit. Great for visitors wanting to explore the multicultural vibe of Mississauga. | Cooksville Park, Local restaurants and shops, Transit access to Toronto, Cultural festivals, Nearby schools and community centers |
| Lakeview | Residential neighborhood close to the waterfront with charming homes and a growing number of cafes and restaurants. Suitable for relaxed stays by the lake. | Lakeview Park, The Beachfront Promenade, Local eateries and shops, Access to bike paths, Nearby tennis courts and golf courses |
Understanding Airbnb License Requirements & STR Laws in Mississauga (2025)
With 21% of listings showing registration in 2025, understanding potential Airbnb license requirements is crucial in Mississauga. Always verify the latest short term rental regulations and Airbnb license requirements directly with local government authorities for Mississauga to ensure full compliance before hosting.
(Source: AirROI data, 2025, based on 21% licensed listings)
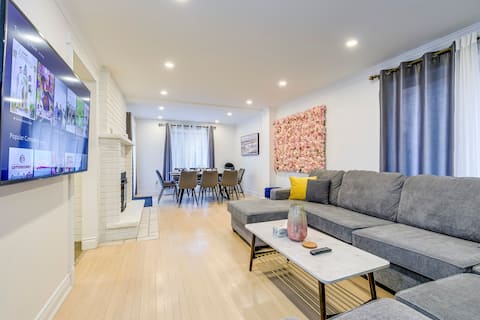
Top Performing Airbnb Properties in Mississauga (2025)
Benchmark your potential! Explore examples of top-performing Airbnb properties in Mississaugabased on Trailing Twelve Month (TTM) revenue. Analyze their characteristics, revenue, occupancy rate, and ADR to understand what drives success in this market.

Joyful Mansion with Charm Indoor
Entire Place • 6 bedrooms

Cheerful 7 bedrooms Villa with Hot tub & Pool.
Entire Place • 7 bedrooms
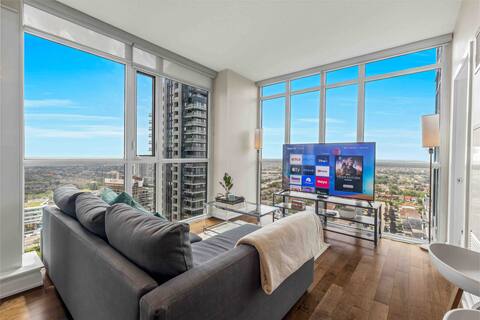
Luxury 2.5Br-2Bath 1 Prk Condo SQ1 Striking Views
Entire Place • 3 bedrooms

Modern 6 Bedroom/3 Bath Pool Home Near the Lake
Entire Place • 6 bedrooms
7 Beds Big Home Near Airport with Flower Wall
Entire Place • 6 bedrooms

4 Bed Beach House with Pool, Sauna & Hot Tub
Entire Place • 4 bedrooms
Note: Performance varies based on location, size, amenities, seasonality, and management quality. Data reflects the past 12 months.
Top Performing Airbnb Hosts in Mississauga (2025)
Learn from the best! This table showcases top-performing Airbnb hosts in Mississauga based on the number of properties managed and estimated total revenue over the past year. Analyze their scale and performance metrics.
| Host Name | Properties | Grossing Revenue | Stay Reviews | Avg Rating |
|---|---|---|---|---|
| Dave | 36 | $1,052,280 | 434 | 3.40/5.0 |
| Ali | 7 | $378,379 | 209 | 4.83/5.0 |
| SN Estates | 8 | $355,459 | 176 | 4.78/5.0 |
| Max | 3 | $332,557 | 115 | 4.64/5.0 |
| Christina | 5 | $269,144 | 270 | 4.78/5.0 |
| Omar | 4 | $206,990 | 582 | 4.89/5.0 |
| Rukiya | 4 | $198,207 | 149 | 4.73/5.0 |
| Sean And Angie | 2 | $179,537 | 45 | 4.96/5.0 |
| Host #527896920 | 2 | $173,744 | 111 | 4.94/5.0 |
| Madona | 9 | $167,044 | 114 | 4.15/5.0 |
Analyzing the strategies of top hosts, such as their property selection, pricing, and guest communication, can offer valuable lessons for optimizing your own Airbnb operations in Mississauga.
Dive Deeper: Advanced Mississauga STR Market Data (2025)
Ready to unlock more insights? AirROI provides access to advanced metrics and comprehensive Airbnb data for Mississauga. Explore detailed analytics beyond this report to refine your investment strategy, optimize pricing, and maximize your vacation rental profits.
Explore Advanced MetricsMississauga Short-Term Rental Market Composition (2025): Property & Room Types
Room Type Distribution
Property Type Distribution
Market Composition Insights for Mississauga
- The Mississauga Airbnb market composition is heavily skewed towards Entire Home/Apt listings, which make up 61.2% of the 1,545 active rentals. This indicates strong guest preference for privacy and space.
- However, a notable 37.9% share for Private Rooms suggests opportunities for budget-conscious travelers or hosts renting out spare rooms.
- Looking at the property type distribution in Mississauga, House properties are the most common (59.1%), reflecting the local real estate landscape.
- Houses represent a significant 59.1% portion, catering likely to families or larger groups.
- Smaller segments like hotel/boutique, outdoor/unique (combined 2.5%) offer potential for unique stay experiences.
Mississauga Airbnb Room Capacity Analysis (2025): Bedroom Distribution
Distribution of Listings by Number of Bedrooms
Room Capacity Insights for Mississauga
- The dominant room capacity in Mississauga is 1 bedroom listings, making up 35.9% of the market. This suggests a strong demand for properties suitable for couples or solo travelers.
- Together, 1 bedroom and 2 bedrooms properties represent 58.2% of the active Airbnb listings in Mississauga, indicating a high concentration in these sizes.
Mississauga Vacation Rental Guest Capacity Trends (2025)
Distribution of Listings by Guest Capacity
Guest Capacity Insights for Mississauga
- The most common guest capacity trend in Mississauga vacation rentals is listings accommodating 2 guests (20.5%). This suggests the primary traveler segment is likely couples or solo travelers.
- Properties designed for 2 guests and 4 guests dominate the Mississauga STR market, accounting for 39.4% of listings.
- 17.5% of properties accommodate 6+ guests, serving the market segment for larger families or group travel in Mississauga.
- On average, properties in Mississauga are equipped to host 3.0 guests.
Mississauga Airbnb Booking Patterns (2025): Available vs. Booked Days
Available Days Distribution
Booked Days Distribution
Booking Pattern Insights for Mississauga
- The most common availability pattern in Mississauga falls within the 271-366 days range, representing 36.1% of listings. This suggests many properties have significant open periods on their calendars.
- Approximately 67.9% of listings show high availability (181+ days open annually), indicating potential for increased bookings or specific owner usage patterns.
- For booked days, the 91-180 days range is most frequent in Mississauga (31.8%), reflecting common guest stay durations or potential owner blocking patterns.
- A notable 33.3% of properties secure long booking periods (181+ days booked per year), highlighting successful long-term rental strategies or significant owner usage.
Mississauga Airbnb Minimum Stay Requirements Analysis
Distribution of Listings by Minimum Night Requirement
1 Night
349 listings
26.3% of total
2 Nights
246 listings
18.5% of total
3 Nights
159 listings
12% of total
4-6 Nights
96 listings
7.2% of total
7-29 Nights
196 listings
14.8% of total
30+ Nights
282 listings
21.2% of total
Key Insights
- The most prevalent minimum stay requirement in Mississauga is 1 Night, adopted by 26.3% of listings. This highlights the market's preference for shorter, flexible bookings.
- A significant segment (21.2%) caters to monthly stays (30+ nights) in Mississauga, pointing to opportunities in the extended-stay market.
Recommendations
- Align with the market by considering a 1 Night minimum stay, as 26.3% of Mississauga hosts use this setting.
- If feasible, allowing 1-night stays, especially midweek or during low season, could capture last-minute bookings, as only 26.3% currently do.
- Explore offering discounts for stays of 30+ nights to attract the 21.2% of the market seeking extended stays.
- Adjust minimum nights based on seasonality – potentially shorter during low season and longer during peak demand periods in Mississauga.
Mississauga Airbnb Cancellation Policy Trends Analysis (2025)
Limited
1 listings
0.1% of total
Super Strict 30 Days
3 listings
0.3% of total
Super Strict 60 Days
1 listings
0.1% of total
Flexible
207 listings
17.5% of total
Moderate
355 listings
30% of total
Firm
238 listings
20.1% of total
Strict
379 listings
32% of total
Cancellation Policy Insights for Mississauga
- The prevailing Airbnb cancellation policy trend in Mississauga is Strict, used by 32% of listings.
- A majority (52.1%) of hosts in Mississauga utilize Firm or Strict policies, indicating a market where hosts prioritize booking security.
Recommendations for Hosts
- Consider adopting a Strict policy to align with the 32% market standard in Mississauga.
- With 32% using Strict terms, this is a viable option in Mississauga, particularly for high-value properties or during peak demand periods.
- Regularly review your cancellation policy against competitors and market demand shifts in Mississauga.
Mississauga STR Booking Lead Time Analysis (2025)
Average Booking Lead Time by Month
Booking Lead Time Insights for Mississauga
- The overall average booking lead time for vacation rentals in Mississauga is 32 days.
- Guests book furthest in advance for stays during November (average 52 days), likely coinciding with peak travel demand or local events.
- The shortest booking windows occur for stays in February (average 22 days), indicating more last-minute travel plans during this time.
- Seasonally, Summer (41 days avg.) sees the longest lead times, while Winter (26 days avg.) has the shortest, reflecting typical travel planning cycles.
Recommendations for Hosts
- Use the overall average lead time (32 days) as a baseline for your pricing and availability strategy in Mississauga.
- For November stays, consider implementing length-of-stay discounts or slightly higher rates for bookings made less than 52 days out to capitalize on advance planning.
- Target marketing efforts for the Summer season well in advance (at least 41 days) to capture early planners.
- Monitor your own booking lead times against these Mississauga averages to identify opportunities for dynamic pricing adjustments.
Popular & Essential Airbnb Amenities in Mississauga (2025)
Amenity Prevalence
Amenity Insights for Mississauga
- Essential amenities in Mississauga that guests expect include: Wifi, Air conditioning, Smoke alarm, Heating. Lacking these (any) could significantly impact bookings.
- Popular amenities like Carbon monoxide alarm, Hot water, Kitchen are common but not universal. Offering these can provide a competitive edge.
Recommendations for Hosts
- Ensure your listing includes all essential amenities for Mississauga: Wifi, Air conditioning, Smoke alarm, Heating.
- Prioritize adding missing essentials: Wifi, Air conditioning, Smoke alarm, Heating.
- Consider adding popular differentiators like Carbon monoxide alarm or Hot water to increase appeal.
- Highlight unique or less common amenities you offer (e.g., hot tub, dedicated workspace, EV charger) in your listing description and photos.
- Regularly check competitor amenities in Mississauga to stay competitive.
Mississauga Airbnb Guest Demographics & Profile Analysis (2025)
Guest Profile Summary for Mississauga
- The typical guest profile for Airbnb in Mississauga consists of a mix of domestic (57%) and international guests, often arriving from nearby Toronto, typically belonging to the Post-2000s (Gen Z/Alpha) group (50%), primarily speaking English or French.
- Domestic travelers account for 56.6% of guests.
- Key international markets include Canada (56.6%) and United States (23.8%).
- Top languages spoken are English (55.4%) followed by French (9%).
- A significant demographic segment is the Post-2000s (Gen Z/Alpha) group, representing 50% of guests.
Recommendations for Hosts
- Balance marketing efforts between domestic and international channels based on the guest mix.
- Tailor amenities and listing descriptions to appeal to the dominant Post-2000s (Gen Z/Alpha) demographic (e.g., highlight fast WiFi, smart home features, local guides).
- Highlight unique local experiences or amenities relevant to the primary guest profile.
- Consider seasonal promotions aligned with peak travel times for key origin markets.
Nearby Short-Term Rental Market Comparison
How does the Mississauga Airbnb market stack up against its neighbors? Compare key performance metrics like average monthly revenue, ADR, and occupancy rates in surrounding areas to understand the broader regional STR landscape.
| Market | Active Properties | Monthly Revenue | Daily Rate | Avg. Occupancy |
|---|---|---|---|---|
| Town of Mansfield | 58 | $4,670 | $517.93 | 32% |
| Town of West Seneca | 15 | $4,337 | $246.11 | 52% |
| Town of Porter | 25 | $4,243 | $300.26 | 55% |
| Town of Ellicottville | 201 | $3,840 | $380.95 | 36% |
| North East Township | 34 | $3,530 | $264.33 | 48% |
| Town of Elma | 10 | $3,377 | $418.28 | 48% |
| Niagara-on-the-Lake | 413 | $3,358 | $265.20 | 44% |
| Town of Orchard Park | 38 | $3,302 | $252.95 | 46% |
| Tonawanda Town | 21 | $3,213 | $206.17 | 53% |
| Town of Wilson | 27 | $3,195 | $257.32 | 48% |