Marmora and Lake Airbnb Market Analysis 2025: Short Term Rental Data & Vacation Rental Statistics in Ontario, Canada
Is Airbnb profitable in Marmora and Lake in 2025? Explore comprehensive Airbnb analytics for Marmora and Lake, Ontario, Canada to uncover income potential. This 2025 STR market report for Marmora and Lake, based on AirROI data from April 2024 to March 2025, reveals key trends in the niche market of 65 active listings.
Whether you're considering an Airbnb investment in Marmora and Lake, optimizing your existing vacation rental, or exploring rental arbitrage opportunities, understanding the Marmora and Lake Airbnb data is crucial. Leveraging the low regulation environment is key to maximizing your short term rental income potential. Let's dive into the specifics.
Key Marmora and Lake Airbnb Performance Metrics Overview
Monthly Airbnb Revenue Variations & Income Potential in Marmora and Lake (2025)
Understanding the monthly revenue variations for Airbnb listings in Marmora and Lake is key to maximizing your short term rental income potential. Seasonality significantly impacts earnings. Our analysis, based on data from the past 12 months, shows that the peak revenue month for STRs in Marmora and Lake is typically August, while February often presents the lowest earnings, highlighting opportunities for strategic pricing adjustments during shoulder and low seasons. Explore the typical Airbnb income in Marmora and Lake across different performance tiers:
- Best-in-class properties (Top 10%) achieve $6,666+ monthly, often utilizing dynamic pricing and superior guest experiences.
- Strong performing properties (Top 25%) earn $4,444 or more, indicating effective management and desirable locations/amenities.
- Typical properties (Median) generate around $2,392 per month, representing the average market performance.
- Entry-level properties (Bottom 25%) see earnings around $976, often with potential for optimization.
Average Monthly Airbnb Earnings Trend in Marmora and Lake
Marmora and Lake Airbnb Occupancy Rate Trends (2025)
Maximize your bookings by understanding the Marmora and Lake STR occupancy trends. Seasonal demand shifts significantly influence how often properties are booked. Typically, Augustsees the highest demand (peak season occupancy), while February experiences the lowest (low season). Effective strategies, like adjusting minimum stays or offering promotions, can boost occupancy during slower periods. Here's how different property tiers perform in Marmora and Lake:
- Best-in-class properties (Top 10%) achieve 67%+ occupancy, indicating high desirability and potentially optimized availability.
- Strong performing properties (Top 25%) maintain 46% or higher occupancy, suggesting good market fit and guest satisfaction.
- Typical properties (Median) have an occupancy rate around 29%.
- Entry-level properties (Bottom 25%) average 16% occupancy, potentially facing higher vacancy.
Average Monthly Occupancy Rate Trend in Marmora and Lake
Average Daily Rate (ADR) Airbnb Trends in Marmora and Lake (2025)
Effective short term rental pricing strategy in Marmora and Lake involves understanding monthly ADR fluctuations. The Average Daily Rate (ADR) for Airbnb in Marmora and Lake typically peaks in July and dips lowest during March. Leveraging Airbnb dynamic pricing tools or strategies based on this seasonality can significantly boost revenue. Here's a look at the typical nightly rates achieved:
- Best-in-class properties (Top 10%) command rates of $496+ per night, often due to premium features or locations.
- Strong performing properties (Top 25%) achieve nightly rates of $316 or more.
- Typical properties (Median) charge around $224 per night.
- Entry-level properties (Bottom 25%) earn around $136 per night.
Average Daily Rate (ADR) Trend by Month in Marmora and Lake
Get Live Marmora and Lake Market Intelligence 👇

Explore Real-time Analytics
Airbnb Seasonality Analysis & Trends in Marmora and Lake (2025)
Peak Season (August, July, June)
- Revenue averages $5,327 per month
- Occupancy rates average 51.8%
- Daily rates average $280
Shoulder Season
- Revenue averages $2,847 per month
- Occupancy maintains around 30.5%
- Daily rates hold near $259
Low Season (January, February, March)
- Revenue drops to average $1,551 per month
- Occupancy decreases to average 22.3%
- Daily rates adjust to average $242
Seasonality Insights for Marmora and Lake
- The Airbnb seasonality in Marmora and Lake shows highly seasonal trends requiring careful strategy. While the sections above show seasonal averages, it's also insightful to look at the extremes:
- During the high season, the absolute peak month showcases Marmora and Lake's highest earning potential, with monthly revenues capable of climbing to $6,114, occupancy reaching a high of 66.2%, and ADRs peaking at $284.
- Conversely, the slowest single month of the year, typically falling within the low season, marks the market's lowest point. In this month, revenue might dip to $1,414, occupancy could drop to 21.8%, and ADRs may adjust down to $239.
- Understanding both the seasonal averages and these monthly peaks and troughs in revenue, occupancy, and ADR is crucial for maximizing your Airbnb profit potential in Marmora and Lake.
Seasonal Strategies for Maximizing Profit
- Peak Season: Maximize revenue through premium pricing and potentially longer minimum stays. Ensure high availability.
- Low Season: Offer competitive pricing, special promotions (e.g., extended stay discounts), and flexible cancellation policies. Target off-season travelers like remote workers or budget-conscious guests.
- Shoulder Seasons: Implement dynamic pricing that balances peak and low rates. Target weekend travelers or specific events. Offer slightly more flexible terms than peak season.
- Regularly analyze your own performance against these Marmora and Lake seasonality benchmarks and adjust your pricing and availability strategy accordingly.
Best Areas for Airbnb Investment in Marmora and Lake (2025)
Exploring the top neighborhoods for short-term rentals in Marmora and Lake? This section highlights key areas, outlining why they are attractive for hosts and guests, along with notable local attractions. Consider these locations based on your target guest profile and investment strategy.
| Neighborhood / Area | Why Host Here? (Target Guests & Appeal) | Key Attractions & Landmarks |
|---|---|---|
| Marmora | A charming small town known for its scenic beauty and friendly community. It is an ideal destination for those looking to escape the city and enjoy nature, making it appealing for travelers seeking relaxation and outdoor activities. | Marmora Mine, Birds Creek, Marmora Festival, Hastings and Prince Edward Regiment Museum, McGowan Lake |
| Crowe River | This area offers stunning river views and opportunities for water activities, attracting those interested in fishing, kayaking, and enjoying nature. It's perfect for vacationers looking to unwind by the water. | Crowe River Paddle, Fishing spots, Scenic hiking trails, Riverfront campsites |
| Lake Marmora | This beautiful lake provides a peaceful retreat for visitors who enjoy water sports, swimming, and relaxing lakeside. Its picturesque setting makes it a prime location for Airbnb hosts to attract families and outdoor enthusiasts. | Water activities, Picnic spots, Lakeside parks, Wildlife viewing |
| Madoc | Nearby Madoc is a quaint village with historical significance and community events. It's an attractive spot for visitors interested in local culture and history, offering a unique experience that appeals to various guest demographics. | Madoc Heritage Museum, Local artisan shops, Annual events, Scenic landscape |
| Stirling | Stirling is known for its quaint downtown area and cultural heritage. It appeals to visitors seeking a small-town feel with access to amenities and outdoor activities, making it a great spot for hosting. | Stirling Theatre, Local dining options, Family-friendly parks, Historical sites |
| Belleville | As a larger urban center near Marmora and Lake, Belleville offers a mix of urban amenities and nearby nature. It attracts business travelers and tourists alike, making it a prime spot for diverse Airbnb guests. | Bay of Quinte, Zwick's Park, Belleville City Hall, Shopping centers, Dining options |
| Trenton | Located close to Marmora, Trenton is known for its military history and vibrant community. With convenient access to parks and the waterfront, it draws visitors looking for both relaxation and adventure. | National Air Force Museum, Trenton Green Belt Trail, Waterfront parks, Annual festivals |
| Prince Edward County | Though slightly farther, this area is famous for its wineries, picturesque landscapes, and art galleries. It attracts a large number of tourists looking for unique experiences, making it an excellent investment area for Airbnb. | Wine tours, Sandbanks Provincial Park, Art galleries, Beaches, Local festivals |
Understanding Airbnb License Requirements & STR Laws in Marmora and Lake (2025)
While Marmora and Lake, Ontario, Canada currently shows low STR regulations, specific Airbnb license requirements might still exist or change. Always verify the latest short term rental regulations and Airbnb license requirements directly with local government authorities for Marmora and Lake to ensure full compliance before hosting.
(Source: AirROI data, 2025, finding no licensed listings among those analyzed)
Top Performing Airbnb Properties in Marmora and Lake (2025)
Benchmark your potential! Explore examples of top-performing Airbnb properties in Marmora and Lakebased on Trailing Twelve Month (TTM) revenue. Analyze their characteristics, revenue, occupancy rate, and ADR to understand what drives success in this market.
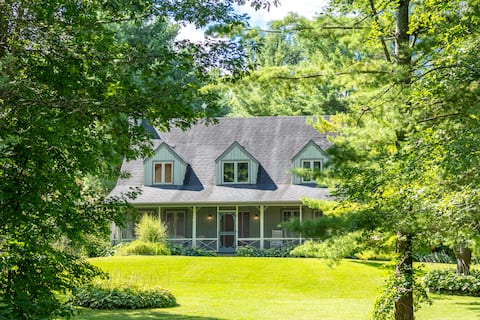
Sleeps 28, Hot Tub, Pool - Waterfront Stay
Entire Place • 6 bedrooms
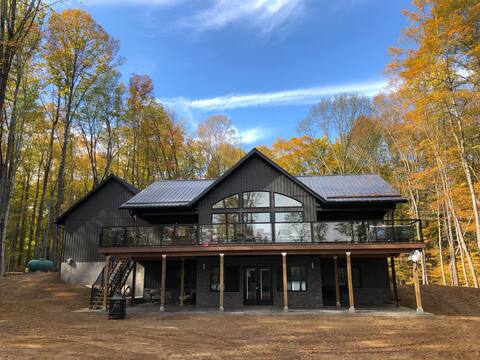
5 Acres of Nature & Luxury - Hot Tub & Trails
Entire Place • 5 bedrooms
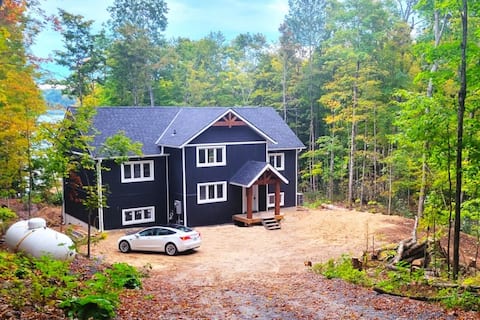
Gorgeous Lakefront Luxury Large Cottage
Entire Place • 5 bedrooms
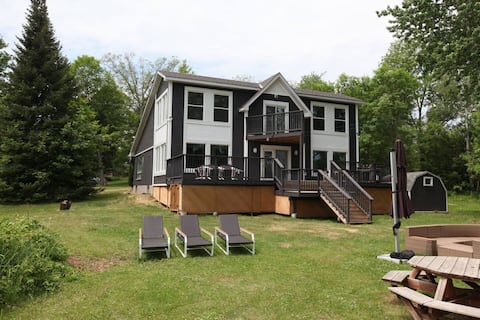
Entire Luxurious Waterfront Peninsula Cottage
Entire Place • 7 bedrooms
Sunny Shores Cottage
Entire Place • 4 bedrooms
Gorgeous Sandy Waterfront w/Hot Tub and Sauna
Entire Place • 4 bedrooms
Note: Performance varies based on location, size, amenities, seasonality, and management quality. Data reflects the past 12 months.
Top Performing Airbnb Hosts in Marmora and Lake (2025)
Learn from the best! This table showcases top-performing Airbnb hosts in Marmora and Lake based on the number of properties managed and estimated total revenue over the past year. Analyze their scale and performance metrics.
| Host Name | Properties | Grossing Revenue | Stay Reviews | Avg Rating |
|---|---|---|---|---|
| Brendan | 2 | $169,750 | 173 | 4.78/5.0 |
| Brandon | 1 | $101,316 | 83 | 4.99/5.0 |
| Asanga Perera | 1 | $80,530 | 27 | 4.96/5.0 |
| Chun | 1 | $75,501 | 77 | 4.83/5.0 |
| Amanda | 1 | $71,844 | 40 | 4.98/5.0 |
| Floren | 1 | $71,188 | 13 | 5.00/5.0 |
| Cheyenne | 1 | $64,783 | 48 | 4.81/5.0 |
| Christine | 1 | $58,287 | 12 | 5.00/5.0 |
| Dan | 1 | $56,249 | 58 | 5.00/5.0 |
| Shan | 1 | $53,488 | 41 | 4.51/5.0 |
Analyzing the strategies of top hosts, such as their property selection, pricing, and guest communication, can offer valuable lessons for optimizing your own Airbnb operations in Marmora and Lake.
Dive Deeper: Advanced Marmora and Lake STR Market Data (2025)
Ready to unlock more insights? AirROI provides access to advanced metrics and comprehensive Airbnb data for Marmora and Lake. Explore detailed analytics beyond this report to refine your investment strategy, optimize pricing, and maximize your vacation rental profits.
Explore Advanced MetricsMarmora and Lake Short-Term Rental Market Composition (2025): Property & Room Types
Room Type Distribution
Property Type Distribution
Market Composition Insights for Marmora and Lake
- The Marmora and Lake Airbnb market composition is heavily skewed towards Entire Home/Apt listings, which make up 95.4% of the 65 active rentals. This indicates strong guest preference for privacy and space.
- Looking at the property type distribution in Marmora and Lake, House properties are the most common (73.8%), reflecting the local real estate landscape.
- Houses represent a significant 73.8% portion, catering likely to families or larger groups.
- Smaller segments like others, hotel/boutique, unique stays, apartment/condo (combined 9.1%) offer potential for unique stay experiences.
Marmora and Lake Airbnb Room Capacity Analysis (2025): Bedroom Distribution
Distribution of Listings by Number of Bedrooms
Room Capacity Insights for Marmora and Lake
- The dominant room capacity in Marmora and Lake is 3 bedrooms listings, making up 29.2% of the market. This suggests a strong demand for properties suitable for families or small groups.
- Together, 3 bedrooms and 4 bedrooms properties represent 52.3% of the active Airbnb listings in Marmora and Lake, indicating a high concentration in these sizes.
- A significant 67.7% of listings offer 3+ bedrooms, catering to larger groups and families seeking more space in Marmora and Lake.
Marmora and Lake Vacation Rental Guest Capacity Trends (2025)
Distribution of Listings by Guest Capacity
Guest Capacity Insights for Marmora and Lake
- The most common guest capacity trend in Marmora and Lake vacation rentals is listings accommodating 8+ guests (53.8%). This suggests the primary traveler segment is likely larger groups.
- Properties designed for 8+ guests and 4 guests dominate the Marmora and Lake STR market, accounting for 67.6% of listings.
- 73.8% of properties accommodate 6+ guests, serving the market segment for larger families or group travel in Marmora and Lake.
- On average, properties in Marmora and Lake are equipped to host 6.6 guests.
Marmora and Lake Airbnb Booking Patterns (2025): Available vs. Booked Days
Available Days Distribution
Booked Days Distribution
Booking Pattern Insights for Marmora and Lake
- The most common availability pattern in Marmora and Lake falls within the 271-366 days range, representing 47.7% of listings. This suggests many properties have significant open periods on their calendars.
- Approximately 84.6% of listings show high availability (181+ days open annually), indicating potential for increased bookings or specific owner usage patterns.
- For booked days, the 91-180 days range is most frequent in Marmora and Lake (41.5%), reflecting common guest stay durations or potential owner blocking patterns.
- A notable 16.9% of properties secure long booking periods (181+ days booked per year), highlighting successful long-term rental strategies or significant owner usage.
Marmora and Lake Airbnb Minimum Stay Requirements Analysis
Distribution of Listings by Minimum Night Requirement
1 Night
8 listings
13.3% of total
2 Nights
39 listings
65% of total
3 Nights
5 listings
8.3% of total
4-6 Nights
2 listings
3.3% of total
7-29 Nights
1 listings
1.7% of total
30+ Nights
5 listings
8.3% of total
Key Insights
- The most prevalent minimum stay requirement in Marmora and Lake is 2 Nights, adopted by 65% of listings. This highlights the market's preference for shorter, flexible bookings.
- A strong majority (78.3%) of the Marmora and Lake Airbnb data shows acceptance of very short stays (1-2 nights), indicating a dynamic, high-turnover market.
Recommendations
- Align with the market by considering a 2 Nights minimum stay, as 65% of Marmora and Lake hosts use this setting.
- If feasible, allowing 1-night stays, especially midweek or during low season, could capture last-minute bookings, as only 13.3% currently do.
- A 2-night minimum appears standard (65%). Consider this for weekends or peak periods.
- Explore offering discounts for stays of 30+ nights to attract the 8.3% of the market seeking extended stays.
- Adjust minimum nights based on seasonality – potentially shorter during low season and longer during peak demand periods in Marmora and Lake.
Marmora and Lake Airbnb Cancellation Policy Trends Analysis (2025)
Flexible
6 listings
10.5% of total
Moderate
18 listings
31.6% of total
Firm
16 listings
28.1% of total
Strict
17 listings
29.8% of total
Cancellation Policy Insights for Marmora and Lake
- The prevailing Airbnb cancellation policy trend in Marmora and Lake is Moderate, used by 31.6% of listings.
- A majority (57.9%) of hosts in Marmora and Lake utilize Firm or Strict policies, indicating a market where hosts prioritize booking security.
Recommendations for Hosts
- Consider adopting a Moderate policy to align with the 31.6% market standard in Marmora and Lake.
- Regularly review your cancellation policy against competitors and market demand shifts in Marmora and Lake.
Marmora and Lake STR Booking Lead Time Analysis (2025)
Average Booking Lead Time by Month
Booking Lead Time Insights for Marmora and Lake
- The overall average booking lead time for vacation rentals in Marmora and Lake is 45 days.
- Guests book furthest in advance for stays during July (average 81 days), likely coinciding with peak travel demand or local events.
- The shortest booking windows occur for stays in March (average 14 days), indicating more last-minute travel plans during this time.
- Seasonally, Summer (75 days avg.) sees the longest lead times, while Winter (28 days avg.) has the shortest, reflecting typical travel planning cycles.
Recommendations for Hosts
- Use the overall average lead time (45 days) as a baseline for your pricing and availability strategy in Marmora and Lake.
- For July stays, consider implementing length-of-stay discounts or slightly higher rates for bookings made less than 81 days out to capitalize on advance planning.
- During March, focus on last-minute booking availability and promotions, as guests book with very short notice (14 days avg.).
- Target marketing efforts for the Summer season well in advance (at least 75 days) to capture early planners.
- Monitor your own booking lead times against these Marmora and Lake averages to identify opportunities for dynamic pricing adjustments.
Popular & Essential Airbnb Amenities in Marmora and Lake (2025)
Amenity Prevalence
Amenity Insights for Marmora and Lake
- Essential amenities in Marmora and Lake that guests expect include: Smoke alarm, Free parking on premises, Kitchen, Fire pit, Heating. Lacking these (any) could significantly impact bookings.
- Popular amenities like Fire extinguisher, Hot water, Dishes and silverware are common but not universal. Offering these can provide a competitive edge.
Recommendations for Hosts
- Ensure your listing includes all essential amenities for Marmora and Lake: Smoke alarm, Free parking on premises, Kitchen, Fire pit, Heating.
- Prioritize adding missing essentials: Free parking on premises, Kitchen, Fire pit, Heating.
- Consider adding popular differentiators like Fire extinguisher or Hot water to increase appeal.
- Highlight unique or less common amenities you offer (e.g., hot tub, dedicated workspace, EV charger) in your listing description and photos.
- Regularly check competitor amenities in Marmora and Lake to stay competitive.
Marmora and Lake Airbnb Guest Demographics & Profile Analysis (2025)
Guest Profile Summary for Marmora and Lake
- The typical guest profile for Airbnb in Marmora and Lake consists of primarily domestic travelers (95%), often arriving from nearby Toronto, typically belonging to the Post-2000s (Gen Z/Alpha) group (50%), primarily speaking English or French.
- Domestic travelers account for 94.6% of guests.
- Key international markets include Canada (94.6%) and United States (2.4%).
- Top languages spoken are English (60.3%) followed by French (11.7%).
- A significant demographic segment is the Post-2000s (Gen Z/Alpha) group, representing 50% of guests.
Recommendations for Hosts
- Target domestic marketing efforts towards travelers from Toronto and Ottawa.
- Tailor amenities and listing descriptions to appeal to the dominant Post-2000s (Gen Z/Alpha) demographic (e.g., highlight fast WiFi, smart home features, local guides).
- Highlight unique local experiences or amenities relevant to the primary guest profile.
- Consider seasonal promotions aligned with peak travel times for key origin markets.
Nearby Short-Term Rental Market Comparison
How does the Marmora and Lake Airbnb market stack up against its neighbors? Compare key performance metrics like average monthly revenue, ADR, and occupancy rates in surrounding areas to understand the broader regional STR landscape.
| Market | Active Properties | Monthly Revenue | Daily Rate | Avg. Occupancy |
|---|---|---|---|---|
| Town of Porter | 25 | $4,243 | $300.26 | 55% |
| Carrying Place | 20 | $3,737 | $315.96 | 48% |
| Town of Pittsford | 53 | $3,628 | $410.81 | 43% |
| Town of Cicero | 33 | $3,611 | $238.12 | 54% |
| Rossmore | 10 | $3,345 | $268.20 | 56% |
| Town of Wilson | 27 | $3,195 | $257.32 | 48% |
| Town of Lyme | 29 | $3,140 | $268.25 | 46% |
| Consecon | 26 | $3,124 | $299.57 | 43% |
| Village of Fairport | 25 | $3,068 | $216.06 | 54% |
| Dysart et al | 264 | $3,046 | $310.03 | 42% |