Markham Airbnb Market Analysis 2025: Short Term Rental Data & Vacation Rental Statistics in Ontario, Canada
Is Airbnb profitable in Markham in 2025? Explore comprehensive Airbnb analytics for Markham, Ontario, Canada to uncover income potential. This 2025 STR market report for Markham, based on AirROI data from April 2024 to March 2025, reveals key trends in the market of 413 active listings.
Whether you're considering an Airbnb investment in Markham, optimizing your existing vacation rental, or exploring rental arbitrage opportunities, understanding the Markham Airbnb data is crucial. Leveraging the low regulation environment is key to maximizing your short term rental income potential. Let's dive into the specifics.
Key Markham Airbnb Performance Metrics Overview
Monthly Airbnb Revenue Variations & Income Potential in Markham (2025)
Understanding the monthly revenue variations for Airbnb listings in Markham is key to maximizing your short term rental income potential. Seasonality significantly impacts earnings. Our analysis, based on data from the past 12 months, shows that the peak revenue month for STRs in Markham is typically May, while February often presents the lowest earnings, highlighting opportunities for strategic pricing adjustments during shoulder and low seasons. Explore the typical Airbnb income in Markham across different performance tiers:
- Best-in-class properties (Top 10%) achieve $3,307+ monthly, often utilizing dynamic pricing and superior guest experiences.
- Strong performing properties (Top 25%) earn $2,002 or more, indicating effective management and desirable locations/amenities.
- Typical properties (Median) generate around $1,080 per month, representing the average market performance.
- Entry-level properties (Bottom 25%) see earnings around $538, often with potential for optimization.
Average Monthly Airbnb Earnings Trend in Markham
Markham Airbnb Occupancy Rate Trends (2025)
Maximize your bookings by understanding the Markham STR occupancy trends. Seasonal demand shifts significantly influence how often properties are booked. Typically, Augustsees the highest demand (peak season occupancy), while March experiences the lowest (low season). Effective strategies, like adjusting minimum stays or offering promotions, can boost occupancy during slower periods. Here's how different property tiers perform in Markham:
- Best-in-class properties (Top 10%) achieve 88%+ occupancy, indicating high desirability and potentially optimized availability.
- Strong performing properties (Top 25%) maintain 73% or higher occupancy, suggesting good market fit and guest satisfaction.
- Typical properties (Median) have an occupancy rate around 46%.
- Entry-level properties (Bottom 25%) average 20% occupancy, potentially facing higher vacancy.
Average Monthly Occupancy Rate Trend in Markham
Average Daily Rate (ADR) Airbnb Trends in Markham (2025)
Effective short term rental pricing strategy in Markham involves understanding monthly ADR fluctuations. The Average Daily Rate (ADR) for Airbnb in Markham typically peaks in July and dips lowest during February. Leveraging Airbnb dynamic pricing tools or strategies based on this seasonality can significantly boost revenue. Here's a look at the typical nightly rates achieved:
- Best-in-class properties (Top 10%) command rates of $188+ per night, often due to premium features or locations.
- Strong performing properties (Top 25%) achieve nightly rates of $110 or more.
- Typical properties (Median) charge around $64 per night.
- Entry-level properties (Bottom 25%) earn around $43 per night.
Average Daily Rate (ADR) Trend by Month in Markham
Get Live Markham Market Intelligence 👇

Explore Real-time Analytics
Airbnb Seasonality Analysis & Trends in Markham (2025)
Peak Season (May, June, April)
- Revenue averages $2,084 per month
- Occupancy rates average 47.1%
- Daily rates average $101
Shoulder Season
- Revenue averages $1,502 per month
- Occupancy maintains around 50.2%
- Daily rates hold near $96
Low Season (January, February, March)
- Revenue drops to average $1,024 per month
- Occupancy decreases to average 42.2%
- Daily rates adjust to average $79
Seasonality Insights for Markham
- The Airbnb seasonality in Markham shows highly seasonal trends requiring careful strategy. While the sections above show seasonal averages, it's also insightful to look at the extremes:
- During the high season, the absolute peak month showcases Markham's highest earning potential, with monthly revenues capable of climbing to $2,174, occupancy reaching a high of 58.9%, and ADRs peaking at $102.
- Conversely, the slowest single month of the year, typically falling within the low season, marks the market's lowest point. In this month, revenue might dip to $969, occupancy could drop to 39.6%, and ADRs may adjust down to $78.
- Understanding both the seasonal averages and these monthly peaks and troughs in revenue, occupancy, and ADR is crucial for maximizing your Airbnb profit potential in Markham.
Seasonal Strategies for Maximizing Profit
- Peak Season: Maximize revenue through premium pricing and potentially longer minimum stays. Ensure high availability.
- Low Season: Offer competitive pricing, special promotions (e.g., extended stay discounts), and flexible cancellation policies. Target off-season travelers like remote workers or budget-conscious guests.
- Shoulder Seasons: Implement dynamic pricing that balances peak and low rates. Target weekend travelers or specific events. Offer slightly more flexible terms than peak season.
- Regularly analyze your own performance against these Markham seasonality benchmarks and adjust your pricing and availability strategy accordingly.
Best Areas for Airbnb Investment in Markham (2025)
Exploring the top neighborhoods for short-term rentals in Markham? This section highlights key areas, outlining why they are attractive for hosts and guests, along with notable local attractions. Consider these locations based on your target guest profile and investment strategy.
| Neighborhood / Area | Why Host Here? (Target Guests & Appeal) | Key Attractions & Landmarks |
|---|---|---|
| Unionville | Historic village with charming streets, boutiques, and eateries. It's appealing to families and visitors seeking a quaint and picturesque experience. | Main Street Unionville, Toogood Pond Park, Varley Art Gallery, Flato Markham Theatre, Markham Museum |
| Markham Village | A vibrant community with a mix of residential and commercial areas. Offers parks, shops, and restaurants, attracting local and visiting guests alike. | Markham Village Music Festival, Markham Village Historical Society, Local shops and cafes, Centennial Community Centre |
| Berczy Village | A newer community with modern amenities, parks, and nearby schools. Appeals to families and those looking for a tranquil environment close to city life. | Berczy Park, Nearby golf courses, Walking trails, Community events |
| Buena Vista | A residential neighborhood known for its family-friendly atmosphere and proximity to amenities. Ideal for longer stays for families or working professionals. | Parks and playgrounds, Community swimming pool, Local dining options, Recreation facilities |
| Cornell | A rapidly developing area with new homes and community amenities. Attractive to renters looking for modern living environments. | Cornell Community Centre, Nearby shopping centers, Parks and walking trails, Year-round community events |
| Markham Gateway | Strategically located near key transit routes and business hubs. Ideal for business travelers and tourists needing easy access to the Greater Toronto Area. | SmartCentres Markham, Restaurants and shopping, Access to highways and transit, Proximity to business services |
| Thornhill | Located on the border of Vaughan and Markham, this area attracts visitors with its mix of old and new, offering diverse experiences and cultural elements. | Thornhill Golf Club, Shopping at Promenade Mall, Historic sites, Cultural festivals |
| Cachet | A beautiful suburb known for its scenic views and family-friendly environment. Appeals to those looking for a peaceful stay while being close to urban amenities. | Cachet Woods Park, Nearby golf clubs, Community activities, Access to transit |
Understanding Airbnb License Requirements & STR Laws in Markham (2025)
While Markham, Ontario, Canada currently shows low STR regulations, specific Airbnb license requirements might still exist or change. Always verify the latest short term rental regulations and Airbnb license requirements directly with local government authorities for Markham to ensure full compliance before hosting.
(Source: AirROI data, 2025, based on 0% licensed listings)
Top Performing Airbnb Properties in Markham (2025)
Benchmark your potential! Explore examples of top-performing Airbnb properties in Markhambased on Trailing Twelve Month (TTM) revenue. Analyze their characteristics, revenue, occupancy rate, and ADR to understand what drives success in this market.
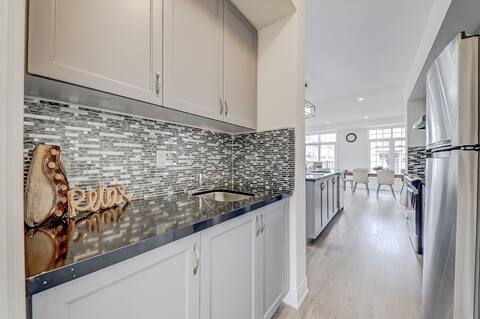
Pond paradise 5BD/ 3W (family friendly)
Entire Place • 5 bedrooms
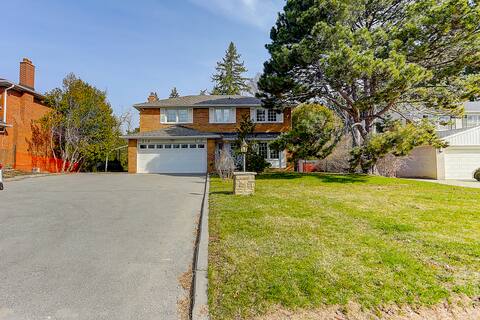
Entire House with 7 rooms
Entire Place • 7 bedrooms
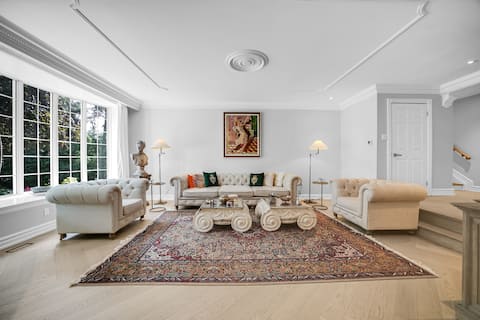
Thornhill 5-BDRM Spacious Luxury Retreat
Entire Place • 5 bedrooms
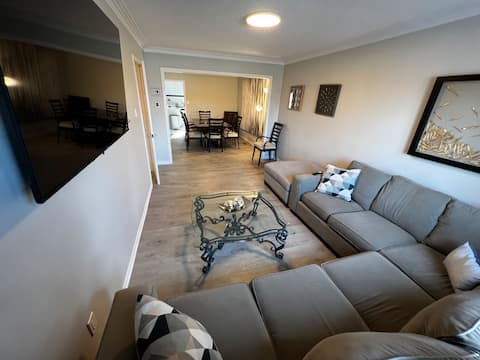
Luxury & spacious house in Upscale district.
Entire Place • 3 bedrooms

Luxury Home - Indoor Elevator&Hot Tub
Entire Place • 3 bedrooms
Luxury Family Home
Entire Place • 3 bedrooms
Note: Performance varies based on location, size, amenities, seasonality, and management quality. Data reflects the past 12 months.
Top Performing Airbnb Hosts in Markham (2025)
Learn from the best! This table showcases top-performing Airbnb hosts in Markham based on the number of properties managed and estimated total revenue over the past year. Analyze their scale and performance metrics.
| Host Name | Properties | Grossing Revenue | Stay Reviews | Avg Rating |
|---|---|---|---|---|
| Host #240666104 | 4 | $115,298 | 18 | 1.21/5.0 |
| Host #29479082 | 5 | $97,171 | 34 | 3.10/5.0 |
| Sasikala | 1 | $91,282 | 15 | 4.27/5.0 |
| Kelsey | 4 | $89,351 | 140 | 4.98/5.0 |
| Homeira | 4 | $81,522 | 92 | 4.75/5.0 |
| Host #186299872 | 12 | $70,268 | 24 | 1.47/5.0 |
| Bing (5 Stars ⭐️⭐️⭐️⭐️⭐️) | 5 | $70,154 | 759 | 4.92/5.0 |
| Michelle | 2 | $68,219 | 120 | 4.94/5.0 |
| Hamidreza | 1 | $66,847 | 16 | 4.88/5.0 |
| Sylvia | 1 | $63,664 | 70 | 4.99/5.0 |
Analyzing the strategies of top hosts, such as their property selection, pricing, and guest communication, can offer valuable lessons for optimizing your own Airbnb operations in Markham.
Dive Deeper: Advanced Markham STR Market Data (2025)
Ready to unlock more insights? AirROI provides access to advanced metrics and comprehensive Airbnb data for Markham. Explore detailed analytics beyond this report to refine your investment strategy, optimize pricing, and maximize your vacation rental profits.
Explore Advanced MetricsMarkham Short-Term Rental Market Composition (2025): Property & Room Types
Room Type Distribution
Property Type Distribution
Market Composition Insights for Markham
- The Markham Airbnb market composition is heavily skewed towards Private Room listings, which make up 53.3% of the 413 active rentals. This indicates strong guest preference for privacy and space.
- Looking at the property type distribution in Markham, House properties are the most common (78.5%), reflecting the local real estate landscape.
- Houses represent a significant 78.5% portion, catering likely to families or larger groups.
- Smaller segments like hotel/boutique, unique stays (combined 2.4%) offer potential for unique stay experiences.
Markham Airbnb Room Capacity Analysis (2025): Bedroom Distribution
Distribution of Listings by Number of Bedrooms
Room Capacity Insights for Markham
- The dominant room capacity in Markham is 1 bedroom listings, making up 42.6% of the market. This suggests a strong demand for properties suitable for couples or solo travelers.
- Together, 1 bedroom and 2 bedrooms properties represent 58.1% of the active Airbnb listings in Markham, indicating a high concentration in these sizes.
Markham Vacation Rental Guest Capacity Trends (2025)
Distribution of Listings by Guest Capacity
Guest Capacity Insights for Markham
- The most common guest capacity trend in Markham vacation rentals is listings accommodating 2 guests (24.9%). This suggests the primary traveler segment is likely couples or solo travelers.
- Properties designed for 2 guests and 4 guests dominate the Markham STR market, accounting for 38.5% of listings.
- 12.6% of properties accommodate 6+ guests, serving the market segment for larger families or group travel in Markham.
- On average, properties in Markham are equipped to host 2.4 guests.
Markham Airbnb Booking Patterns (2025): Available vs. Booked Days
Available Days Distribution
Booked Days Distribution
Booking Pattern Insights for Markham
- The most common availability pattern in Markham falls within the 271-366 days range, representing 42.4% of listings. This suggests many properties have significant open periods on their calendars.
- Approximately 72.9% of listings show high availability (181+ days open annually), indicating potential for increased bookings or specific owner usage patterns.
- For booked days, the 91-180 days range is most frequent in Markham (30.3%), reflecting common guest stay durations or potential owner blocking patterns.
- A notable 27.9% of properties secure long booking periods (181+ days booked per year), highlighting successful long-term rental strategies or significant owner usage.
Markham Airbnb Minimum Stay Requirements Analysis
Distribution of Listings by Minimum Night Requirement
1 Night
116 listings
34.8% of total
2 Nights
48 listings
14.4% of total
3 Nights
32 listings
9.6% of total
4-6 Nights
26 listings
7.8% of total
7-29 Nights
56 listings
16.8% of total
30+ Nights
55 listings
16.5% of total
Key Insights
- The most prevalent minimum stay requirement in Markham is 1 Night, adopted by 34.8% of listings. This highlights the market's preference for shorter, flexible bookings.
- A significant segment (16.5%) caters to monthly stays (30+ nights) in Markham, pointing to opportunities in the extended-stay market.
Recommendations
- Align with the market by considering a 1 Night minimum stay, as 34.8% of Markham hosts use this setting.
- Explore offering discounts for stays of 30+ nights to attract the 16.5% of the market seeking extended stays.
- Adjust minimum nights based on seasonality – potentially shorter during low season and longer during peak demand periods in Markham.
Markham Airbnb Cancellation Policy Trends Analysis (2025)
Flexible
52 listings
18.7% of total
Moderate
83 listings
29.9% of total
Firm
78 listings
28.1% of total
Strict
65 listings
23.4% of total
Cancellation Policy Insights for Markham
- The prevailing Airbnb cancellation policy trend in Markham is Moderate, used by 29.9% of listings.
- A majority (51.5%) of hosts in Markham utilize Firm or Strict policies, indicating a market where hosts prioritize booking security.
Recommendations for Hosts
- Consider adopting a Moderate policy to align with the 29.9% market standard in Markham.
- Regularly review your cancellation policy against competitors and market demand shifts in Markham.
Markham STR Booking Lead Time Analysis (2025)
Average Booking Lead Time by Month
Booking Lead Time Insights for Markham
- The overall average booking lead time for vacation rentals in Markham is 33 days.
- Guests book furthest in advance for stays during July (average 56 days), likely coinciding with peak travel demand or local events.
- The shortest booking windows occur for stays in December (average 27 days), indicating more last-minute travel plans during this time.
- Seasonally, Summer (47 days avg.) sees the longest lead times, while Winter (28 days avg.) has the shortest, reflecting typical travel planning cycles.
Recommendations for Hosts
- Use the overall average lead time (33 days) as a baseline for your pricing and availability strategy in Markham.
- For July stays, consider implementing length-of-stay discounts or slightly higher rates for bookings made less than 56 days out to capitalize on advance planning.
- Target marketing efforts for the Summer season well in advance (at least 47 days) to capture early planners.
- Monitor your own booking lead times against these Markham averages to identify opportunities for dynamic pricing adjustments.
Popular & Essential Airbnb Amenities in Markham (2025)
Amenity Prevalence
Amenity Insights for Markham
- Essential amenities in Markham that guests expect include: Wifi, Air conditioning, Smoke alarm, Carbon monoxide alarm, Heating. Lacking these (any) could significantly impact bookings.
- Popular amenities like Washer, Hot water, Kitchen are common but not universal. Offering these can provide a competitive edge.
Recommendations for Hosts
- Ensure your listing includes all essential amenities for Markham: Wifi, Air conditioning, Smoke alarm, Carbon monoxide alarm, Heating.
- Prioritize adding missing essentials: Air conditioning, Smoke alarm, Carbon monoxide alarm, Heating.
- Consider adding popular differentiators like Washer or Hot water to increase appeal.
- Highlight unique or less common amenities you offer (e.g., hot tub, dedicated workspace, EV charger) in your listing description and photos.
- Regularly check competitor amenities in Markham to stay competitive.
Markham Airbnb Guest Demographics & Profile Analysis (2025)
Guest Profile Summary for Markham
- The typical guest profile for Airbnb in Markham consists of a mix of domestic (60%) and international guests, often arriving from nearby Toronto, typically belonging to the Post-2000s (Gen Z/Alpha) group (50%), primarily speaking English or Chinese.
- Domestic travelers account for 59.6% of guests.
- Key international markets include Canada (59.6%) and United States (23%).
- Top languages spoken are English (54.5%) followed by Chinese (13.4%).
- A significant demographic segment is the Post-2000s (Gen Z/Alpha) group, representing 50% of guests.
Recommendations for Hosts
- Balance marketing efforts between domestic and international channels based on the guest mix.
- Tailor amenities and listing descriptions to appeal to the dominant Post-2000s (Gen Z/Alpha) demographic (e.g., highlight fast WiFi, smart home features, local guides).
- Highlight unique local experiences or amenities relevant to the primary guest profile.
- Consider seasonal promotions aligned with peak travel times for key origin markets.
Nearby Short-Term Rental Market Comparison
How does the Markham Airbnb market stack up against its neighbors? Compare key performance metrics like average monthly revenue, ADR, and occupancy rates in surrounding areas to understand the broader regional STR landscape.
| Market | Active Properties | Monthly Revenue | Daily Rate | Avg. Occupancy |
|---|---|---|---|---|
| Town of Mansfield | 58 | $4,670 | $517.93 | 32% |
| Town of West Seneca | 15 | $4,337 | $246.11 | 52% |
| Town of Porter | 25 | $4,243 | $300.26 | 55% |
| Town of Ellicottville | 201 | $3,840 | $380.95 | 36% |
| North East Township | 34 | $3,530 | $264.33 | 48% |
| Town of Elma | 10 | $3,377 | $418.28 | 48% |
| Niagara-on-the-Lake | 413 | $3,358 | $265.20 | 44% |
| Town of Orchard Park | 38 | $3,302 | $252.95 | 46% |
| Tonawanda Town | 21 | $3,213 | $206.17 | 53% |
| Town of Wilson | 27 | $3,195 | $257.32 | 48% |