Leeds and the Thousand Islands Airbnb Market Analysis 2025: Short Term Rental Data & Vacation Rental Statistics in Ontario, Canada
Is Airbnb profitable in Leeds and the Thousand Islands in 2025? Explore comprehensive Airbnb analytics for Leeds and the Thousand Islands, Ontario, Canada to uncover income potential. This 2025 STR market report for Leeds and the Thousand Islands, based on AirROI data from April 2024 to March 2025, reveals key trends in the niche market of 91 active listings.
Whether you're considering an Airbnb investment in Leeds and the Thousand Islands, optimizing your existing vacation rental, or exploring rental arbitrage opportunities, understanding the Leeds and the Thousand Islands Airbnb data is crucial. Leveraging the low regulation environment is key to maximizing your short term rental income potential. Let's dive into the specifics.
Key Leeds and the Thousand Islands Airbnb Performance Metrics Overview
Monthly Airbnb Revenue Variations & Income Potential in Leeds and the Thousand Islands (2025)
Understanding the monthly revenue variations for Airbnb listings in Leeds and the Thousand Islands is key to maximizing your short term rental income potential. Seasonality significantly impacts earnings. Our analysis, based on data from the past 12 months, shows that the peak revenue month for STRs in Leeds and the Thousand Islands is typically July, while March often presents the lowest earnings, highlighting opportunities for strategic pricing adjustments during shoulder and low seasons. Explore the typical Airbnb income in Leeds and the Thousand Islands across different performance tiers:
- Best-in-class properties (Top 10%) achieve $5,562+ monthly, often utilizing dynamic pricing and superior guest experiences.
- Strong performing properties (Top 25%) earn $3,727 or more, indicating effective management and desirable locations/amenities.
- Typical properties (Median) generate around $2,199 per month, representing the average market performance.
- Entry-level properties (Bottom 25%) see earnings around $1,190, often with potential for optimization.
Average Monthly Airbnb Earnings Trend in Leeds and the Thousand Islands
Leeds and the Thousand Islands Airbnb Occupancy Rate Trends (2025)
Maximize your bookings by understanding the Leeds and the Thousand Islands STR occupancy trends. Seasonal demand shifts significantly influence how often properties are booked. Typically, Julysees the highest demand (peak season occupancy), while January experiences the lowest (low season). Effective strategies, like adjusting minimum stays or offering promotions, can boost occupancy during slower periods. Here's how different property tiers perform in Leeds and the Thousand Islands:
- Best-in-class properties (Top 10%) achieve 78%+ occupancy, indicating high desirability and potentially optimized availability.
- Strong performing properties (Top 25%) maintain 61% or higher occupancy, suggesting good market fit and guest satisfaction.
- Typical properties (Median) have an occupancy rate around 41%.
- Entry-level properties (Bottom 25%) average 21% occupancy, potentially facing higher vacancy.
Average Monthly Occupancy Rate Trend in Leeds and the Thousand Islands
Average Daily Rate (ADR) Airbnb Trends in Leeds and the Thousand Islands (2025)
Effective short term rental pricing strategy in Leeds and the Thousand Islands involves understanding monthly ADR fluctuations. The Average Daily Rate (ADR) for Airbnb in Leeds and the Thousand Islands typically peaks in July and dips lowest during January. Leveraging Airbnb dynamic pricing tools or strategies based on this seasonality can significantly boost revenue. Here's a look at the typical nightly rates achieved:
- Best-in-class properties (Top 10%) command rates of $404+ per night, often due to premium features or locations.
- Strong performing properties (Top 25%) achieve nightly rates of $272 or more.
- Typical properties (Median) charge around $189 per night.
- Entry-level properties (Bottom 25%) earn around $140 per night.
Average Daily Rate (ADR) Trend by Month in Leeds and the Thousand Islands
Get Live Leeds and the Thousand Islands Market Intelligence 👇

Explore Real-time Analytics
Airbnb Seasonality Analysis & Trends in Leeds and the Thousand Islands (2025)
Peak Season (July, August, June)
- Revenue averages $4,558 per month
- Occupancy rates average 57.0%
- Daily rates average $251
Shoulder Season
- Revenue averages $2,558 per month
- Occupancy maintains around 41.8%
- Daily rates hold near $234
Low Season (January, February, March)
- Revenue drops to average $1,595 per month
- Occupancy decreases to average 30.6%
- Daily rates adjust to average $221
Seasonality Insights for Leeds and the Thousand Islands
- The Airbnb seasonality in Leeds and the Thousand Islands shows highly seasonal trends requiring careful strategy. While the sections above show seasonal averages, it's also insightful to look at the extremes:
- During the high season, the absolute peak month showcases Leeds and the Thousand Islands's highest earning potential, with monthly revenues capable of climbing to $5,142, occupancy reaching a high of 65.7%, and ADRs peaking at $254.
- Conversely, the slowest single month of the year, typically falling within the low season, marks the market's lowest point. In this month, revenue might dip to $1,421, occupancy could drop to 28.7%, and ADRs may adjust down to $220.
- Understanding both the seasonal averages and these monthly peaks and troughs in revenue, occupancy, and ADR is crucial for maximizing your Airbnb profit potential in Leeds and the Thousand Islands.
Seasonal Strategies for Maximizing Profit
- Peak Season: Maximize revenue through premium pricing and potentially longer minimum stays. Ensure high availability.
- Low Season: Offer competitive pricing, special promotions (e.g., extended stay discounts), and flexible cancellation policies. Target off-season travelers like remote workers or budget-conscious guests.
- Shoulder Seasons: Implement dynamic pricing that balances peak and low rates. Target weekend travelers or specific events. Offer slightly more flexible terms than peak season.
- Regularly analyze your own performance against these Leeds and the Thousand Islands seasonality benchmarks and adjust your pricing and availability strategy accordingly.
Best Areas for Airbnb Investment in Leeds and the Thousand Islands (2025)
Exploring the top neighborhoods for short-term rentals in Leeds and the Thousand Islands? This section highlights key areas, outlining why they are attractive for hosts and guests, along with notable local attractions. Consider these locations based on your target guest profile and investment strategy.
| Neighborhood / Area | Why Host Here? (Target Guests & Appeal) | Key Attractions & Landmarks |
|---|---|---|
| Leeds City Centre | Vibrant urban hub with rich history and modern amenities. Attracts tourists for shopping, dining, and cultural experiences, making it ideal for short-term rentals. | Royal Armouries Museum, Leeds Art Gallery, Trinity Leeds Shopping Centre, O2 Academy Leeds, Leeds City Market |
| Headingley | Popular with students and young professionals, Headingley is known for its lively atmosphere, eateries, and close proximity to universities. Great for targeting the student market. | Headingley Stadium, Woodhouse Moor, Bottoms Up Brewery, The Leeds Library, Local pubs and cafes |
| Horsforth | Charming suburb with a friendly community feel, popular among families. Good transport links to the city centre make it convenient for visitors looking for a quieter stay. | Horsforth Town Centre, Golden Acre Park, Local restaurants, The Old Ball, Art Gallery |
| Meanwood | Up-and-coming area with a mix of green spaces and bustling local shops. Attractive to people looking for a suburban feel with easy access to the city. | Meanwood Valley Trail, Meanwood Park, Local cafes, Artisan shops, Great parks |
| Cardiff Bay | A picturesque waterfront area with numerous attractions, dining, and leisure options, making it an appealing destination for tourists. | Wales Millennium Centre, Cardiff Bay Barrage, Stonehenge, Mermaid Quay, Cardiff International White Water |
| Thousand Islands National Park | A stunning natural area renowned for its outdoor activities and picturesque views. Ideal for vacation rentals for nature enthusiasts and tourists. | Boldt Castle, Thousand Islands Bridge, Alexandria Bay, Outdoor water activities, Nature trails |
| Gananoque | The gateway to the Thousand Islands with a charming downtown area and proximity to parks and natural attractions. Great for family vacations. | Gananoque Boat Line, Canalways Theatre, Thousand Islands Playhouse, St. Lawrence Park, Local restaurants |
| Ile Royale | Less crowded, it offers a unique experience with natural beauty and fewer tourists. Perfect for those who want a peaceful getaway in a beautiful setting. | Historic redoubts, Parks, Water activities, Nature trails, Scenic views |
Understanding Airbnb License Requirements & STR Laws in Leeds and the Thousand Islands (2025)
While Leeds and the Thousand Islands, Ontario, Canada currently shows low STR regulations, specific Airbnb license requirements might still exist or change. Always verify the latest short term rental regulations and Airbnb license requirements directly with local government authorities for Leeds and the Thousand Islands to ensure full compliance before hosting.
(Source: AirROI data, 2025, finding no licensed listings among those analyzed)
Top Performing Airbnb Properties in Leeds and the Thousand Islands (2025)
Benchmark your potential! Explore examples of top-performing Airbnb properties in Leeds and the Thousand Islandsbased on Trailing Twelve Month (TTM) revenue. Analyze their characteristics, revenue, occupancy rate, and ADR to understand what drives success in this market.
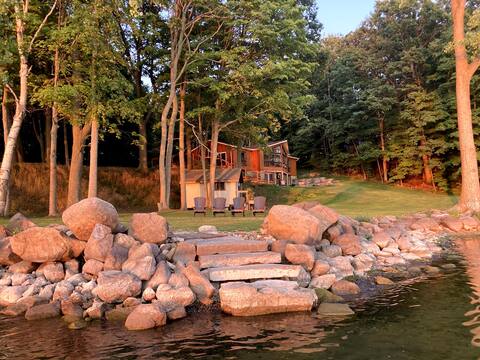
Your 1000 Islands getaway awaits
Entire Place • 4 bedrooms
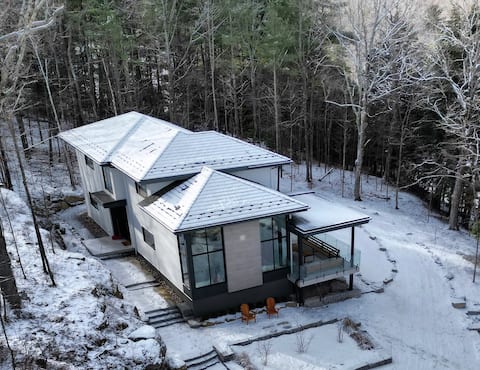
Lake house on Rideau Lakes
Entire Place • 4 bedrooms
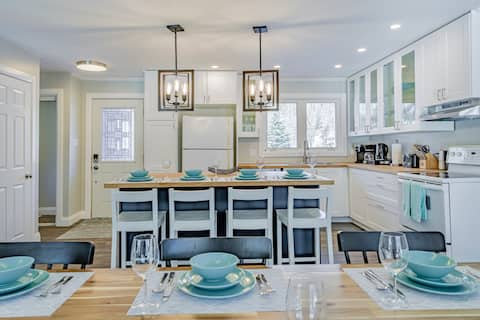
Marble Rock Retreat: Elegant Riverside Escape
Entire Place • 4 bedrooms
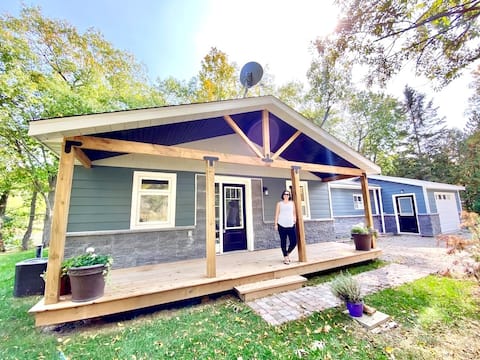
The Riverside Retreat, Tree-Lined Cottage
Entire Place • 3 bedrooms
Grippen Lake Getaway: Waterfront Cottage for 10
Entire Place • 4 bedrooms
Stunning views! 3 bed/2 bath waterfront Lakehouse
Entire Place • 3 bedrooms
Note: Performance varies based on location, size, amenities, seasonality, and management quality. Data reflects the past 12 months.
Top Performing Airbnb Hosts in Leeds and the Thousand Islands (2025)
Learn from the best! This table showcases top-performing Airbnb hosts in Leeds and the Thousand Islands based on the number of properties managed and estimated total revenue over the past year. Analyze their scale and performance metrics.
| Host Name | Properties | Grossing Revenue | Stay Reviews | Avg Rating |
|---|---|---|---|---|
| Kimberley | 2 | $102,351 | 232 | 4.88/5.0 |
| David | 5 | $99,124 | 20 | 4.00/5.0 |
| Chris | 1 | $98,399 | 30 | 4.97/5.0 |
| Krzysztof | 1 | $92,145 | 4 | 5.00/5.0 |
| Kylie | 1 | $72,510 | 40 | 4.88/5.0 |
| Julia | 1 | $60,716 | 83 | 4.84/5.0 |
| Danielle | 1 | $59,569 | 35 | 4.91/5.0 |
| Liz | 1 | $59,467 | 81 | 4.91/5.0 |
| Sandi | 1 | $53,127 | 15 | 4.93/5.0 |
| Breathe Vacation Rentals | 1 | $51,112 | 46 | 4.87/5.0 |
Analyzing the strategies of top hosts, such as their property selection, pricing, and guest communication, can offer valuable lessons for optimizing your own Airbnb operations in Leeds and the Thousand Islands.
Dive Deeper: Advanced Leeds and the Thousand Islands STR Market Data (2025)
Ready to unlock more insights? AirROI provides access to advanced metrics and comprehensive Airbnb data for Leeds and the Thousand Islands. Explore detailed analytics beyond this report to refine your investment strategy, optimize pricing, and maximize your vacation rental profits.
Explore Advanced MetricsLeeds and the Thousand Islands Short-Term Rental Market Composition (2025): Property & Room Types
Room Type Distribution
Property Type Distribution
Market Composition Insights for Leeds and the Thousand Islands
- The Leeds and the Thousand Islands Airbnb market composition is heavily skewed towards Entire Home/Apt listings, which make up 90.1% of the 91 active rentals. This indicates strong guest preference for privacy and space.
- Looking at the property type distribution in Leeds and the Thousand Islands, House properties are the most common (61.5%), reflecting the local real estate landscape.
- Houses represent a significant 61.5% portion, catering likely to families or larger groups.
- The presence of 8.8% Hotel/Boutique listings indicates integration with traditional hospitality.
- Smaller segments like apartment/condo, unique stays (combined 5.5%) offer potential for unique stay experiences.
Leeds and the Thousand Islands Airbnb Room Capacity Analysis (2025): Bedroom Distribution
Distribution of Listings by Number of Bedrooms
Room Capacity Insights for Leeds and the Thousand Islands
- The dominant room capacity in Leeds and the Thousand Islands is 1 bedroom listings, making up 24.2% of the market. This suggests a strong demand for properties suitable for couples or solo travelers.
- Together, 1 bedroom and 2 bedrooms properties represent 48.4% of the active Airbnb listings in Leeds and the Thousand Islands, indicating a high concentration in these sizes.
- A significant 40.7% of listings offer 3+ bedrooms, catering to larger groups and families seeking more space in Leeds and the Thousand Islands.
Leeds and the Thousand Islands Vacation Rental Guest Capacity Trends (2025)
Distribution of Listings by Guest Capacity
Guest Capacity Insights for Leeds and the Thousand Islands
- The most common guest capacity trend in Leeds and the Thousand Islands vacation rentals is listings accommodating 8+ guests (23.1%). This suggests the primary traveler segment is likely larger groups.
- Properties designed for 8+ guests and 2 guests dominate the Leeds and the Thousand Islands STR market, accounting for 44.0% of listings.
- 45.1% of properties accommodate 6+ guests, serving the market segment for larger families or group travel in Leeds and the Thousand Islands.
- On average, properties in Leeds and the Thousand Islands are equipped to host 4.7 guests.
Leeds and the Thousand Islands Airbnb Booking Patterns (2025): Available vs. Booked Days
Available Days Distribution
Booked Days Distribution
Booking Pattern Insights for Leeds and the Thousand Islands
- The most common availability pattern in Leeds and the Thousand Islands falls within the 271-366 days range, representing 47.3% of listings. This suggests many properties have significant open periods on their calendars.
- Approximately 86.9% of listings show high availability (181+ days open annually), indicating potential for increased bookings or specific owner usage patterns.
- For booked days, the 91-180 days range is most frequent in Leeds and the Thousand Islands (38.5%), reflecting common guest stay durations or potential owner blocking patterns.
- A notable 15.4% of properties secure long booking periods (181+ days booked per year), highlighting successful long-term rental strategies or significant owner usage.
Leeds and the Thousand Islands Airbnb Minimum Stay Requirements Analysis
Distribution of Listings by Minimum Night Requirement
1 Night
19 listings
22.4% of total
2 Nights
30 listings
35.3% of total
3 Nights
16 listings
18.8% of total
4-6 Nights
9 listings
10.6% of total
7-29 Nights
3 listings
3.5% of total
30+ Nights
8 listings
9.4% of total
Key Insights
- The most prevalent minimum stay requirement in Leeds and the Thousand Islands is 2 Nights, adopted by 35.3% of listings. This highlights the market's preference for shorter, flexible bookings.
Recommendations
- Align with the market by considering a 2 Nights minimum stay, as 35.3% of Leeds and the Thousand Islands hosts use this setting.
- If feasible, allowing 1-night stays, especially midweek or during low season, could capture last-minute bookings, as only 22.4% currently do.
- Explore offering discounts for stays of 30+ nights to attract the 9.4% of the market seeking extended stays.
- Adjust minimum nights based on seasonality – potentially shorter during low season and longer during peak demand periods in Leeds and the Thousand Islands.
Leeds and the Thousand Islands Airbnb Cancellation Policy Trends Analysis (2025)
Super Strict 60 Days
2 listings
2.5% of total
Flexible
19 listings
23.5% of total
Moderate
16 listings
19.8% of total
Firm
25 listings
30.9% of total
Strict
19 listings
23.5% of total
Cancellation Policy Insights for Leeds and the Thousand Islands
- The prevailing Airbnb cancellation policy trend in Leeds and the Thousand Islands is Firm, used by 30.9% of listings.
- A majority (54.4%) of hosts in Leeds and the Thousand Islands utilize Firm or Strict policies, indicating a market where hosts prioritize booking security.
Recommendations for Hosts
- Consider adopting a Firm policy to align with the 30.9% market standard in Leeds and the Thousand Islands.
- Regularly review your cancellation policy against competitors and market demand shifts in Leeds and the Thousand Islands.
Leeds and the Thousand Islands STR Booking Lead Time Analysis (2025)
Average Booking Lead Time by Month
Booking Lead Time Insights for Leeds and the Thousand Islands
- The overall average booking lead time for vacation rentals in Leeds and the Thousand Islands is 66 days.
- Guests book furthest in advance for stays during July (average 112 days), likely coinciding with peak travel demand or local events.
- The shortest booking windows occur for stays in February (average 25 days), indicating more last-minute travel plans during this time.
- Seasonally, Summer (95 days avg.) sees the longest lead times, while Winter (35 days avg.) has the shortest, reflecting typical travel planning cycles.
Recommendations for Hosts
- Use the overall average lead time (66 days) as a baseline for your pricing and availability strategy in Leeds and the Thousand Islands.
- For July stays, consider implementing length-of-stay discounts or slightly higher rates for bookings made less than 112 days out to capitalize on advance planning.
- Target marketing efforts for the Summer season well in advance (at least 95 days) to capture early planners.
- Monitor your own booking lead times against these Leeds and the Thousand Islands averages to identify opportunities for dynamic pricing adjustments.
Popular & Essential Airbnb Amenities in Leeds and the Thousand Islands (2025)
Amenity Prevalence
Amenity Insights for Leeds and the Thousand Islands
- Essential amenities in Leeds and the Thousand Islands that guests expect include: Smoke alarm, Wifi. Lacking these (any) could significantly impact bookings.
- Popular amenities like Heating, Kitchen, Hot water are common but not universal. Offering these can provide a competitive edge.
Recommendations for Hosts
- Ensure your listing includes all essential amenities for Leeds and the Thousand Islands: Smoke alarm, Wifi.
- Prioritize adding missing essentials: Smoke alarm, Wifi.
- Consider adding popular differentiators like Heating or Kitchen to increase appeal.
- Highlight unique or less common amenities you offer (e.g., hot tub, dedicated workspace, EV charger) in your listing description and photos.
- Regularly check competitor amenities in Leeds and the Thousand Islands to stay competitive.
Leeds and the Thousand Islands Airbnb Guest Demographics & Profile Analysis (2025)
Guest Profile Summary for Leeds and the Thousand Islands
- The typical guest profile for Airbnb in Leeds and the Thousand Islands consists of primarily domestic travelers (66%), often arriving from nearby Toronto, typically belonging to the Post-2000s (Gen Z/Alpha) group (50%), primarily speaking English or French.
- Domestic travelers account for 65.5% of guests.
- Key international markets include Canada (65.5%) and United States (19.3%).
- Top languages spoken are English (54.9%) followed by French (21.1%).
- A significant demographic segment is the Post-2000s (Gen Z/Alpha) group, representing 50% of guests.
Recommendations for Hosts
- Target domestic marketing efforts towards travelers from Toronto and Ottawa.
- Tailor amenities and listing descriptions to appeal to the dominant Post-2000s (Gen Z/Alpha) demographic (e.g., highlight fast WiFi, smart home features, local guides).
- Highlight unique local experiences or amenities relevant to the primary guest profile.
- Consider seasonal promotions aligned with peak travel times for key origin markets.
Nearby Short-Term Rental Market Comparison
How does the Leeds and the Thousand Islands Airbnb market stack up against its neighbors? Compare key performance metrics like average monthly revenue, ADR, and occupancy rates in surrounding areas to understand the broader regional STR landscape.
| Market | Active Properties | Monthly Revenue | Daily Rate | Avg. Occupancy |
|---|---|---|---|---|
| Town of Trenton | 11 | $8,040 | $458.56 | 54% |
| Cantley | 22 | $3,741 | $242.96 | 50% |
| Carrying Place | 20 | $3,737 | $315.96 | 48% |
| Town of Pittsford | 53 | $3,628 | $410.81 | 43% |
| Town of Cicero | 33 | $3,611 | $238.12 | 54% |
| Town of Sullivan | 29 | $3,459 | $293.24 | 47% |
| Town of Constantia | 26 | $3,449 | $311.45 | 38% |
| Town of Lenox | 20 | $3,440 | $328.91 | 46% |
| Town of Vernon | 10 | $3,396 | $206.81 | 47% |
| Rossmore | 10 | $3,345 | $268.20 | 56% |