Lambton Shores Airbnb Market Analysis 2025: Short Term Rental Data & Vacation Rental Statistics in Ontario, Canada
Is Airbnb profitable in Lambton Shores in 2025? Explore comprehensive Airbnb analytics for Lambton Shores, Ontario, Canada to uncover income potential. This 2025 STR market report for Lambton Shores, based on AirROI data from April 2024 to March 2025, reveals key trends in the market of 372 active listings.
Whether you're considering an Airbnb investment in Lambton Shores, optimizing your existing vacation rental, or exploring rental arbitrage opportunities, understanding the Lambton Shores Airbnb data is crucial. Understanding the local regulations is key to maximizing your short term rental income potential. Let's dive into the specifics.
Key Lambton Shores Airbnb Performance Metrics Overview
Monthly Airbnb Revenue Variations & Income Potential in Lambton Shores (2025)
Understanding the monthly revenue variations for Airbnb listings in Lambton Shores is key to maximizing your short term rental income potential. Seasonality significantly impacts earnings. Our analysis, based on data from the past 12 months, shows that the peak revenue month for STRs in Lambton Shores is typically August, while March often presents the lowest earnings, highlighting opportunities for strategic pricing adjustments during shoulder and low seasons. Explore the typical Airbnb income in Lambton Shores across different performance tiers:
- Best-in-class properties (Top 10%) achieve $6,669+ monthly, often utilizing dynamic pricing and superior guest experiences.
- Strong performing properties (Top 25%) earn $4,289 or more, indicating effective management and desirable locations/amenities.
- Typical properties (Median) generate around $2,438 per month, representing the average market performance.
- Entry-level properties (Bottom 25%) see earnings around $1,194, often with potential for optimization.
Average Monthly Airbnb Earnings Trend in Lambton Shores
Lambton Shores Airbnb Occupancy Rate Trends (2025)
Maximize your bookings by understanding the Lambton Shores STR occupancy trends. Seasonal demand shifts significantly influence how often properties are booked. Typically, Augustsees the highest demand (peak season occupancy), while January experiences the lowest (low season). Effective strategies, like adjusting minimum stays or offering promotions, can boost occupancy during slower periods. Here's how different property tiers perform in Lambton Shores:
- Best-in-class properties (Top 10%) achieve 69%+ occupancy, indicating high desirability and potentially optimized availability.
- Strong performing properties (Top 25%) maintain 50% or higher occupancy, suggesting good market fit and guest satisfaction.
- Typical properties (Median) have an occupancy rate around 32%.
- Entry-level properties (Bottom 25%) average 17% occupancy, potentially facing higher vacancy.
Average Monthly Occupancy Rate Trend in Lambton Shores
Average Daily Rate (ADR) Airbnb Trends in Lambton Shores (2025)
Effective short term rental pricing strategy in Lambton Shores involves understanding monthly ADR fluctuations. The Average Daily Rate (ADR) for Airbnb in Lambton Shores typically peaks in August and dips lowest during February. Leveraging Airbnb dynamic pricing tools or strategies based on this seasonality can significantly boost revenue. Here's a look at the typical nightly rates achieved:
- Best-in-class properties (Top 10%) command rates of $434+ per night, often due to premium features or locations.
- Strong performing properties (Top 25%) achieve nightly rates of $321 or more.
- Typical properties (Median) charge around $233 per night.
- Entry-level properties (Bottom 25%) earn around $163 per night.
Average Daily Rate (ADR) Trend by Month in Lambton Shores
Get Live Lambton Shores Market Intelligence 👇

Explore Real-time Analytics
Airbnb Seasonality Analysis & Trends in Lambton Shores (2025)
Peak Season (August, July, June)
- Revenue averages $5,668 per month
- Occupancy rates average 54.2%
- Daily rates average $294
Shoulder Season
- Revenue averages $2,633 per month
- Occupancy maintains around 30.6%
- Daily rates hold near $255
Low Season (January, February, March)
- Revenue drops to average $1,722 per month
- Occupancy decreases to average 25.9%
- Daily rates adjust to average $231
Seasonality Insights for Lambton Shores
- The Airbnb seasonality in Lambton Shores shows highly seasonal trends requiring careful strategy. While the sections above show seasonal averages, it's also insightful to look at the extremes:
- During the high season, the absolute peak month showcases Lambton Shores's highest earning potential, with monthly revenues capable of climbing to $6,466, occupancy reaching a high of 64.7%, and ADRs peaking at $300.
- Conversely, the slowest single month of the year, typically falling within the low season, marks the market's lowest point. In this month, revenue might dip to $1,583, occupancy could drop to 23.1%, and ADRs may adjust down to $229.
- Understanding both the seasonal averages and these monthly peaks and troughs in revenue, occupancy, and ADR is crucial for maximizing your Airbnb profit potential in Lambton Shores.
Seasonal Strategies for Maximizing Profit
- Peak Season: Maximize revenue through premium pricing and potentially longer minimum stays. Ensure high availability.
- Low Season: Offer competitive pricing, special promotions (e.g., extended stay discounts), and flexible cancellation policies. Target off-season travelers like remote workers or budget-conscious guests.
- Shoulder Seasons: Implement dynamic pricing that balances peak and low rates. Target weekend travelers or specific events. Offer slightly more flexible terms than peak season.
- Regularly analyze your own performance against these Lambton Shores seasonality benchmarks and adjust your pricing and availability strategy accordingly.
Best Areas for Airbnb Investment in Lambton Shores (2025)
Exploring the top neighborhoods for short-term rentals in Lambton Shores? This section highlights key areas, outlining why they are attractive for hosts and guests, along with notable local attractions. Consider these locations based on your target guest profile and investment strategy.
| Neighborhood / Area | Why Host Here? (Target Guests & Appeal) | Key Attractions & Landmarks |
|---|---|---|
| Grand Bend | A popular tourist destination on Lake Huron known for its beautiful sandy beaches and vibrant nightlife. Attracts families and young people seeking summer fun and relaxation by the lake. | Grand Bend Beach, Pinery Provincial Park, Grand Bend Farmers' Market, Huron County Playhouse, local bars and restaurants |
| Lambton Shores | A picturesque township with charming small towns and stunning natural landscapes. Ideal for visitors looking for outdoor activities like hiking, water sports and nature experiences. | Lambton Heritage Museum, Lambton Shores Nature Trails, Kisbeuker's Beach, the scenic Lake Huron coastline, various parks and recreation areas |
| Bayfield | A quaint village known for its historic downtown and close proximity to beaches, offering a cozy atmosphere with art galleries, boutiques, and dining. Suitable for travelers seeking a relaxed getaway. | Bayfield Marina, Huron County Museum, the Village Inn, local art galleries, nearby beaches |
| Forest | A small town with access to nature reserves and nearby Lake Huron. Feels welcoming and laid-back, making it a nice stop for those exploring the area or looking for a quiet place to stay. | Chesley Lake, local parks, smaller community events, hiking trails, farmers markets |
| Thedford | A peaceful community situated near the Ausable River, offering outdoor enthusiasts opportunities for fishing, kayaking, and hiking. Great for those looking for tranquility and nature. | Ausable River, local parks, Thedford Geocaching, businesses involving outdoor activities |
| Warwick | Known for its agricultural landscapes and rural charm. Suitable for visitors interested in farm experiences, rural tourism, and discovering local produce. | farmland tours, local craft stores, community events, Masonville Park |
| Camlachie | A small lakeside community known for its art scene and community events. Ideal for visitors who enjoy art and culture amidst a natural setting. | local art galleries, the nearby lake, community events, parkland areas |
| Northville | A quiet residential area close to the lake, perfect for families looking for outdoor experiences and a peaceful environment. Attracts visitors wanting a more relaxed atmosphere. | local parks, lake access, community centers, nature trails |
Understanding Airbnb License Requirements & STR Laws in Lambton Shores (2025)
With 19% of listings showing registration in 2025, understanding potential Airbnb license requirements is crucial in Lambton Shores. Always verify the latest short term rental regulations and Airbnb license requirements directly with local government authorities for Lambton Shores to ensure full compliance before hosting.
(Source: AirROI data, 2025, based on 19% licensed listings)
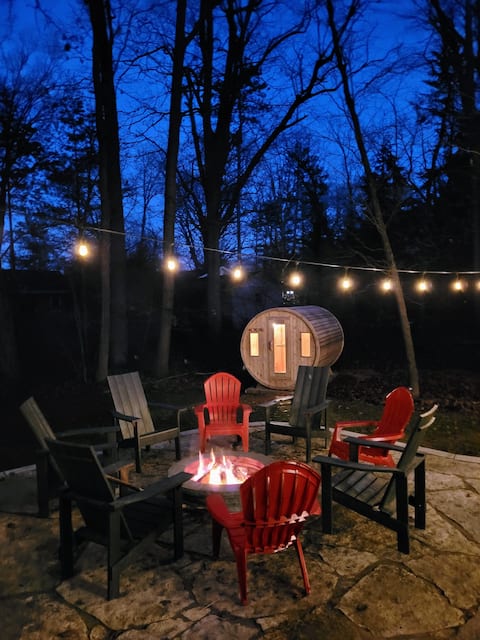
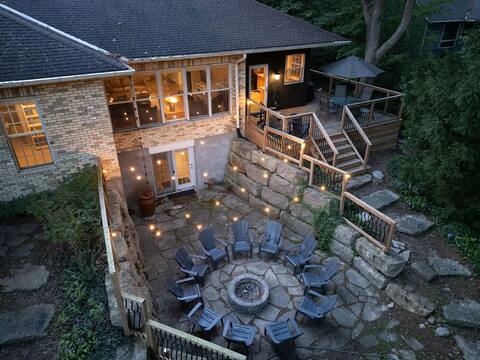
Top Performing Airbnb Properties in Lambton Shores (2025)
Benchmark your potential! Explore examples of top-performing Airbnb properties in Lambton Shoresbased on Trailing Twelve Month (TTM) revenue. Analyze their characteristics, revenue, occupancy rate, and ADR to understand what drives success in this market.

Two Houses GB*6min walk>Beach*Fire Pit*Sauna*5600
Entire Place • 9 bedrooms

The Wolf of Warwick Luxury Modern 6 BR 4.5 BA
Entire Place • 6 bedrooms
Sundara Lakehouse, Sauna/Beach/ Hot tub/Fireplace
Entire Place • 5 bedrooms

Luxury amazing retreat- 5 beds, 4 baths, 10 ppl,
Entire Place • 5 bedrooms
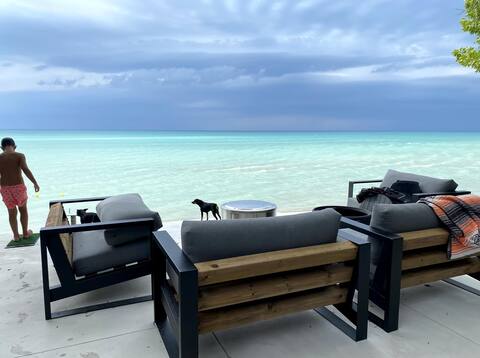
Shoreline Beach House-GrandBend-private beach
Entire Place • 3 bedrooms
Family friendly 7 BR cottage - 700m to Beach
Entire Place • 7 bedrooms
Note: Performance varies based on location, size, amenities, seasonality, and management quality. Data reflects the past 12 months.
Top Performing Airbnb Hosts in Lambton Shores (2025)
Learn from the best! This table showcases top-performing Airbnb hosts in Lambton Shores based on the number of properties managed and estimated total revenue over the past year. Analyze their scale and performance metrics.
| Host Name | Properties | Grossing Revenue | Stay Reviews | Avg Rating |
|---|---|---|---|---|
| Sean | 29 | $862,189 | 774 | 3.18/5.0 |
| Reilly & Kourtney | 21 | $422,694 | 1106 | 4.70/5.0 |
| Ahmed | 3 | $330,176 | 208 | 4.93/5.0 |
| Chelsea | 4 | $317,600 | 162 | 4.64/5.0 |
| Andrea | 2 | $190,325 | 159 | 4.96/5.0 |
| Janita | 3 | $132,468 | 251 | 4.78/5.0 |
| George | 14 | $131,576 | 155 | 4.42/5.0 |
| Krystyna | 1 | $125,483 | 92 | 4.96/5.0 |
| Property | 5 | $124,173 | 164 | 2.88/5.0 |
| Radu | 1 | $118,248 | 60 | 5.00/5.0 |
Analyzing the strategies of top hosts, such as their property selection, pricing, and guest communication, can offer valuable lessons for optimizing your own Airbnb operations in Lambton Shores.
Dive Deeper: Advanced Lambton Shores STR Market Data (2025)
Ready to unlock more insights? AirROI provides access to advanced metrics and comprehensive Airbnb data for Lambton Shores. Explore detailed analytics beyond this report to refine your investment strategy, optimize pricing, and maximize your vacation rental profits.
Explore Advanced MetricsLambton Shores Short-Term Rental Market Composition (2025): Property & Room Types
Room Type Distribution
Property Type Distribution
Market Composition Insights for Lambton Shores
- The Lambton Shores Airbnb market composition is heavily skewed towards Entire Home/Apt listings, which make up 91.9% of the 372 active rentals. This indicates strong guest preference for privacy and space.
- Looking at the property type distribution in Lambton Shores, House properties are the most common (72.8%), reflecting the local real estate landscape.
- Houses represent a significant 72.8% portion, catering likely to families or larger groups.
- The presence of 9.7% Hotel/Boutique listings indicates integration with traditional hospitality.
- Smaller segments like outdoor/unique, others (combined 6.1%) offer potential for unique stay experiences.
Lambton Shores Airbnb Room Capacity Analysis (2025): Bedroom Distribution
Distribution of Listings by Number of Bedrooms
Room Capacity Insights for Lambton Shores
- The dominant room capacity in Lambton Shores is 3 bedrooms listings, making up 25.8% of the market. This suggests a strong demand for properties suitable for families or small groups.
- Together, 3 bedrooms and 4 bedrooms properties represent 47.6% of the active Airbnb listings in Lambton Shores, indicating a high concentration in these sizes.
- A significant 65.1% of listings offer 3+ bedrooms, catering to larger groups and families seeking more space in Lambton Shores.
Lambton Shores Vacation Rental Guest Capacity Trends (2025)
Distribution of Listings by Guest Capacity
Guest Capacity Insights for Lambton Shores
- The most common guest capacity trend in Lambton Shores vacation rentals is listings accommodating 8+ guests (50.5%). This suggests the primary traveler segment is likely larger groups.
- Properties designed for 8+ guests and 6 guests dominate the Lambton Shores STR market, accounting for 70.9% of listings.
- 74.7% of properties accommodate 6+ guests, serving the market segment for larger families or group travel in Lambton Shores.
- On average, properties in Lambton Shores are equipped to host 6.4 guests.
Lambton Shores Airbnb Booking Patterns (2025): Available vs. Booked Days
Available Days Distribution
Booked Days Distribution
Booking Pattern Insights for Lambton Shores
- The most common availability pattern in Lambton Shores falls within the 271-366 days range, representing 50% of listings. This suggests many properties have significant open periods on their calendars.
- Approximately 89.5% of listings show high availability (181+ days open annually), indicating potential for increased bookings or specific owner usage patterns.
- For booked days, the 91-180 days range is most frequent in Lambton Shores (40.3%), reflecting common guest stay durations or potential owner blocking patterns.
- A notable 12.1% of properties secure long booking periods (181+ days booked per year), highlighting successful long-term rental strategies or significant owner usage.
Lambton Shores Airbnb Minimum Stay Requirements Analysis
Distribution of Listings by Minimum Night Requirement
1 Night
77 listings
22.3% of total
2 Nights
175 listings
50.6% of total
3 Nights
35 listings
10.1% of total
4-6 Nights
16 listings
4.6% of total
7-29 Nights
15 listings
4.3% of total
30+ Nights
28 listings
8.1% of total
Key Insights
- The most prevalent minimum stay requirement in Lambton Shores is 2 Nights, adopted by 50.6% of listings. This highlights the market's preference for shorter, flexible bookings.
- A strong majority (72.9%) of the Lambton Shores Airbnb data shows acceptance of very short stays (1-2 nights), indicating a dynamic, high-turnover market.
Recommendations
- Align with the market by considering a 2 Nights minimum stay, as 50.6% of Lambton Shores hosts use this setting.
- If feasible, allowing 1-night stays, especially midweek or during low season, could capture last-minute bookings, as only 22.3% currently do.
- Explore offering discounts for stays of 30+ nights to attract the 8.1% of the market seeking extended stays.
- Adjust minimum nights based on seasonality – potentially shorter during low season and longer during peak demand periods in Lambton Shores.
Lambton Shores Airbnb Cancellation Policy Trends Analysis (2025)
Super Strict 60 Days
5 listings
1.5% of total
Super Strict 30 Days
2 listings
0.6% of total
Flexible
39 listings
11.8% of total
Moderate
78 listings
23.6% of total
Firm
81 listings
24.5% of total
Strict
126 listings
38.1% of total
Cancellation Policy Insights for Lambton Shores
- The prevailing Airbnb cancellation policy trend in Lambton Shores is Strict, used by 38.1% of listings.
- A majority (62.6%) of hosts in Lambton Shores utilize Firm or Strict policies, indicating a market where hosts prioritize booking security.
Recommendations for Hosts
- Consider adopting a Strict policy to align with the 38.1% market standard in Lambton Shores.
- With 38.1% using Strict terms, this is a viable option in Lambton Shores, particularly for high-value properties or during peak demand periods.
- Regularly review your cancellation policy against competitors and market demand shifts in Lambton Shores.
Lambton Shores STR Booking Lead Time Analysis (2025)
Average Booking Lead Time by Month
Booking Lead Time Insights for Lambton Shores
- The overall average booking lead time for vacation rentals in Lambton Shores is 54 days.
- Guests book furthest in advance for stays during July (average 101 days), likely coinciding with peak travel demand or local events.
- The shortest booking windows occur for stays in March (average 30 days), indicating more last-minute travel plans during this time.
- Seasonally, Summer (87 days avg.) sees the longest lead times, while Winter (37 days avg.) has the shortest, reflecting typical travel planning cycles.
Recommendations for Hosts
- Use the overall average lead time (54 days) as a baseline for your pricing and availability strategy in Lambton Shores.
- For July stays, consider implementing length-of-stay discounts or slightly higher rates for bookings made less than 101 days out to capitalize on advance planning.
- Target marketing efforts for the Summer season well in advance (at least 87 days) to capture early planners.
- Monitor your own booking lead times against these Lambton Shores averages to identify opportunities for dynamic pricing adjustments.
Popular & Essential Airbnb Amenities in Lambton Shores (2025)
Amenity Prevalence
Amenity Insights for Lambton Shores
- Essential amenities in Lambton Shores that guests expect include: Smoke alarm, Wifi, Free parking on premises, Air conditioning, TV, Heating, Carbon monoxide alarm, Hot water. Lacking these (any) could significantly impact bookings.
- Popular amenities like Kitchen, BBQ grill are common but not universal. Offering these can provide a competitive edge.
Recommendations for Hosts
- Ensure your listing includes all essential amenities for Lambton Shores: Smoke alarm, Wifi, Free parking on premises, Air conditioning, TV, Heating, Carbon monoxide alarm, Hot water.
- Prioritize adding missing essentials: Smoke alarm, Wifi, Free parking on premises, Air conditioning, TV, Heating, Carbon monoxide alarm, Hot water.
- Consider adding popular differentiators like Kitchen or BBQ grill to increase appeal.
- Highlight unique or less common amenities you offer (e.g., hot tub, dedicated workspace, EV charger) in your listing description and photos.
- Regularly check competitor amenities in Lambton Shores to stay competitive.
Lambton Shores Airbnb Guest Demographics & Profile Analysis (2025)
Guest Profile Summary for Lambton Shores
- The typical guest profile for Airbnb in Lambton Shores consists of primarily domestic travelers (89%), often arriving from nearby Toronto, typically belonging to the Post-2000s (Gen Z/Alpha) group (50%), primarily speaking English or French.
- Domestic travelers account for 88.6% of guests.
- Key international markets include Canada (88.6%) and United States (9.5%).
- Top languages spoken are English (69.7%) followed by French (8.3%).
- A significant demographic segment is the Post-2000s (Gen Z/Alpha) group, representing 50% of guests.
Recommendations for Hosts
- Target domestic marketing efforts towards travelers from Toronto and London.
- Tailor amenities and listing descriptions to appeal to the dominant Post-2000s (Gen Z/Alpha) demographic (e.g., highlight fast WiFi, smart home features, local guides).
- Highlight unique local experiences or amenities relevant to the primary guest profile.
- Consider seasonal promotions aligned with peak travel times for key origin markets.
Nearby Short-Term Rental Market Comparison
How does the Lambton Shores Airbnb market stack up against its neighbors? Compare key performance metrics like average monthly revenue, ADR, and occupancy rates in surrounding areas to understand the broader regional STR landscape.
| Market | Active Properties | Monthly Revenue | Daily Rate | Avg. Occupancy |
|---|---|---|---|---|
| Forester | 11 | $5,685 | $390.48 | 43% |
| Port Sanilac | 30 | $3,765 | $470.85 | 34% |
| Harrison Township | 24 | $3,464 | $248.32 | 50% |
| Lexington | 31 | $3,459 | $385.98 | 43% |
| Grosse Pointe Park | 36 | $3,068 | $224.25 | 43% |
| Ira Township | 17 | $3,063 | $287.30 | 42% |
| Meaford | 129 | $2,843 | $246.44 | 45% |
| Mulmur | 43 | $2,837 | $283.33 | 42% |
| Millcreek Township | 85 | $2,827 | $209.72 | 48% |
| The Blue Mountains | 612 | $2,777 | $285.62 | 36% |