Kingston Airbnb Market Analysis 2025: Short Term Rental Data & Vacation Rental Statistics in Ontario, Canada
Is Airbnb profitable in Kingston in 2025? Explore comprehensive Airbnb analytics for Kingston, Ontario, Canada to uncover income potential. This 2025 STR market report for Kingston, based on AirROI data from April 2024 to March 2025, reveals key trends in the market of 308 active listings.
Whether you're considering an Airbnb investment in Kingston, optimizing your existing vacation rental, or exploring rental arbitrage opportunities, understanding the Kingston Airbnb data is crucial. Navigating the high regulation landscape is key to maximizing your short term rental income potential. Let's dive into the specifics.
Key Kingston Airbnb Performance Metrics Overview
Monthly Airbnb Revenue Variations & Income Potential in Kingston (2025)
Understanding the monthly revenue variations for Airbnb listings in Kingston is key to maximizing your short term rental income potential. Seasonality significantly impacts earnings. Our analysis, based on data from the past 12 months, shows that the peak revenue month for STRs in Kingston is typically June, while February often presents the lowest earnings, highlighting opportunities for strategic pricing adjustments during shoulder and low seasons. Explore the typical Airbnb income in Kingston across different performance tiers:
- Best-in-class properties (Top 10%) achieve $4,640+ monthly, often utilizing dynamic pricing and superior guest experiences.
- Strong performing properties (Top 25%) earn $3,174 or more, indicating effective management and desirable locations/amenities.
- Typical properties (Median) generate around $1,907 per month, representing the average market performance.
- Entry-level properties (Bottom 25%) see earnings around $1,037, often with potential for optimization.
Average Monthly Airbnb Earnings Trend in Kingston
Kingston Airbnb Occupancy Rate Trends (2025)
Maximize your bookings by understanding the Kingston STR occupancy trends. Seasonal demand shifts significantly influence how often properties are booked. Typically, Augustsees the highest demand (peak season occupancy), while February experiences the lowest (low season). Effective strategies, like adjusting minimum stays or offering promotions, can boost occupancy during slower periods. Here's how different property tiers perform in Kingston:
- Best-in-class properties (Top 10%) achieve 85%+ occupancy, indicating high desirability and potentially optimized availability.
- Strong performing properties (Top 25%) maintain 73% or higher occupancy, suggesting good market fit and guest satisfaction.
- Typical properties (Median) have an occupancy rate around 54%.
- Entry-level properties (Bottom 25%) average 30% occupancy, potentially facing higher vacancy.
Average Monthly Occupancy Rate Trend in Kingston
Average Daily Rate (ADR) Airbnb Trends in Kingston (2025)
Effective short term rental pricing strategy in Kingston involves understanding monthly ADR fluctuations. The Average Daily Rate (ADR) for Airbnb in Kingston typically peaks in July and dips lowest during February. Leveraging Airbnb dynamic pricing tools or strategies based on this seasonality can significantly boost revenue. Here's a look at the typical nightly rates achieved:
- Best-in-class properties (Top 10%) command rates of $258+ per night, often due to premium features or locations.
- Strong performing properties (Top 25%) achieve nightly rates of $170 or more.
- Typical properties (Median) charge around $100 per night.
- Entry-level properties (Bottom 25%) earn around $68 per night.
Average Daily Rate (ADR) Trend by Month in Kingston
Get Live Kingston Market Intelligence 👇

Explore Real-time Analytics
Airbnb Seasonality Analysis & Trends in Kingston (2025)
Peak Season (June, August, May)
- Revenue averages $3,074 per month
- Occupancy rates average 54.5%
- Daily rates average $139
Shoulder Season
- Revenue averages $2,546 per month
- Occupancy maintains around 55.7%
- Daily rates hold near $137
Low Season (January, February, March)
- Revenue drops to average $1,482 per month
- Occupancy decreases to average 41.2%
- Daily rates adjust to average $128
Seasonality Insights for Kingston
- The Airbnb seasonality in Kingston shows highly seasonal trends requiring careful strategy. While the sections above show seasonal averages, it's also insightful to look at the extremes:
- During the high season, the absolute peak month showcases Kingston's highest earning potential, with monthly revenues capable of climbing to $3,166, occupancy reaching a high of 66.6%, and ADRs peaking at $140.
- Conversely, the slowest single month of the year, typically falling within the low season, marks the market's lowest point. In this month, revenue might dip to $1,208, occupancy could drop to 38.9%, and ADRs may adjust down to $127.
- Understanding both the seasonal averages and these monthly peaks and troughs in revenue, occupancy, and ADR is crucial for maximizing your Airbnb profit potential in Kingston.
Seasonal Strategies for Maximizing Profit
- Peak Season: Maximize revenue through premium pricing and potentially longer minimum stays. Ensure high availability.
- Low Season: Offer competitive pricing, special promotions (e.g., extended stay discounts), and flexible cancellation policies. Target off-season travelers like remote workers or budget-conscious guests.
- Shoulder Seasons: Implement dynamic pricing that balances peak and low rates. Target weekend travelers or specific events. Offer slightly more flexible terms than peak season.
- Regularly analyze your own performance against these Kingston seasonality benchmarks and adjust your pricing and availability strategy accordingly.
Best Areas for Airbnb Investment in Kingston (2025)
Exploring the top neighborhoods for short-term rentals in Kingston? This section highlights key areas, outlining why they are attractive for hosts and guests, along with notable local attractions. Consider these locations based on your target guest profile and investment strategy.
| Neighborhood / Area | Why Host Here? (Target Guests & Appeal) | Key Attractions & Landmarks |
|---|---|---|
| Downtown Kingston | The heart of Kingston with access to shops, restaurants, and entertainment. Ideal for both business and leisure travelers seeking a vibrant city experience. | Kingston Waterfront, Kingston City Hall, Market Square, Royal Military College of Canada, Rodgers K-Rock Centre |
| The Inner Harbour | A picturesque area with stunning views and nearby attractions. Perfect for tourists wanting to enjoy water activities and scenic walks. | Inner Harbour Marina, Fort Henry, Queen's University, Confederation Basin, City Park |
| Williamsville | A charming neighborhood with a mix of residential and commercial properties. Popular among travelers looking for a local experience with easy access to amenities. | Kingston Centre Shopping Mall, Dominion Park, Local cafes and shops, Private beaches, Community events |
| Cataraqui Town Centre | A shopping hub that attracts visitors for retail therapy. Great for short-term rentals to shoppers and families visiting Kingston. | Cataraqui Town Centre, Bowman Island, Parks nearby, Movie theatres, Dining options |
| Old Fairgrounds | An upcoming area with historical significance. A mix of historic homes and new developments, appealing to those interested in culture and history. | Old Fairgrounds, Historic buildings, Cultural events, Close to downtown, Parks |
| Barriefield | A quaint historic village just outside Kingston. Attracts guests interested in heritage, history, and a peaceful atmosphere. | Canadian National Historic Site, Village charm, Art galleries, Local markets, Scenic views of the river |
| East end Kingston | An area with a variety of housing options and proximity to parks and recreation facilities. Good for families and extended stays. | Parks and green spaces, Shopping centres, Community centers, Local schools, Event venues |
| Amherstview | A suburban neighborhood offering a quieter experience while still being close to Kingston. Appeals to families and those seeking a residential feel. | Lake Ontario, Local parks, School facilities, Family-friendly atmosphere, Community events |
Understanding Airbnb License Requirements & STR Laws in Kingston (2025)
Yes, Kingston, Ontario, Canada enforces high STR regulations. Obtaining a license and ensuring compliance is almost certainly required according to current 2025 STR laws. Always verify the latest short term rental regulations and Airbnb license requirements directly with local government authorities for Kingston to ensure full compliance before hosting.
(Source: AirROI data, 2025, based on 51% licensed listings)
Top Performing Airbnb Properties in Kingston (2025)
Benchmark your potential! Explore examples of top-performing Airbnb properties in Kingstonbased on Trailing Twelve Month (TTM) revenue. Analyze their characteristics, revenue, occupancy rate, and ADR to understand what drives success in this market.

McIntosh Castle near downtown Kingston
Entire Place • 3 bedrooms
Oasis at Brooke Place
Entire Place • 4 bedrooms

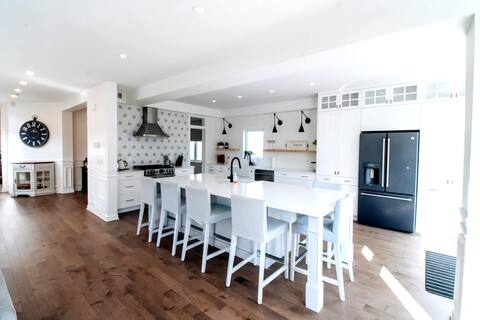
Luxury oasis in the city
Entire Place • 5 bedrooms

Downtown ON Market Square
Entire Place • 3 bedrooms
Kingston Four Bedroom Cottage, Fireplace & Firepit
Entire Place • 4 bedrooms
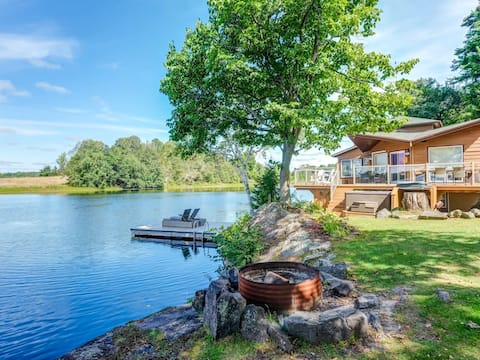
Private waterfront cottage - hot tub & kayaks!
Entire Place • 5 bedrooms
Note: Performance varies based on location, size, amenities, seasonality, and management quality. Data reflects the past 12 months.
Top Performing Airbnb Hosts in Kingston (2025)
Learn from the best! This table showcases top-performing Airbnb hosts in Kingston based on the number of properties managed and estimated total revenue over the past year. Analyze their scale and performance metrics.
| Host Name | Properties | Grossing Revenue | Stay Reviews | Avg Rating |
|---|---|---|---|---|
| Liv | 12 | $254,210 | 447 | 4.57/5.0 |
| Daniel | 4 | $241,906 | 140 | 4.66/5.0 |
| Bryan | 6 | $240,202 | 1253 | 4.89/5.0 |
| Sarah | 4 | $189,877 | 284 | 4.88/5.0 |
| Ji Yeon | 6 | $149,177 | 664 | 4.86/5.0 |
| Limestone | 5 | $135,683 | 937 | 4.79/5.0 |
| Peter | 1 | $132,905 | 15 | 5.00/5.0 |
| Breathe Vacation Rentals | 2 | $114,312 | 135 | 4.71/5.0 |
| Kurt André | 3 | $107,442 | 743 | 4.98/5.0 |
| Joanie | 1 | $105,381 | 7 | 5.00/5.0 |
Analyzing the strategies of top hosts, such as their property selection, pricing, and guest communication, can offer valuable lessons for optimizing your own Airbnb operations in Kingston.
Dive Deeper: Advanced Kingston STR Market Data (2025)
Ready to unlock more insights? AirROI provides access to advanced metrics and comprehensive Airbnb data for Kingston. Explore detailed analytics beyond this report to refine your investment strategy, optimize pricing, and maximize your vacation rental profits.
Explore Advanced MetricsKingston Short-Term Rental Market Composition (2025): Property & Room Types
Room Type Distribution
Property Type Distribution
Market Composition Insights for Kingston
- The Kingston Airbnb market composition is heavily skewed towards Entire Home/Apt listings, which make up 76.6% of the 308 active rentals. This indicates strong guest preference for privacy and space.
- Looking at the property type distribution in Kingston, House properties are the most common (51.3%), reflecting the local real estate landscape.
- Houses represent a significant 51.3% portion, catering likely to families or larger groups.
- Smaller segments like hotel/boutique, outdoor/unique, unique stays (combined 5.2%) offer potential for unique stay experiences.
Kingston Airbnb Room Capacity Analysis (2025): Bedroom Distribution
Distribution of Listings by Number of Bedrooms
Room Capacity Insights for Kingston
- The dominant room capacity in Kingston is 1 bedroom listings, making up 33.4% of the market. This suggests a strong demand for properties suitable for couples or solo travelers.
- Together, 1 bedroom and 2 bedrooms properties represent 59.4% of the active Airbnb listings in Kingston, indicating a high concentration in these sizes.
- A significant 22.3% of listings offer 3+ bedrooms, catering to larger groups and families seeking more space in Kingston.
Kingston Vacation Rental Guest Capacity Trends (2025)
Distribution of Listings by Guest Capacity
Guest Capacity Insights for Kingston
- The most common guest capacity trend in Kingston vacation rentals is listings accommodating 2 guests (26%). This suggests the primary traveler segment is likely couples or solo travelers.
- Properties designed for 2 guests and 4 guests dominate the Kingston STR market, accounting for 50.0% of listings.
- 21.4% of properties accommodate 6+ guests, serving the market segment for larger families or group travel in Kingston.
- On average, properties in Kingston are equipped to host 3.4 guests.
Kingston Airbnb Booking Patterns (2025): Available vs. Booked Days
Available Days Distribution
Booked Days Distribution
Booking Pattern Insights for Kingston
- The most common availability pattern in Kingston falls within the 91-180 days range, representing 34.7% of listings. This suggests many properties have significant open periods on their calendars.
- Approximately 57.5% of listings show high availability (181+ days open annually), indicating potential for increased bookings or specific owner usage patterns.
- For booked days, the 181-270 days range is most frequent in Kingston (36%), reflecting common guest stay durations or potential owner blocking patterns.
- A notable 44.8% of properties secure long booking periods (181+ days booked per year), highlighting successful long-term rental strategies or significant owner usage.
Kingston Airbnb Minimum Stay Requirements Analysis
Distribution of Listings by Minimum Night Requirement
1 Night
112 listings
42.1% of total
2 Nights
66 listings
24.8% of total
3 Nights
6 listings
2.3% of total
4-6 Nights
7 listings
2.6% of total
7-29 Nights
18 listings
6.8% of total
30+ Nights
57 listings
21.4% of total
Key Insights
- The most prevalent minimum stay requirement in Kingston is 1 Night, adopted by 42.1% of listings. This highlights the market's preference for shorter, flexible bookings.
- A strong majority (66.9%) of the Kingston Airbnb data shows acceptance of very short stays (1-2 nights), indicating a dynamic, high-turnover market.
- A significant segment (21.4%) caters to monthly stays (30+ nights) in Kingston, pointing to opportunities in the extended-stay market.
Recommendations
- Align with the market by considering a 1 Night minimum stay, as 42.1% of Kingston hosts use this setting.
- Explore offering discounts for stays of 30+ nights to attract the 21.4% of the market seeking extended stays.
- Adjust minimum nights based on seasonality – potentially shorter during low season and longer during peak demand periods in Kingston.
Kingston Airbnb Cancellation Policy Trends Analysis (2025)
Super Strict 30 Days
3 listings
1.2% of total
Flexible
52 listings
20.2% of total
Moderate
96 listings
37.4% of total
Firm
63 listings
24.5% of total
Strict
43 listings
16.7% of total
Cancellation Policy Insights for Kingston
- The prevailing Airbnb cancellation policy trend in Kingston is Moderate, used by 37.4% of listings.
- There's a relatively balanced mix between guest-friendly (57.6%) and stricter (41.2%) policies, offering choices for different guest needs.
Recommendations for Hosts
- Consider adopting a Moderate policy to align with the 37.4% market standard in Kingston.
- Regularly review your cancellation policy against competitors and market demand shifts in Kingston.
Kingston STR Booking Lead Time Analysis (2025)
Average Booking Lead Time by Month
Booking Lead Time Insights for Kingston
- The overall average booking lead time for vacation rentals in Kingston is 44 days.
- Guests book furthest in advance for stays during June (average 63 days), likely coinciding with peak travel demand or local events.
- The shortest booking windows occur for stays in February (average 30 days), indicating more last-minute travel plans during this time.
- Seasonally, Summer (54 days avg.) sees the longest lead times, while Winter (41 days avg.) has the shortest, reflecting typical travel planning cycles.
Recommendations for Hosts
- Use the overall average lead time (44 days) as a baseline for your pricing and availability strategy in Kingston.
- For June stays, consider implementing length-of-stay discounts or slightly higher rates for bookings made less than 63 days out to capitalize on advance planning.
- Target marketing efforts for the Summer season well in advance (at least 54 days) to capture early planners.
- Monitor your own booking lead times against these Kingston averages to identify opportunities for dynamic pricing adjustments.
Popular & Essential Airbnb Amenities in Kingston (2025)
Amenity Prevalence
Amenity Insights for Kingston
- Essential amenities in Kingston that guests expect include: Smoke alarm, Wifi, Heating, Carbon monoxide alarm. Lacking these (any) could significantly impact bookings.
- Popular amenities like Hot water, Air conditioning, Essentials are common but not universal. Offering these can provide a competitive edge.
Recommendations for Hosts
- Ensure your listing includes all essential amenities for Kingston: Smoke alarm, Wifi, Heating, Carbon monoxide alarm.
- Prioritize adding missing essentials: Smoke alarm, Wifi, Heating, Carbon monoxide alarm.
- Consider adding popular differentiators like Hot water or Air conditioning to increase appeal.
- Highlight unique or less common amenities you offer (e.g., hot tub, dedicated workspace, EV charger) in your listing description and photos.
- Regularly check competitor amenities in Kingston to stay competitive.
Kingston Airbnb Guest Demographics & Profile Analysis (2025)
Guest Profile Summary for Kingston
- The typical guest profile for Airbnb in Kingston consists of primarily domestic travelers (77%), often arriving from nearby Toronto, typically belonging to the Post-2000s (Gen Z/Alpha) group (50%), primarily speaking English or French.
- Domestic travelers account for 76.9% of guests.
- Key international markets include Canada (76.9%) and United States (10.3%).
- Top languages spoken are English (57.2%) followed by French (18.5%).
- A significant demographic segment is the Post-2000s (Gen Z/Alpha) group, representing 50% of guests.
Recommendations for Hosts
- Target domestic marketing efforts towards travelers from Toronto and Ottawa.
- Tailor amenities and listing descriptions to appeal to the dominant Post-2000s (Gen Z/Alpha) demographic (e.g., highlight fast WiFi, smart home features, local guides).
- Highlight unique local experiences or amenities relevant to the primary guest profile.
- Consider seasonal promotions aligned with peak travel times for key origin markets.
Nearby Short-Term Rental Market Comparison
How does the Kingston Airbnb market stack up against its neighbors? Compare key performance metrics like average monthly revenue, ADR, and occupancy rates in surrounding areas to understand the broader regional STR landscape.
| Market | Active Properties | Monthly Revenue | Daily Rate | Avg. Occupancy |
|---|---|---|---|---|
| Town of Trenton | 11 | $8,040 | $458.56 | 54% |
| Cantley | 22 | $3,741 | $242.96 | 50% |
| Carrying Place | 20 | $3,737 | $315.96 | 48% |
| Town of Pittsford | 53 | $3,628 | $410.81 | 43% |
| Town of Cicero | 33 | $3,611 | $238.12 | 54% |
| Town of Sullivan | 29 | $3,459 | $293.24 | 47% |
| Town of Constantia | 26 | $3,449 | $311.45 | 38% |
| Town of Lenox | 20 | $3,440 | $328.91 | 46% |
| Town of Vernon | 10 | $3,396 | $206.81 | 47% |
| Rossmore | 10 | $3,345 | $268.20 | 56% |