Hamilton Airbnb Market Analysis 2025: Short Term Rental Data & Vacation Rental Statistics in Ontario, Canada
Is Airbnb profitable in Hamilton in 2025? Explore comprehensive Airbnb analytics for Hamilton, Ontario, Canada to uncover income potential. This 2025 STR market report for Hamilton, based on AirROI data from April 2024 to March 2025, reveals key trends in the market of 935 active listings.
Whether you're considering an Airbnb investment in Hamilton, optimizing your existing vacation rental, or exploring rental arbitrage opportunities, understanding the Hamilton Airbnb data is crucial. Leveraging the low regulation environment is key to maximizing your short term rental income potential. Let's dive into the specifics.
Key Hamilton Airbnb Performance Metrics Overview
Monthly Airbnb Revenue Variations & Income Potential in Hamilton (2025)
Understanding the monthly revenue variations for Airbnb listings in Hamilton is key to maximizing your short term rental income potential. Seasonality significantly impacts earnings. Our analysis, based on data from the past 12 months, shows that the peak revenue month for STRs in Hamilton is typically May, while March often presents the lowest earnings, highlighting opportunities for strategic pricing adjustments during shoulder and low seasons. Explore the typical Airbnb income in Hamilton across different performance tiers:
- Best-in-class properties (Top 10%) achieve $3,892+ monthly, often utilizing dynamic pricing and superior guest experiences.
- Strong performing properties (Top 25%) earn $2,393 or more, indicating effective management and desirable locations/amenities.
- Typical properties (Median) generate around $1,357 per month, representing the average market performance.
- Entry-level properties (Bottom 25%) see earnings around $644, often with potential for optimization.
Average Monthly Airbnb Earnings Trend in Hamilton
Hamilton Airbnb Occupancy Rate Trends (2025)
Maximize your bookings by understanding the Hamilton STR occupancy trends. Seasonal demand shifts significantly influence how often properties are booked. Typically, Augustsees the highest demand (peak season occupancy), while March experiences the lowest (low season). Effective strategies, like adjusting minimum stays or offering promotions, can boost occupancy during slower periods. Here's how different property tiers perform in Hamilton:
- Best-in-class properties (Top 10%) achieve 86%+ occupancy, indicating high desirability and potentially optimized availability.
- Strong performing properties (Top 25%) maintain 70% or higher occupancy, suggesting good market fit and guest satisfaction.
- Typical properties (Median) have an occupancy rate around 46%.
- Entry-level properties (Bottom 25%) average 23% occupancy, potentially facing higher vacancy.
Average Monthly Occupancy Rate Trend in Hamilton
Average Daily Rate (ADR) Airbnb Trends in Hamilton (2025)
Effective short term rental pricing strategy in Hamilton involves understanding monthly ADR fluctuations. The Average Daily Rate (ADR) for Airbnb in Hamilton typically peaks in July and dips lowest during February. Leveraging Airbnb dynamic pricing tools or strategies based on this seasonality can significantly boost revenue. Here's a look at the typical nightly rates achieved:
- Best-in-class properties (Top 10%) command rates of $227+ per night, often due to premium features or locations.
- Strong performing properties (Top 25%) achieve nightly rates of $133 or more.
- Typical properties (Median) charge around $83 per night.
- Entry-level properties (Bottom 25%) earn around $57 per night.
Average Daily Rate (ADR) Trend by Month in Hamilton
Get Live Hamilton Market Intelligence 👇

Explore Real-time Analytics
Airbnb Seasonality Analysis & Trends in Hamilton (2025)
Peak Season (May, June, August)
- Revenue averages $2,529 per month
- Occupancy rates average 50.5%
- Daily rates average $130
Shoulder Season
- Revenue averages $1,977 per month
- Occupancy maintains around 48.7%
- Daily rates hold near $126
Low Season (January, February, March)
- Revenue drops to average $1,188 per month
- Occupancy decreases to average 39.6%
- Daily rates adjust to average $113
Seasonality Insights for Hamilton
- The Airbnb seasonality in Hamilton shows highly seasonal trends requiring careful strategy. While the sections above show seasonal averages, it's also insightful to look at the extremes:
- During the high season, the absolute peak month showcases Hamilton's highest earning potential, with monthly revenues capable of climbing to $2,588, occupancy reaching a high of 58.0%, and ADRs peaking at $132.
- Conversely, the slowest single month of the year, typically falling within the low season, marks the market's lowest point. In this month, revenue might dip to $1,110, occupancy could drop to 37.3%, and ADRs may adjust down to $112.
- Understanding both the seasonal averages and these monthly peaks and troughs in revenue, occupancy, and ADR is crucial for maximizing your Airbnb profit potential in Hamilton.
Seasonal Strategies for Maximizing Profit
- Peak Season: Maximize revenue through premium pricing and potentially longer minimum stays. Ensure high availability.
- Low Season: Offer competitive pricing, special promotions (e.g., extended stay discounts), and flexible cancellation policies. Target off-season travelers like remote workers or budget-conscious guests.
- Shoulder Seasons: Implement dynamic pricing that balances peak and low rates. Target weekend travelers or specific events. Offer slightly more flexible terms than peak season.
- Regularly analyze your own performance against these Hamilton seasonality benchmarks and adjust your pricing and availability strategy accordingly.
Best Areas for Airbnb Investment in Hamilton (2025)
Exploring the top neighborhoods for short-term rentals in Hamilton? This section highlights key areas, outlining why they are attractive for hosts and guests, along with notable local attractions. Consider these locations based on your target guest profile and investment strategy.
| Neighborhood / Area | Why Host Here? (Target Guests & Appeal) | Key Attractions & Landmarks |
|---|---|---|
| Downtown Hamilton | The heart of Hamilton, known for its vibrant arts scene, restaurants, and nightlife. It's a great location for business travelers and tourists wanting to experience the city's culture. | Art Gallery of Hamilton, Hamilton Farmer's Market, Jackson Square, Hamilton Convention Centre, Liuna Gardens |
| Ancaster | A suburban area with a charming village feel, known for its beautiful parks and historic sites. It attracts families and visitors looking for a peaceful stay close to nature. | Ancaster Village, Dundas Valley Conservation Area, Chedoke Falls, Fieldcote Memorial Park and Museum, Ancaster Fairgrounds |
| Westdale | A picturesque neighborhood known for its proximity to McMaster University. Ideal for hosting students and university visitors throughout the academic year. | McMaster University, Cootes Paradise, Westdale Village, Royal Botanical Gardens, Hamilton Public Library - Westdale Branch |
| Stoney Creek | A residential area known for its parks and family-friendly vibe, making it a great option for larger groups or families visiting the area for leisure or events. | Battlefield Park, Gus Harris Park, Erie Levee Trail, Stoney Creek Recreation Centre, Wild Waterworks |
| Dundas | A quaint town with a rich history and beautiful landscapes, perfect for outdoor enthusiasts. It hosts several festivals and attracts visitors looking for a small-town charm. | Dundas Peak, Royal Botanical Gardens - Cootes Drive, Dundas Museum and Archives, Russell Street Park, Crown Point |
| Durand | A historic neighborhood with beautiful homes and tree-lined streets, known for its proximity to downtown and a mix of local shops and restaurants. | Durand Park, Hamilton General Hospital, St. Joseph's Hospital, Knox Presbyterian Church, Local boutiques and cafes |
| Mount Hope | Located close to the airport and major highways, it appeals to travelers looking for convenient access to transportation while being near natural attractions. | John C. Munro Hamilton International Airport, Mount Hope Park, Albion Falls, Woodland Cemetery, Pine Hill Park |
| Burlington | Just a short drive from Hamilton, Burlington offers stunning waterfront views and parks, drawing visitors interested in outdoor activities and relaxation. | Spencer Smith Park, Royal Botanical Gardens, Burlington Waterfront Trail, Burlington Art Centre, Joseph Brant Museum |
Understanding Airbnb License Requirements & STR Laws in Hamilton (2025)
While Hamilton, Ontario, Canada currently shows low STR regulations, specific Airbnb license requirements might still exist or change. Always verify the latest short term rental regulations and Airbnb license requirements directly with local government authorities for Hamilton to ensure full compliance before hosting.
(Source: AirROI data, 2025, based on 0% licensed listings)
Top Performing Airbnb Properties in Hamilton (2025)
Benchmark your potential! Explore examples of top-performing Airbnb properties in Hamiltonbased on Trailing Twelve Month (TTM) revenue. Analyze their characteristics, revenue, occupancy rate, and ADR to understand what drives success in this market.

The Kirkendall Mansion & Coach House
Entire Place • 14 bedrooms
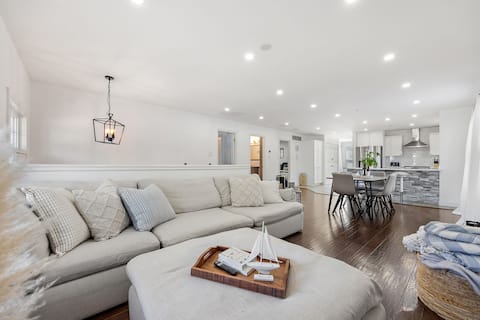
The Nautical Nook | Large Luxury House
Entire Place • 5 bedrooms
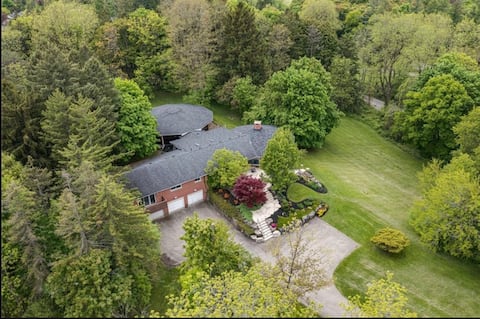
Country living, relax, fun.
Entire Place • 4 bedrooms

Luxurious 6BR Beach House with Firepit
Entire Place • 6 bedrooms

Stunning Views, Modern Lake Beachfront - HOT TUB!
Entire Place • 3 bedrooms

Beachfront Escape | Lakeview deck, Hot Tub, Games
Entire Place • 4 bedrooms
Note: Performance varies based on location, size, amenities, seasonality, and management quality. Data reflects the past 12 months.
Top Performing Airbnb Hosts in Hamilton (2025)
Learn from the best! This table showcases top-performing Airbnb hosts in Hamilton based on the number of properties managed and estimated total revenue over the past year. Analyze their scale and performance metrics.
| Host Name | Properties | Grossing Revenue | Stay Reviews | Avg Rating |
|---|---|---|---|---|
| Travelluxe | 5 | $431,907 | 539 | 4.78/5.0 |
| Jennifer | 8 | $400,963 | 667 | 4.88/5.0 |
| Yetty | 3 | $369,797 | 45 | 4.80/5.0 |
| Manuella | 9 | $316,187 | 852 | 4.76/5.0 |
| Mais | 6 | $264,321 | 1065 | 4.90/5.0 |
| Faith | 2 | $196,987 | 51 | 4.95/5.0 |
| Carstin | 8 | $196,884 | 176 | 4.38/5.0 |
| Jordan | 3 | $188,410 | 125 | 4.89/5.0 |
| Anna | 4 | $173,512 | 156 | 4.95/5.0 |
| Nathanael | 2 | $167,583 | 145 | 4.94/5.0 |
Analyzing the strategies of top hosts, such as their property selection, pricing, and guest communication, can offer valuable lessons for optimizing your own Airbnb operations in Hamilton.
Dive Deeper: Advanced Hamilton STR Market Data (2025)
Ready to unlock more insights? AirROI provides access to advanced metrics and comprehensive Airbnb data for Hamilton. Explore detailed analytics beyond this report to refine your investment strategy, optimize pricing, and maximize your vacation rental profits.
Explore Advanced MetricsHamilton Short-Term Rental Market Composition (2025): Property & Room Types
Room Type Distribution
Property Type Distribution
Market Composition Insights for Hamilton
- The Hamilton Airbnb market composition is heavily skewed towards Entire Home/Apt listings, which make up 76.8% of the 935 active rentals. This indicates strong guest preference for privacy and space.
- Looking at the property type distribution in Hamilton, House properties are the most common (54.7%), reflecting the local real estate landscape.
- Houses represent a significant 54.7% portion, catering likely to families or larger groups.
- Smaller segments like hotel/boutique, outdoor/unique, unique stays (combined 5.8%) offer potential for unique stay experiences.
Hamilton Airbnb Room Capacity Analysis (2025): Bedroom Distribution
Distribution of Listings by Number of Bedrooms
Room Capacity Insights for Hamilton
- The dominant room capacity in Hamilton is 1 bedroom listings, making up 41% of the market. This suggests a strong demand for properties suitable for couples or solo travelers.
- Together, 1 bedroom and 2 bedrooms properties represent 59.8% of the active Airbnb listings in Hamilton, indicating a high concentration in these sizes.
- A significant 21.5% of listings offer 3+ bedrooms, catering to larger groups and families seeking more space in Hamilton.
Hamilton Vacation Rental Guest Capacity Trends (2025)
Distribution of Listings by Guest Capacity
Guest Capacity Insights for Hamilton
- The most common guest capacity trend in Hamilton vacation rentals is listings accommodating 2 guests (26.2%). This suggests the primary traveler segment is likely couples or solo travelers.
- Properties designed for 2 guests and 4 guests dominate the Hamilton STR market, accounting for 45.2% of listings.
- 23.9% of properties accommodate 6+ guests, serving the market segment for larger families or group travel in Hamilton.
- On average, properties in Hamilton are equipped to host 3.4 guests.
Hamilton Airbnb Booking Patterns (2025): Available vs. Booked Days
Available Days Distribution
Booked Days Distribution
Booking Pattern Insights for Hamilton
- The most common availability pattern in Hamilton falls within the 271-366 days range, representing 36.7% of listings. This suggests many properties have significant open periods on their calendars.
- Approximately 70.4% of listings show high availability (181+ days open annually), indicating potential for increased bookings or specific owner usage patterns.
- For booked days, the 91-180 days range is most frequent in Hamilton (33%), reflecting common guest stay durations or potential owner blocking patterns.
- A notable 31.4% of properties secure long booking periods (181+ days booked per year), highlighting successful long-term rental strategies or significant owner usage.
Hamilton Airbnb Minimum Stay Requirements Analysis
Distribution of Listings by Minimum Night Requirement
1 Night
266 listings
32.6% of total
2 Nights
204 listings
25% of total
3 Nights
57 listings
7% of total
4-6 Nights
74 listings
9.1% of total
7-29 Nights
145 listings
17.8% of total
30+ Nights
70 listings
8.6% of total
Key Insights
- The most prevalent minimum stay requirement in Hamilton is 1 Night, adopted by 32.6% of listings. This highlights the market's preference for shorter, flexible bookings.
Recommendations
- Align with the market by considering a 1 Night minimum stay, as 32.6% of Hamilton hosts use this setting.
- Explore offering discounts for stays of 30+ nights to attract the 8.6% of the market seeking extended stays.
- Adjust minimum nights based on seasonality – potentially shorter during low season and longer during peak demand periods in Hamilton.
Hamilton Airbnb Cancellation Policy Trends Analysis (2025)
Super Strict 60 Days
6 listings
0.8% of total
Flexible
170 listings
23.2% of total
Moderate
227 listings
31% of total
Firm
155 listings
21.2% of total
Strict
174 listings
23.8% of total
Cancellation Policy Insights for Hamilton
- The prevailing Airbnb cancellation policy trend in Hamilton is Moderate, used by 31% of listings.
- There's a relatively balanced mix between guest-friendly (54.2%) and stricter (45.0%) policies, offering choices for different guest needs.
Recommendations for Hosts
- Consider adopting a Moderate policy to align with the 31% market standard in Hamilton.
- Regularly review your cancellation policy against competitors and market demand shifts in Hamilton.
Hamilton STR Booking Lead Time Analysis (2025)
Average Booking Lead Time by Month
Booking Lead Time Insights for Hamilton
- The overall average booking lead time for vacation rentals in Hamilton is 37 days.
- Guests book furthest in advance for stays during July (average 52 days), likely coinciding with peak travel demand or local events.
- The shortest booking windows occur for stays in March (average 31 days), indicating more last-minute travel plans during this time.
- Seasonally, Summer (48 days avg.) sees the longest lead times, while Winter (36 days avg.) has the shortest, reflecting typical travel planning cycles.
Recommendations for Hosts
- Use the overall average lead time (37 days) as a baseline for your pricing and availability strategy in Hamilton.
- For July stays, consider implementing length-of-stay discounts or slightly higher rates for bookings made less than 52 days out to capitalize on advance planning.
- Target marketing efforts for the Summer season well in advance (at least 48 days) to capture early planners.
- Monitor your own booking lead times against these Hamilton averages to identify opportunities for dynamic pricing adjustments.
Popular & Essential Airbnb Amenities in Hamilton (2025)
Amenity Prevalence
Amenity Insights for Hamilton
- Essential amenities in Hamilton that guests expect include: Wifi, Smoke alarm, Heating, Air conditioning. Lacking these (any) could significantly impact bookings.
- Popular amenities like Hot water, Carbon monoxide alarm, Kitchen are common but not universal. Offering these can provide a competitive edge.
Recommendations for Hosts
- Ensure your listing includes all essential amenities for Hamilton: Wifi, Smoke alarm, Heating, Air conditioning.
- Prioritize adding missing essentials: Wifi, Smoke alarm, Heating, Air conditioning.
- Consider adding popular differentiators like Hot water or Carbon monoxide alarm to increase appeal.
- Highlight unique or less common amenities you offer (e.g., hot tub, dedicated workspace, EV charger) in your listing description and photos.
- Regularly check competitor amenities in Hamilton to stay competitive.
Hamilton Airbnb Guest Demographics & Profile Analysis (2025)
Guest Profile Summary for Hamilton
- The typical guest profile for Airbnb in Hamilton consists of primarily domestic travelers (72%), often arriving from nearby Toronto, typically belonging to the Post-2000s (Gen Z/Alpha) group (50%), primarily speaking English or French.
- Domestic travelers account for 71.5% of guests.
- Key international markets include Canada (71.5%) and United States (18.8%).
- Top languages spoken are English (62.2%) followed by French (12%).
- A significant demographic segment is the Post-2000s (Gen Z/Alpha) group, representing 50% of guests.
Recommendations for Hosts
- Target domestic marketing efforts towards travelers from Toronto and Hamilton.
- Tailor amenities and listing descriptions to appeal to the dominant Post-2000s (Gen Z/Alpha) demographic (e.g., highlight fast WiFi, smart home features, local guides).
- Highlight unique local experiences or amenities relevant to the primary guest profile.
- Consider seasonal promotions aligned with peak travel times for key origin markets.
Nearby Short-Term Rental Market Comparison
How does the Hamilton Airbnb market stack up against its neighbors? Compare key performance metrics like average monthly revenue, ADR, and occupancy rates in surrounding areas to understand the broader regional STR landscape.
| Market | Active Properties | Monthly Revenue | Daily Rate | Avg. Occupancy |
|---|---|---|---|---|
| Town of Mansfield | 58 | $4,670 | $517.93 | 32% |
| Town of West Seneca | 15 | $4,337 | $246.11 | 52% |
| Town of Porter | 25 | $4,243 | $300.26 | 55% |
| Town of Ellicottville | 201 | $3,840 | $380.95 | 36% |
| North East Township | 34 | $3,530 | $264.33 | 48% |
| Town of Elma | 10 | $3,377 | $418.28 | 48% |
| Niagara-on-the-Lake | 413 | $3,358 | $265.20 | 44% |
| Town of Orchard Park | 38 | $3,302 | $252.95 | 46% |
| Tonawanda Town | 21 | $3,213 | $206.17 | 53% |
| Town of Wilson | 27 | $3,195 | $257.32 | 48% |