Greenstone Airbnb Market Analysis 2025: Short Term Rental Data & Vacation Rental Statistics in Ontario, Canada
Is Airbnb profitable in Greenstone in 2025? Explore comprehensive Airbnb analytics for Greenstone, Ontario, Canada to uncover income potential. This 2025 STR market report for Greenstone, based on AirROI data from April 2024 to March 2025, reveals key trends in the niche market of 19 active listings.
Whether you're considering an Airbnb investment in Greenstone, optimizing your existing vacation rental, or exploring rental arbitrage opportunities, understanding the Greenstone Airbnb data is crucial. Leveraging the low regulation environment is key to maximizing your short term rental income potential. Let's dive into the specifics.
Key Greenstone Airbnb Performance Metrics Overview
Monthly Airbnb Revenue Variations & Income Potential in Greenstone (2025)
Understanding the monthly revenue variations for Airbnb listings in Greenstone is key to maximizing your short term rental income potential. Seasonality significantly impacts earnings. Our analysis, based on data from the past 12 months, shows that the peak revenue month for STRs in Greenstone is typically April, while March often presents the lowest earnings, highlighting opportunities for strategic pricing adjustments during shoulder and low seasons. Explore the typical Airbnb income in Greenstone across different performance tiers:
- Best-in-class properties (Top 10%) achieve $4,106+ monthly, often utilizing dynamic pricing and superior guest experiences.
- Strong performing properties (Top 25%) earn $2,833 or more, indicating effective management and desirable locations/amenities.
- Typical properties (Median) generate around $859 per month, representing the average market performance.
- Entry-level properties (Bottom 25%) see earnings around $401, often with potential for optimization.
Average Monthly Airbnb Earnings Trend in Greenstone
Greenstone Airbnb Occupancy Rate Trends (2025)
Maximize your bookings by understanding the Greenstone STR occupancy trends. Seasonal demand shifts significantly influence how often properties are booked. Typically, Aprilsees the highest demand (peak season occupancy), while May experiences the lowest (low season). Effective strategies, like adjusting minimum stays or offering promotions, can boost occupancy during slower periods. Here's how different property tiers perform in Greenstone:
- Best-in-class properties (Top 10%) achieve 67%+ occupancy, indicating high desirability and potentially optimized availability.
- Strong performing properties (Top 25%) maintain 41% or higher occupancy, suggesting good market fit and guest satisfaction.
- Typical properties (Median) have an occupancy rate around 22%.
- Entry-level properties (Bottom 25%) average 13% occupancy, potentially facing higher vacancy.
Average Monthly Occupancy Rate Trend in Greenstone
Average Daily Rate (ADR) Airbnb Trends in Greenstone (2025)
Effective short term rental pricing strategy in Greenstone involves understanding monthly ADR fluctuations. The Average Daily Rate (ADR) for Airbnb in Greenstone typically peaks in June and dips lowest during January. Leveraging Airbnb dynamic pricing tools or strategies based on this seasonality can significantly boost revenue. Here's a look at the typical nightly rates achieved:
- Best-in-class properties (Top 10%) command rates of $220+ per night, often due to premium features or locations.
- Strong performing properties (Top 25%) achieve nightly rates of $121 or more.
- Typical properties (Median) charge around $96 per night.
- Entry-level properties (Bottom 25%) earn around $85 per night.
Average Daily Rate (ADR) Trend by Month in Greenstone
Get Live Greenstone Market Intelligence 👇

Explore Real-time Analytics
Airbnb Seasonality Analysis & Trends in Greenstone (2025)
Peak Season (April, October, May)
- Revenue averages $2,433 per month
- Occupancy rates average 32.1%
- Daily rates average $134
Shoulder Season
- Revenue averages $1,681 per month
- Occupancy maintains around 28.5%
- Daily rates hold near $132
Low Season (January, February, March)
- Revenue drops to average $1,057 per month
- Occupancy decreases to average 28.4%
- Daily rates adjust to average $120
Seasonality Insights for Greenstone
- The Airbnb seasonality in Greenstone shows highly seasonal trends requiring careful strategy. While the sections above show seasonal averages, it's also insightful to look at the extremes:
- During the high season, the absolute peak month showcases Greenstone's highest earning potential, with monthly revenues capable of climbing to $2,863, occupancy reaching a high of 42.0%, and ADRs peaking at $135.
- Conversely, the slowest single month of the year, typically falling within the low season, marks the market's lowest point. In this month, revenue might dip to $919, occupancy could drop to 13.3%, and ADRs may adjust down to $120.
- Understanding both the seasonal averages and these monthly peaks and troughs in revenue, occupancy, and ADR is crucial for maximizing your Airbnb profit potential in Greenstone.
Seasonal Strategies for Maximizing Profit
- Peak Season: Maximize revenue through premium pricing and potentially longer minimum stays. Ensure high availability.
- Low Season: Offer competitive pricing, special promotions (e.g., extended stay discounts), and flexible cancellation policies. Target off-season travelers like remote workers or budget-conscious guests.
- Shoulder Seasons: Implement dynamic pricing that balances peak and low rates. Target weekend travelers or specific events. Offer slightly more flexible terms than peak season.
- Regularly analyze your own performance against these Greenstone seasonality benchmarks and adjust your pricing and availability strategy accordingly.
Best Areas for Airbnb Investment in Greenstone (2025)
Exploring the top neighborhoods for short-term rentals in Greenstone? This section highlights key areas, outlining why they are attractive for hosts and guests, along with notable local attractions. Consider these locations based on your target guest profile and investment strategy.
| Neighborhood / Area | Why Host Here? (Target Guests & Appeal) | Key Attractions & Landmarks |
|---|---|---|
| Greenstone (Longlac) | This area offers access to beautiful lakes and outdoor activities like fishing and hiking, making it attractive for nature lovers and adventure seekers. | Longlac Heritage Centre, Mason Park, Lake Nipigon, Hiking trails, Fishing spots |
| Geraldton | A historic town with a rich mining background, providing unique experiences related to local culture and history. It's increasingly popular for visitors exploring rural Ontario. | Geraldton Historical Museum, Greenstone Gold Mine, Northern Ontario Sportfish, Heritage Park, Exploration of local mining history |
| Nakina | Known for its stunning natural scenery, this small community attracts those looking for a quiet getaway and nature-based tourism. | Nakina Railway Station, Wabigoon River, Hiking and canoeing opportunities, Scenic wilderness, Wildlife viewing |
| Kagawong | A small yet vibrant community with attractions focused on art and nature, appealing to tourists seeking a relaxed environment. | Onaping Falls, Kagawong River, Local art galleries, Canoeing spots, Hiking trails |
| Eagle Lake | A popular destination for fishing and camping, Eagle Lake offers plenty of outdoor activities for visitors. | Eagle Lake Marina, Fishing spots, Lakeside camping, Nature trails, Birdwatching |
| Aroland | Known for its First Nations culture and natural beauty, Aroland provides a unique cultural experience for visitors. | Cultural events, Nature excursions, Wildlife experiences, Local community events, Scenic beauty |
| Benoit Hill | An area with rich forestry and outdoor recreational activities, appealing to those who love the great outdoors. | Hiking, Camping spots, Forestry walking trails, Birdwatching, Nature photography |
| Armstrong | A small community with access to lakes and trails, making it ideal for those looking for a quiet retreat in nature. | Armstrong Nature Trails, Fishing opportunities, Local wildlife, Hiking pathways, Historical sites |
Understanding Airbnb License Requirements & STR Laws in Greenstone (2025)
While Greenstone, Ontario, Canada currently shows low STR regulations, specific Airbnb license requirements might still exist or change. Always verify the latest short term rental regulations and Airbnb license requirements directly with local government authorities for Greenstone to ensure full compliance before hosting.
(Source: AirROI data, 2025, finding no licensed listings among those analyzed)
Top Performing Airbnb Properties in Greenstone (2025)
Benchmark your potential! Explore examples of top-performing Airbnb properties in Greenstonebased on Trailing Twelve Month (TTM) revenue. Analyze their characteristics, revenue, occupancy rate, and ADR to understand what drives success in this market.
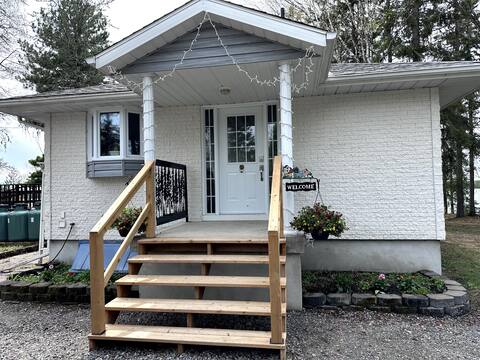
Lakeside Cozy Cottage
Entire Place • 3 bedrooms
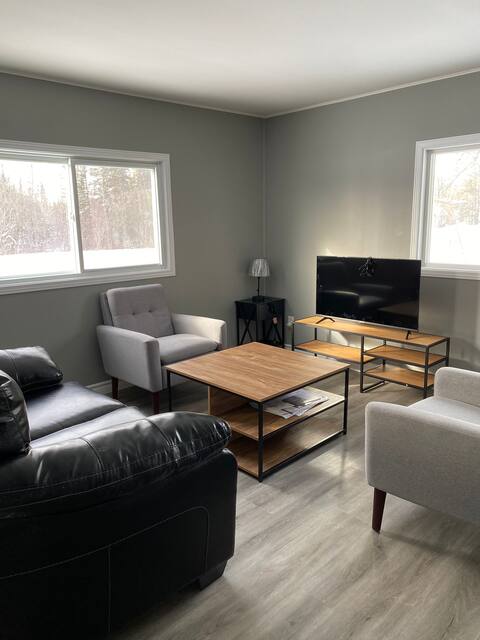
NEW Renovated 3- Bedroom House
Entire Place • 3 bedrooms

Cozy 5 bedroom home
Entire Place • 5 bedrooms
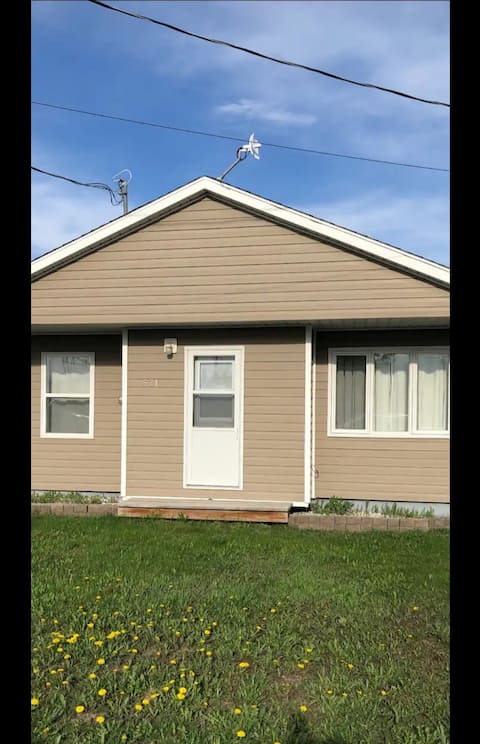
Nicely finished 2 bedroom house with free parking
Entire Place • 2 bedrooms
6 Bed/5 Bath Home
Entire Place • 6 bedrooms
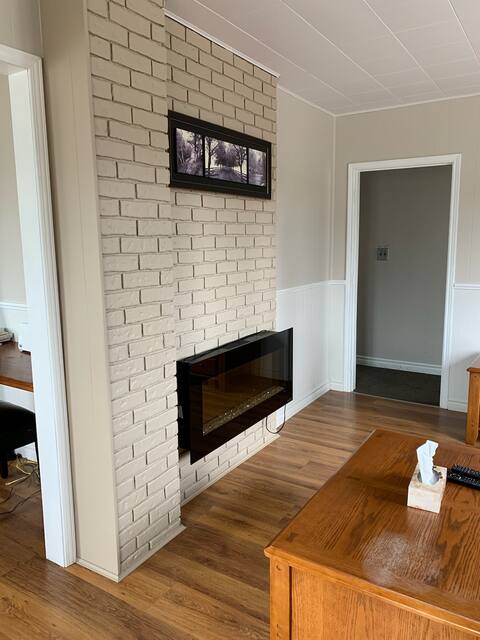
Walk to Amenities Great Character House Deck&Yard
Entire Place • 4 bedrooms
Note: Performance varies based on location, size, amenities, seasonality, and management quality. Data reflects the past 12 months.
Top Performing Airbnb Hosts in Greenstone (2025)
Learn from the best! This table showcases top-performing Airbnb hosts in Greenstone based on the number of properties managed and estimated total revenue over the past year. Analyze their scale and performance metrics.
| Host Name | Properties | Grossing Revenue | Stay Reviews | Avg Rating |
|---|---|---|---|---|
| Green Door Stays | 3 | $55,192 | 18 | 3.25/5.0 |
| Marlene | 1 | $52,749 | 30 | 5.00/5.0 |
| Bradley | 1 | $32,715 | 14 | 4.64/5.0 |
| Melanie | 5 | $20,098 | 117 | 4.75/5.0 |
| Beena | 1 | $17,519 | 29 | 4.86/5.0 |
| Craig | 1 | $9,701 | 7 | 4.86/5.0 |
| Host #484420494 | 1 | $9,310 | 8 | 4.13/5.0 |
| Roberto | 1 | $3,734 | 13 | 4.77/5.0 |
| Cody | 3 | $1,835 | 15 | 4.54/5.0 |
| Michel Claude | 1 | $595 | 60 | 4.55/5.0 |
Analyzing the strategies of top hosts, such as their property selection, pricing, and guest communication, can offer valuable lessons for optimizing your own Airbnb operations in Greenstone.
Dive Deeper: Advanced Greenstone STR Market Data (2025)
Ready to unlock more insights? AirROI provides access to advanced metrics and comprehensive Airbnb data for Greenstone. Explore detailed analytics beyond this report to refine your investment strategy, optimize pricing, and maximize your vacation rental profits.
Explore Advanced MetricsGreenstone Short-Term Rental Market Composition (2025): Property & Room Types
Room Type Distribution
Property Type Distribution
Market Composition Insights for Greenstone
- The Greenstone Airbnb market composition is heavily skewed towards Entire Home/Apt listings, which make up 57.9% of the 19 active rentals. This indicates strong guest preference for privacy and space.
- However, a notable 26.3% share for Private Rooms suggests opportunities for budget-conscious travelers or hosts renting out spare rooms.
- Looking at the property type distribution in Greenstone, House properties are the most common (73.7%), reflecting the local real estate landscape.
- Houses represent a significant 73.7% portion, catering likely to families or larger groups.
Greenstone Airbnb Room Capacity Analysis (2025): Bedroom Distribution
Distribution of Listings by Number of Bedrooms
Room Capacity Insights for Greenstone
- The dominant room capacity in Greenstone is 2 bedrooms listings, making up 26.3% of the market. This suggests a strong demand for properties suitable for couples or solo travelers.
- Together, 2 bedrooms and 5+ bedrooms properties represent 36.8% of the active Airbnb listings in Greenstone, indicating a high concentration in these sizes.
- A significant 31.5% of listings offer 3+ bedrooms, catering to larger groups and families seeking more space in Greenstone.
Greenstone Vacation Rental Guest Capacity Trends (2025)
Distribution of Listings by Guest Capacity
Guest Capacity Insights for Greenstone
- The most common guest capacity trend in Greenstone vacation rentals is listings accommodating 4 guests (31.6%). This suggests the primary traveler segment is likely small families or groups.
- Properties designed for 4 guests and 8+ guests dominate the Greenstone STR market, accounting for 57.9% of listings.
- 26.3% of properties accommodate 6+ guests, serving the market segment for larger families or group travel in Greenstone.
- On average, properties in Greenstone are equipped to host 3.6 guests.
Greenstone Airbnb Booking Patterns (2025): Available vs. Booked Days
Available Days Distribution
Booked Days Distribution
Booking Pattern Insights for Greenstone
- The most common availability pattern in Greenstone falls within the 271-366 days range, representing 78.9% of listings. This suggests many properties have significant open periods on their calendars.
- Approximately 89.4% of listings show high availability (181+ days open annually), indicating potential for increased bookings or specific owner usage patterns.
- For booked days, the 31-90 days range is most frequent in Greenstone (47.4%), reflecting common guest stay durations or potential owner blocking patterns.
- A notable 10.6% of properties secure long booking periods (181+ days booked per year), highlighting successful long-term rental strategies or significant owner usage.
Greenstone Airbnb Minimum Stay Requirements Analysis
Distribution of Listings by Minimum Night Requirement
1 Night
14 listings
82.4% of total
2 Nights
2 listings
11.8% of total
7-29 Nights
1 listings
5.9% of total
Key Insights
- The most prevalent minimum stay requirement in Greenstone is 1 Night, adopted by 82.4% of listings. This highlights the market's preference for shorter, flexible bookings.
- A strong majority (94.2%) of the Greenstone Airbnb data shows acceptance of very short stays (1-2 nights), indicating a dynamic, high-turnover market.
Recommendations
- Align with the market by considering a 1 Night minimum stay, as 82.4% of Greenstone hosts use this setting.
- Adjust minimum nights based on seasonality – potentially shorter during low season and longer during peak demand periods in Greenstone.
Greenstone Airbnb Cancellation Policy Trends Analysis (2025)
Flexible
6 listings
40% of total
Moderate
5 listings
33.3% of total
Firm
3 listings
20% of total
Strict
1 listings
6.7% of total
Cancellation Policy Insights for Greenstone
- The prevailing Airbnb cancellation policy trend in Greenstone is Flexible, used by 40% of listings.
- The market strongly favors guest-friendly terms, with 73.3% of listings offering Flexible or Moderate policies. This suggests guests in Greenstone may expect booking flexibility.
- Strict cancellation policies are quite rare (6.7%), potentially making listings with this policy less competitive unless justified by high demand or property type.
Recommendations for Hosts
- Consider adopting a Flexible policy to align with the 40% market standard in Greenstone.
- Using a Strict policy might deter some guests, as only 6.7% of listings use it. Evaluate if potential revenue protection outweighs possible lower booking rates.
- Regularly review your cancellation policy against competitors and market demand shifts in Greenstone.
Greenstone STR Booking Lead Time Analysis (2025)
Average Booking Lead Time by Month
Booking Lead Time Insights for Greenstone
- The overall average booking lead time for vacation rentals in Greenstone is 39 days.
- Guests book furthest in advance for stays during June (average 55 days), likely coinciding with peak travel demand or local events.
- The shortest booking windows occur for stays in July (average 3 days), indicating more last-minute travel plans during this time.
- Seasonally, Spring (38 days avg.) sees the longest lead times, while Winter (9 days avg.) has the shortest, reflecting typical travel planning cycles.
Recommendations for Hosts
- Use the overall average lead time (39 days) as a baseline for your pricing and availability strategy in Greenstone.
- For June stays, consider implementing length-of-stay discounts or slightly higher rates for bookings made less than 55 days out to capitalize on advance planning.
- During July, focus on last-minute booking availability and promotions, as guests book with very short notice (3 days avg.).
- Target marketing efforts for the Spring season well in advance (at least 38 days) to capture early planners.
- Monitor your own booking lead times against these Greenstone averages to identify opportunities for dynamic pricing adjustments.
Popular & Essential Airbnb Amenities in Greenstone (2025)
Amenity Prevalence
Amenity Insights for Greenstone
- Essential amenities in Greenstone that guests expect include: TV. Lacking these (this) could significantly impact bookings.
- Popular amenities like Dryer, Washer, Smoke alarm are common but not universal. Offering these can provide a competitive edge.
- Warning: Wifi is not universally provided but is considered essential globally. Ensure reliable Wifi is offered.
Recommendations for Hosts
- Ensure your listing includes all essential amenities for Greenstone: TV.
- Consider adding popular differentiators like Dryer or Washer to increase appeal.
- Highlight unique or less common amenities you offer (e.g., hot tub, dedicated workspace, EV charger) in your listing description and photos.
- Regularly check competitor amenities in Greenstone to stay competitive.
Greenstone Airbnb Guest Demographics & Profile Analysis (2025)
Guest Profile Summary for Greenstone
- The typical guest profile for Airbnb in Greenstone consists of primarily domestic travelers (84%), often arriving from nearby Thunder Bay, typically belonging to the Post-2000s (Gen Z/Alpha) group (50%), primarily speaking English or French.
- Domestic travelers account for 84.3% of guests.
- Key international markets include Canada (84.3%) and United States (13.7%).
- Top languages spoken are English (64.6%) followed by French (27.1%).
- A significant demographic segment is the Post-2000s (Gen Z/Alpha) group, representing 50% of guests.
Recommendations for Hosts
- Target domestic marketing efforts towards travelers from Thunder Bay and Sudbury.
- Tailor amenities and listing descriptions to appeal to the dominant Post-2000s (Gen Z/Alpha) demographic (e.g., highlight fast WiFi, smart home features, local guides).
- Highlight unique local experiences or amenities relevant to the primary guest profile.
- Consider seasonal promotions aligned with peak travel times for key origin markets.
Nearby Short-Term Rental Market Comparison
How does the Greenstone Airbnb market stack up against its neighbors? Compare key performance metrics like average monthly revenue, ADR, and occupancy rates in surrounding areas to understand the broader regional STR landscape.
| Market | Active Properties | Monthly Revenue | Daily Rate | Avg. Occupancy |
|---|---|---|---|---|
| Shuniah | 24 | $2,295 | $233.31 | 52% |
| Marathon | 10 | $1,705 | $125.58 | 56% |
| Unorganized Thunder Bay District | 29 | $1,268 | $148.01 | 45% |