Goderich Airbnb Market Analysis 2025: Short Term Rental Data & Vacation Rental Statistics in Ontario, Canada
Is Airbnb profitable in Goderich in 2025? Explore comprehensive Airbnb analytics for Goderich, Ontario, Canada to uncover income potential. This 2025 STR market report for Goderich, based on AirROI data from April 2024 to March 2025, reveals key trends in the niche market of 30 active listings.
Whether you're considering an Airbnb investment in Goderich, optimizing your existing vacation rental, or exploring rental arbitrage opportunities, understanding the Goderich Airbnb data is crucial. Leveraging the low regulation environment is key to maximizing your short term rental income potential. Let's dive into the specifics.
Key Goderich Airbnb Performance Metrics Overview
Monthly Airbnb Revenue Variations & Income Potential in Goderich (2025)
Understanding the monthly revenue variations for Airbnb listings in Goderich is key to maximizing your short term rental income potential. Seasonality significantly impacts earnings. Our analysis, based on data from the past 12 months, shows that the peak revenue month for STRs in Goderich is typically August, while February often presents the lowest earnings, highlighting opportunities for strategic pricing adjustments during shoulder and low seasons. Explore the typical Airbnb income in Goderich across different performance tiers:
- Best-in-class properties (Top 10%) achieve $3,986+ monthly, often utilizing dynamic pricing and superior guest experiences.
- Strong performing properties (Top 25%) earn $2,788 or more, indicating effective management and desirable locations/amenities.
- Typical properties (Median) generate around $1,798 per month, representing the average market performance.
- Entry-level properties (Bottom 25%) see earnings around $975, often with potential for optimization.
Average Monthly Airbnb Earnings Trend in Goderich
Goderich Airbnb Occupancy Rate Trends (2025)
Maximize your bookings by understanding the Goderich STR occupancy trends. Seasonal demand shifts significantly influence how often properties are booked. Typically, Augustsees the highest demand (peak season occupancy), while February experiences the lowest (low season). Effective strategies, like adjusting minimum stays or offering promotions, can boost occupancy during slower periods. Here's how different property tiers perform in Goderich:
- Best-in-class properties (Top 10%) achieve 72%+ occupancy, indicating high desirability and potentially optimized availability.
- Strong performing properties (Top 25%) maintain 53% or higher occupancy, suggesting good market fit and guest satisfaction.
- Typical properties (Median) have an occupancy rate around 35%.
- Entry-level properties (Bottom 25%) average 21% occupancy, potentially facing higher vacancy.
Average Monthly Occupancy Rate Trend in Goderich
Average Daily Rate (ADR) Airbnb Trends in Goderich (2025)
Effective short term rental pricing strategy in Goderich involves understanding monthly ADR fluctuations. The Average Daily Rate (ADR) for Airbnb in Goderich typically peaks in January and dips lowest during April. Leveraging Airbnb dynamic pricing tools or strategies based on this seasonality can significantly boost revenue. Here's a look at the typical nightly rates achieved:
- Best-in-class properties (Top 10%) command rates of $247+ per night, often due to premium features or locations.
- Strong performing properties (Top 25%) achieve nightly rates of $191 or more.
- Typical properties (Median) charge around $130 per night.
- Entry-level properties (Bottom 25%) earn around $94 per night.
Average Daily Rate (ADR) Trend by Month in Goderich
Get Live Goderich Market Intelligence 👇

Explore Real-time Analytics
Airbnb Seasonality Analysis & Trends in Goderich (2025)
Peak Season (August, July, April)
- Revenue averages $3,279 per month
- Occupancy rates average 57.1%
- Daily rates average $153
Shoulder Season
- Revenue averages $2,170 per month
- Occupancy maintains around 39.6%
- Daily rates hold near $157
Low Season (January, February, March)
- Revenue drops to average $1,079 per month
- Occupancy decreases to average 22.8%
- Daily rates adjust to average $159
Seasonality Insights for Goderich
- The Airbnb seasonality in Goderich shows highly seasonal trends requiring careful strategy. While the sections above show seasonal averages, it's also insightful to look at the extremes:
- During the high season, the absolute peak month showcases Goderich's highest earning potential, with monthly revenues capable of climbing to $3,641, occupancy reaching a high of 64.6%, and ADRs peaking at $165.
- Conversely, the slowest single month of the year, typically falling within the low season, marks the market's lowest point. In this month, revenue might dip to $874, occupancy could drop to 20.3%, and ADRs may adjust down to $147.
- Understanding both the seasonal averages and these monthly peaks and troughs in revenue, occupancy, and ADR is crucial for maximizing your Airbnb profit potential in Goderich.
Seasonal Strategies for Maximizing Profit
- Peak Season: Maximize revenue through premium pricing and potentially longer minimum stays. Ensure high availability.
- Low Season: Offer competitive pricing, special promotions (e.g., extended stay discounts), and flexible cancellation policies. Target off-season travelers like remote workers or budget-conscious guests.
- Shoulder Seasons: Implement dynamic pricing that balances peak and low rates. Target weekend travelers or specific events. Offer slightly more flexible terms than peak season.
- Regularly analyze your own performance against these Goderich seasonality benchmarks and adjust your pricing and availability strategy accordingly.
Best Areas for Airbnb Investment in Goderich (2025)
Exploring the top neighborhoods for short-term rentals in Goderich? This section highlights key areas, outlining why they are attractive for hosts and guests, along with notable local attractions. Consider these locations based on your target guest profile and investment strategy.
| Neighborhood / Area | Why Host Here? (Target Guests & Appeal) | Key Attractions & Landmarks |
|---|---|---|
| Harbour Beach | Beautiful sandy beach located along Lake Huron, perfect for summer vacations and water activities. A popular spot for families and beach lovers. | Goderich Main Beach, Goderich Harbour, Goderich Lighthouse, Lake Huron, Water sports activities |
| Downtown Goderich | Offers a charming and historic downtown area with unique shops, cafes, and restaurants. Ideal for those looking to experience local culture and vibrant community life. | Courthouse Square, Goderich Museum, Heritage Theatre, local shops and boutiques, restaurants and coffee shops |
| Goderich Sunset Beach | Known for stunning sunsets and great fishing spots. An excellent choice for travelers seeking tranquility and natural beauty. | Sunset Beach Park, Fishing on Lake Huron, Picnic areas, Nature trails, Bird watching |
| Goderich Golf Course | Attractive for golf enthusiasts, this area provides opportunities for golfing and outdoor relaxation. Great for short-term stays connected to outdoor activities. | Goderich Golf Club, Practice facilities, Nearby trails for hiking |
| Goderich Lighthouse Area | A historic landmark near the waterfront, providing picturesque views of Lake Huron. A fantastic spot for photography and leisure activities. | Goderich Lighthouse, Boardwalk along the lake, Scenic viewpoints |
| Recreation Park | Perfect for family activities with sports fields and playgrounds. Attracts families looking for recreational options. | Parks and leisure facilities, Sporting events, Playgrounds, Natural walking paths |
| Godrich Maritime History | Attracts history buffs and tourists interested in maritime heritage. Offers an educational experience combined with leisure. | Maritime Museum, Tall Ships events, Historic boat tours, Lake Huron History |
| Goderich Wooden Boat Festival | A unique event that draws visitors interested in traditional craftsmanship and boating. Offers a festive atmosphere with community engagement. | Wooden Boat Festival Events, Boating tours, Local artisan exhibits, Food vendors |
Understanding Airbnb License Requirements & STR Laws in Goderich (2025)
While Goderich, Ontario, Canada currently shows low STR regulations, specific Airbnb license requirements might still exist or change. Always verify the latest short term rental regulations and Airbnb license requirements directly with local government authorities for Goderich to ensure full compliance before hosting.
(Source: AirROI data, 2025, finding no licensed listings among those analyzed)
Top Performing Airbnb Properties in Goderich (2025)
Benchmark your potential! Explore examples of top-performing Airbnb properties in Goderichbased on Trailing Twelve Month (TTM) revenue. Analyze their characteristics, revenue, occupancy rate, and ADR to understand what drives success in this market.

Historical Replica McDermott Castle
Entire Place • 6 bedrooms
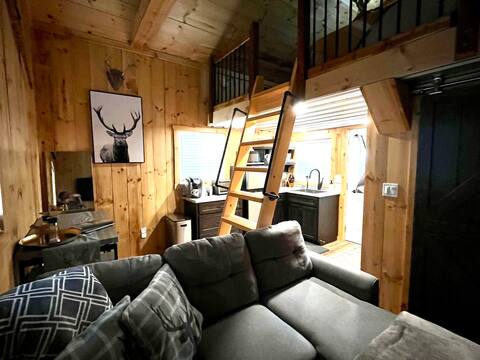
Tiny Home with A/C, Heat & Hot Tub, Lake 5 Mins
Entire Place • 1 bedroom
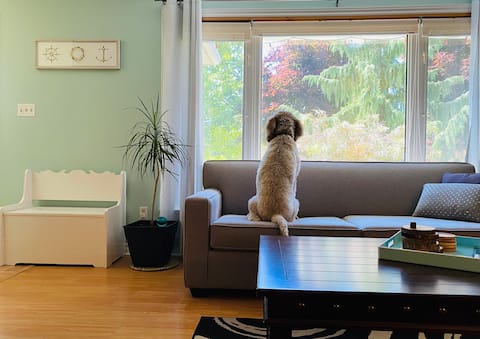
Bright Open Cottage - Sleeps 10+
Entire Place • 3 bedrooms
3 Bedroom Home in the Heart of Goderich
Entire Place • 3 bedrooms
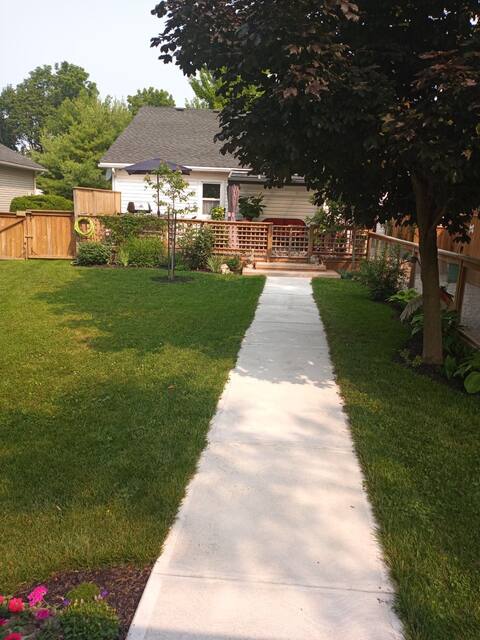
Welcome to Reclaim'd Row.
Entire Place • 3 bedrooms

Newgate Estate
Entire Place • 3 bedrooms
Note: Performance varies based on location, size, amenities, seasonality, and management quality. Data reflects the past 12 months.
Top Performing Airbnb Hosts in Goderich (2025)
Learn from the best! This table showcases top-performing Airbnb hosts in Goderich based on the number of properties managed and estimated total revenue over the past year. Analyze their scale and performance metrics.
| Host Name | Properties | Grossing Revenue | Stay Reviews | Avg Rating |
|---|---|---|---|---|
| James | 5 | $138,419 | 109 | 4.87/5.0 |
| Jacqui | 1 | $38,242 | 188 | 4.94/5.0 |
| Lisa | 1 | $35,564 | 41 | 4.85/5.0 |
| Merle | 1 | $31,784 | 48 | 5.00/5.0 |
| Carol & Shawn | 1 | $30,016 | 172 | 4.97/5.0 |
| Kayla | 1 | $28,069 | 104 | 4.76/5.0 |
| Megan | 2 | $24,557 | 19 | 4.90/5.0 |
| Jesse | 1 | $23,950 | 66 | 4.97/5.0 |
| Sarah | 2 | $22,617 | 12 | 2.50/5.0 |
| Vicky | 1 | $22,039 | 91 | 5.00/5.0 |
Analyzing the strategies of top hosts, such as their property selection, pricing, and guest communication, can offer valuable lessons for optimizing your own Airbnb operations in Goderich.
Dive Deeper: Advanced Goderich STR Market Data (2025)
Ready to unlock more insights? AirROI provides access to advanced metrics and comprehensive Airbnb data for Goderich. Explore detailed analytics beyond this report to refine your investment strategy, optimize pricing, and maximize your vacation rental profits.
Explore Advanced MetricsGoderich Short-Term Rental Market Composition (2025): Property & Room Types
Room Type Distribution
Property Type Distribution
Market Composition Insights for Goderich
- The Goderich Airbnb market composition is heavily skewed towards Entire Home/Apt listings, which make up 66.7% of the 30 active rentals. This indicates strong guest preference for privacy and space.
- However, a notable 30% share for Private Rooms suggests opportunities for budget-conscious travelers or hosts renting out spare rooms.
- Looking at the property type distribution in Goderich, House properties are the most common (40%), reflecting the local real estate landscape.
- Houses represent a significant 40% portion, catering likely to families or larger groups.
- The presence of 16.7% Hotel/Boutique listings indicates integration with traditional hospitality.
- Smaller segments like outdoor/unique (combined 3.3%) offer potential for unique stay experiences.
Goderich Airbnb Room Capacity Analysis (2025): Bedroom Distribution
Distribution of Listings by Number of Bedrooms
Room Capacity Insights for Goderich
- The dominant room capacity in Goderich is 1 bedroom listings, making up 36.7% of the market. This suggests a strong demand for properties suitable for couples or solo travelers.
- Together, 1 bedroom and 3 bedrooms properties represent 53.4% of the active Airbnb listings in Goderich, indicating a high concentration in these sizes.
- A significant 30.0% of listings offer 3+ bedrooms, catering to larger groups and families seeking more space in Goderich.
Goderich Vacation Rental Guest Capacity Trends (2025)
Distribution of Listings by Guest Capacity
Guest Capacity Insights for Goderich
- The most common guest capacity trend in Goderich vacation rentals is listings accommodating 2 guests (26.7%). This suggests the primary traveler segment is likely couples or solo travelers.
- Properties designed for 2 guests and 4 guests dominate the Goderich STR market, accounting for 40.0% of listings.
- 26.7% of properties accommodate 6+ guests, serving the market segment for larger families or group travel in Goderich.
- On average, properties in Goderich are equipped to host 3.1 guests.
Goderich Airbnb Booking Patterns (2025): Available vs. Booked Days
Available Days Distribution
Booked Days Distribution
Booking Pattern Insights for Goderich
- The most common availability pattern in Goderich falls within the 271-366 days range, representing 43.3% of listings. This suggests many properties have significant open periods on their calendars.
- Approximately 83.3% of listings show high availability (181+ days open annually), indicating potential for increased bookings or specific owner usage patterns.
- For booked days, the 91-180 days range is most frequent in Goderich (40%), reflecting common guest stay durations or potential owner blocking patterns.
- A notable 16.7% of properties secure long booking periods (181+ days booked per year), highlighting successful long-term rental strategies or significant owner usage.
Goderich Airbnb Minimum Stay Requirements Analysis
Distribution of Listings by Minimum Night Requirement
1 Night
10 listings
37% of total
2 Nights
9 listings
33.3% of total
3 Nights
1 listings
3.7% of total
7-29 Nights
1 listings
3.7% of total
30+ Nights
6 listings
22.2% of total
Key Insights
- The most prevalent minimum stay requirement in Goderich is 1 Night, adopted by 37% of listings. This highlights the market's preference for shorter, flexible bookings.
- A strong majority (70.3%) of the Goderich Airbnb data shows acceptance of very short stays (1-2 nights), indicating a dynamic, high-turnover market.
- A significant segment (22.2%) caters to monthly stays (30+ nights) in Goderich, pointing to opportunities in the extended-stay market.
Recommendations
- Align with the market by considering a 1 Night minimum stay, as 37% of Goderich hosts use this setting.
- Explore offering discounts for stays of 30+ nights to attract the 22.2% of the market seeking extended stays.
- Adjust minimum nights based on seasonality – potentially shorter during low season and longer during peak demand periods in Goderich.
Goderich Airbnb Cancellation Policy Trends Analysis (2025)
Flexible
6 listings
24% of total
Moderate
6 listings
24% of total
Firm
7 listings
28% of total
Strict
6 listings
24% of total
Cancellation Policy Insights for Goderich
- The prevailing Airbnb cancellation policy trend in Goderich is Firm, used by 28% of listings.
- A majority (52.0%) of hosts in Goderich utilize Firm or Strict policies, indicating a market where hosts prioritize booking security.
Recommendations for Hosts
- Consider adopting a Firm policy to align with the 28% market standard in Goderich.
- Regularly review your cancellation policy against competitors and market demand shifts in Goderich.
Goderich STR Booking Lead Time Analysis (2025)
Average Booking Lead Time by Month
Booking Lead Time Insights for Goderich
- The overall average booking lead time for vacation rentals in Goderich is 53 days.
- Guests book furthest in advance for stays during July (average 94 days), likely coinciding with peak travel demand or local events.
- The shortest booking windows occur for stays in December (average 36 days), indicating more last-minute travel plans during this time.
- Seasonally, Summer (85 days avg.) sees the longest lead times, while Fall (43 days avg.) has the shortest, reflecting typical travel planning cycles.
Recommendations for Hosts
- Use the overall average lead time (53 days) as a baseline for your pricing and availability strategy in Goderich.
- For July stays, consider implementing length-of-stay discounts or slightly higher rates for bookings made less than 94 days out to capitalize on advance planning.
- Target marketing efforts for the Summer season well in advance (at least 85 days) to capture early planners.
- Monitor your own booking lead times against these Goderich averages to identify opportunities for dynamic pricing adjustments.
Popular & Essential Airbnb Amenities in Goderich (2025)
Amenity Prevalence
Amenity Insights for Goderich
- Essential amenities in Goderich that guests expect include: Wifi, Smoke alarm, Carbon monoxide alarm. Lacking these (any) could significantly impact bookings.
- Popular amenities like Hot water, Heating, Bed linens are common but not universal. Offering these can provide a competitive edge.
Recommendations for Hosts
- Ensure your listing includes all essential amenities for Goderich: Wifi, Smoke alarm, Carbon monoxide alarm.
- Prioritize adding missing essentials: Smoke alarm, Carbon monoxide alarm.
- Consider adding popular differentiators like Hot water or Heating to increase appeal.
- Highlight unique or less common amenities you offer (e.g., hot tub, dedicated workspace, EV charger) in your listing description and photos.
- Regularly check competitor amenities in Goderich to stay competitive.
Goderich Airbnb Guest Demographics & Profile Analysis (2025)
Guest Profile Summary for Goderich
- The typical guest profile for Airbnb in Goderich consists of primarily domestic travelers (88%), often arriving from nearby Toronto, typically belonging to the Post-2000s (Gen Z/Alpha) group (50%), primarily speaking English or French.
- Domestic travelers account for 88.2% of guests.
- Key international markets include Canada (88.2%) and United States (9.1%).
- Top languages spoken are English (67.4%) followed by French (11.1%).
- A significant demographic segment is the Post-2000s (Gen Z/Alpha) group, representing 50% of guests.
Recommendations for Hosts
- Target domestic marketing efforts towards travelers from Toronto and London.
- Tailor amenities and listing descriptions to appeal to the dominant Post-2000s (Gen Z/Alpha) demographic (e.g., highlight fast WiFi, smart home features, local guides).
- Highlight unique local experiences or amenities relevant to the primary guest profile.
- Consider seasonal promotions aligned with peak travel times for key origin markets.
Nearby Short-Term Rental Market Comparison
How does the Goderich Airbnb market stack up against its neighbors? Compare key performance metrics like average monthly revenue, ADR, and occupancy rates in surrounding areas to understand the broader regional STR landscape.
| Market | Active Properties | Monthly Revenue | Daily Rate | Avg. Occupancy |
|---|---|---|---|---|
| Forester | 11 | $5,685 | $390.48 | 43% |
| Port Sanilac | 30 | $3,765 | $470.85 | 34% |
| Harrison Township | 24 | $3,464 | $248.32 | 50% |
| Lexington | 31 | $3,459 | $385.98 | 43% |
| Grosse Pointe Park | 36 | $3,068 | $224.25 | 43% |
| Ira Township | 17 | $3,063 | $287.30 | 42% |
| Meaford | 129 | $2,843 | $246.44 | 45% |
| Mulmur | 43 | $2,837 | $283.33 | 42% |
| Millcreek Township | 85 | $2,827 | $209.72 | 48% |
| The Blue Mountains | 612 | $2,777 | $285.62 | 36% |