Fort Erie Airbnb Market Analysis 2025: Short Term Rental Data & Vacation Rental Statistics in Ontario, Canada
Is Airbnb profitable in Fort Erie in 2025? Explore comprehensive Airbnb analytics for Fort Erie, Ontario, Canada to uncover income potential. This 2025 STR market report for Fort Erie, based on AirROI data from April 2024 to March 2025, reveals key trends in the market of 213 active listings.
Whether you're considering an Airbnb investment in Fort Erie, optimizing your existing vacation rental, or exploring rental arbitrage opportunities, understanding the Fort Erie Airbnb data is crucial. Understanding the local regulations is key to maximizing your short term rental income potential. Let's dive into the specifics.
Key Fort Erie Airbnb Performance Metrics Overview
Monthly Airbnb Revenue Variations & Income Potential in Fort Erie (2025)
Understanding the monthly revenue variations for Airbnb listings in Fort Erie is key to maximizing your short term rental income potential. Seasonality significantly impacts earnings. Our analysis, based on data from the past 12 months, shows that the peak revenue month for STRs in Fort Erie is typically August, while March often presents the lowest earnings, highlighting opportunities for strategic pricing adjustments during shoulder and low seasons. Explore the typical Airbnb income in Fort Erie across different performance tiers:
- Best-in-class properties (Top 10%) achieve $6,657+ monthly, often utilizing dynamic pricing and superior guest experiences.
- Strong performing properties (Top 25%) earn $4,137 or more, indicating effective management and desirable locations/amenities.
- Typical properties (Median) generate around $2,344 per month, representing the average market performance.
- Entry-level properties (Bottom 25%) see earnings around $1,123, often with potential for optimization.
Average Monthly Airbnb Earnings Trend in Fort Erie
Fort Erie Airbnb Occupancy Rate Trends (2025)
Maximize your bookings by understanding the Fort Erie STR occupancy trends. Seasonal demand shifts significantly influence how often properties are booked. Typically, Augustsees the highest demand (peak season occupancy), while January experiences the lowest (low season). Effective strategies, like adjusting minimum stays or offering promotions, can boost occupancy during slower periods. Here's how different property tiers perform in Fort Erie:
- Best-in-class properties (Top 10%) achieve 76%+ occupancy, indicating high desirability and potentially optimized availability.
- Strong performing properties (Top 25%) maintain 55% or higher occupancy, suggesting good market fit and guest satisfaction.
- Typical properties (Median) have an occupancy rate around 37%.
- Entry-level properties (Bottom 25%) average 19% occupancy, potentially facing higher vacancy.
Average Monthly Occupancy Rate Trend in Fort Erie
Average Daily Rate (ADR) Airbnb Trends in Fort Erie (2025)
Effective short term rental pricing strategy in Fort Erie involves understanding monthly ADR fluctuations. The Average Daily Rate (ADR) for Airbnb in Fort Erie typically peaks in August and dips lowest during January. Leveraging Airbnb dynamic pricing tools or strategies based on this seasonality can significantly boost revenue. Here's a look at the typical nightly rates achieved:
- Best-in-class properties (Top 10%) command rates of $423+ per night, often due to premium features or locations.
- Strong performing properties (Top 25%) achieve nightly rates of $280 or more.
- Typical properties (Median) charge around $195 per night.
- Entry-level properties (Bottom 25%) earn around $140 per night.
Average Daily Rate (ADR) Trend by Month in Fort Erie
Get Live Fort Erie Market Intelligence 👇

Explore Real-time Analytics
Airbnb Seasonality Analysis & Trends in Fort Erie (2025)
Peak Season (August, July, June)
- Revenue averages $5,583 per month
- Occupancy rates average 55.8%
- Daily rates average $273
Shoulder Season
- Revenue averages $2,688 per month
- Occupancy maintains around 33.5%
- Daily rates hold near $234
Low Season (January, February, March)
- Revenue drops to average $1,878 per month
- Occupancy decreases to average 33.2%
- Daily rates adjust to average $216
Seasonality Insights for Fort Erie
- The Airbnb seasonality in Fort Erie shows highly seasonal trends requiring careful strategy. While the sections above show seasonal averages, it's also insightful to look at the extremes:
- During the high season, the absolute peak month showcases Fort Erie's highest earning potential, with monthly revenues capable of climbing to $6,277, occupancy reaching a high of 65.4%, and ADRs peaking at $278.
- Conversely, the slowest single month of the year, typically falling within the low season, marks the market's lowest point. In this month, revenue might dip to $1,831, occupancy could drop to 32.0%, and ADRs may adjust down to $214.
- Understanding both the seasonal averages and these monthly peaks and troughs in revenue, occupancy, and ADR is crucial for maximizing your Airbnb profit potential in Fort Erie.
Seasonal Strategies for Maximizing Profit
- Peak Season: Maximize revenue through premium pricing and potentially longer minimum stays. Ensure high availability.
- Low Season: Offer competitive pricing, special promotions (e.g., extended stay discounts), and flexible cancellation policies. Target off-season travelers like remote workers or budget-conscious guests.
- Shoulder Seasons: Implement dynamic pricing that balances peak and low rates. Target weekend travelers or specific events. Offer slightly more flexible terms than peak season.
- Regularly analyze your own performance against these Fort Erie seasonality benchmarks and adjust your pricing and availability strategy accordingly.
Best Areas for Airbnb Investment in Fort Erie (2025)
Exploring the top neighborhoods for short-term rentals in Fort Erie? This section highlights key areas, outlining why they are attractive for hosts and guests, along with notable local attractions. Consider these locations based on your target guest profile and investment strategy.
| Neighborhood / Area | Why Host Here? (Target Guests & Appeal) | Key Attractions & Landmarks |
|---|---|---|
| Crystal Beach | A charming lakeside community known for its sandy beaches and family-friendly atmosphere. Ideal for vacationers and families looking for a relaxing getaway. | Crystal Beach Park, Sherkston Shores, Lake Erie waterfront, local markets and eateries, various water sports activities |
| Fort Erie Historical District | Rich in history with numerous heritage buildings and sites. Attracts history enthusiasts and those interested in the War of 1812 sites. | Old Fort Erie, Fort Erie Railway Museum, Peace Bridge, Lakeside Park, Various historic buildings and tours |
| Niagara, Ontario | Located near the world-famous Niagara Falls, this area is perfect for tourists seeking natural wonders and attractions. | Niagara Falls, Clifton Hill, Niagara Parks Botanical Gardens, Skylon Tower, Niagara SkyWheel |
| Ridgeway | A beautiful small town with a vibrant community and close proximity to beaches, making it appealing for families and visitors. | Lake Erie, Old Ridgeway Town Hall, local festivals, Nature trails and parks, Nearby wineries |
| Erie Beach | Offers picturesque views and is appreciated for its quiet, relaxed vibe. Great for those looking to unwind by the lake. | Erie Beach, Lake Erie sunsets, picnic areas, Accessible nature trails, Calm waters and beach activities |
| Garrison Village | Quaint neighborhood known for its artisanal shops and close-knit community feel. Attracts tourists looking for unique local experiences. | Biking and walking trails, Local art galleries, Wine tours, Small cafes and shops, Festivals |
| Buffalo Road | Easily accessible with shopping and dining options nearby, making it convenient for travelers and tourists. | Shopping centers, Restaurants, Entertainment venues, Proximity to amenities, Bars and nightlife |
| Marina District | Known for its scenic views of the waterfront. Popular for boaters and fishing enthusiasts looking to enjoy aquatic activities. | Marina access, Waterfront parks, Fishing spots, Local seafood restaurants, Boat rentals |
Understanding Airbnb License Requirements & STR Laws in Fort Erie (2025)
With 15% of listings showing registration in 2025, understanding potential Airbnb license requirements is crucial in Fort Erie. Always verify the latest short term rental regulations and Airbnb license requirements directly with local government authorities for Fort Erie to ensure full compliance before hosting.
(Source: AirROI data, 2025, based on 15% licensed listings)
Top Performing Airbnb Properties in Fort Erie (2025)
Benchmark your potential! Explore examples of top-performing Airbnb properties in Fort Eriebased on Trailing Twelve Month (TTM) revenue. Analyze their characteristics, revenue, occupancy rate, and ADR to understand what drives success in this market.

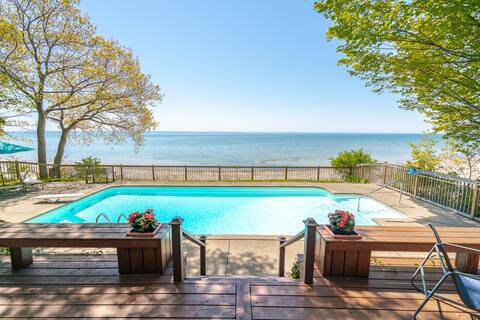
HOT TUB Waterfront Estate- 2 Houses! Sleeps 14
Entire Place • 6 bedrooms
Bertie Bay Bliss
Entire Place • 5 bedrooms

Lakefront Getaway w/ Private Nordic Spa + Hot tub
Entire Place • 3 bedrooms
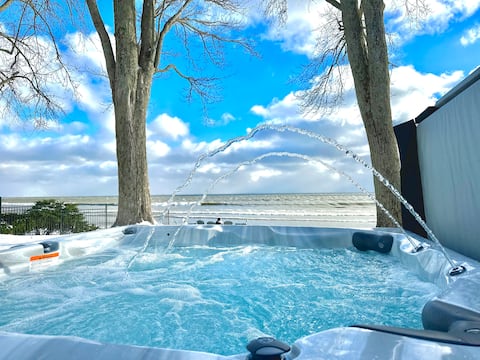
HOT TUB Waterfront Estate on Prestigious Bay Beach
Entire Place • 3 bedrooms
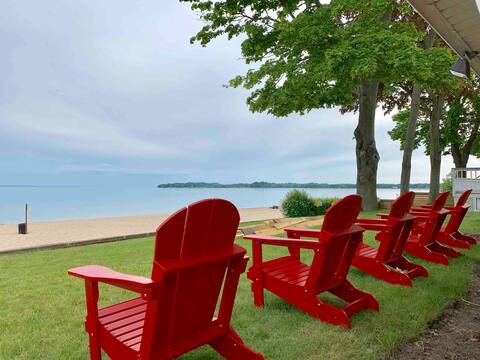
Hendriks Hall Hideaway... On The Beach
Entire Place • 4 bedrooms

Niagara Winter retreat. Swim spa on a Beach
Entire Place • 3 bedrooms
Note: Performance varies based on location, size, amenities, seasonality, and management quality. Data reflects the past 12 months.
Top Performing Airbnb Hosts in Fort Erie (2025)
Learn from the best! This table showcases top-performing Airbnb hosts in Fort Erie based on the number of properties managed and estimated total revenue over the past year. Analyze their scale and performance metrics.
| Host Name | Properties | Grossing Revenue | Stay Reviews | Avg Rating |
|---|---|---|---|---|
| David | 6 | $577,189 | 326 | 4.88/5.0 |
| Teri | 11 | $455,673 | 380 | 4.85/5.0 |
| Scott | 2 | $180,113 | 368 | 4.93/5.0 |
| Phong | 4 | $178,364 | 226 | 4.42/5.0 |
| Host #62183448 | 4 | $165,718 | 46 | 4.60/5.0 |
| Bryan,M | 1 | $157,608 | 46 | 4.91/5.0 |
| Bonnie | 2 | $138,194 | 164 | 4.96/5.0 |
| Chris | 1 | $111,578 | 47 | 4.89/5.0 |
| Ali | 1 | $109,192 | 54 | 4.91/5.0 |
| Yen | 1 | $101,940 | 61 | 5.00/5.0 |
Analyzing the strategies of top hosts, such as their property selection, pricing, and guest communication, can offer valuable lessons for optimizing your own Airbnb operations in Fort Erie.
Dive Deeper: Advanced Fort Erie STR Market Data (2025)
Ready to unlock more insights? AirROI provides access to advanced metrics and comprehensive Airbnb data for Fort Erie. Explore detailed analytics beyond this report to refine your investment strategy, optimize pricing, and maximize your vacation rental profits.
Explore Advanced MetricsFort Erie Short-Term Rental Market Composition (2025): Property & Room Types
Room Type Distribution
Property Type Distribution
Market Composition Insights for Fort Erie
- The Fort Erie Airbnb market composition is heavily skewed towards Entire Home/Apt listings, which make up 94.4% of the 213 active rentals. This indicates strong guest preference for privacy and space.
- Looking at the property type distribution in Fort Erie, House properties are the most common (83.1%), reflecting the local real estate landscape.
- Houses represent a significant 83.1% portion, catering likely to families or larger groups.
- Smaller segments like hotel/boutique, apartment/condo, others (combined 8.0%) offer potential for unique stay experiences.
Fort Erie Airbnb Room Capacity Analysis (2025): Bedroom Distribution
Distribution of Listings by Number of Bedrooms
Room Capacity Insights for Fort Erie
- The dominant room capacity in Fort Erie is 3 bedrooms listings, making up 56.8% of the market. This suggests a strong demand for properties suitable for families or small groups.
- Together, 3 bedrooms and 2 bedrooms properties represent 77.5% of the active Airbnb listings in Fort Erie, indicating a high concentration in these sizes.
- A significant 64.7% of listings offer 3+ bedrooms, catering to larger groups and families seeking more space in Fort Erie.
Fort Erie Vacation Rental Guest Capacity Trends (2025)
Distribution of Listings by Guest Capacity
Guest Capacity Insights for Fort Erie
- The most common guest capacity trend in Fort Erie vacation rentals is listings accommodating 8+ guests (41.3%). This suggests the primary traveler segment is likely larger groups.
- Properties designed for 8+ guests and 6 guests dominate the Fort Erie STR market, accounting for 71.8% of listings.
- 74.1% of properties accommodate 6+ guests, serving the market segment for larger families or group travel in Fort Erie.
- On average, properties in Fort Erie are equipped to host 6.3 guests.
Fort Erie Airbnb Booking Patterns (2025): Available vs. Booked Days
Available Days Distribution
Booked Days Distribution
Booking Pattern Insights for Fort Erie
- The most common availability pattern in Fort Erie falls within the 271-366 days range, representing 47.9% of listings. This suggests many properties have significant open periods on their calendars.
- Approximately 85.0% of listings show high availability (181+ days open annually), indicating potential for increased bookings or specific owner usage patterns.
- For booked days, the 91-180 days range is most frequent in Fort Erie (38%), reflecting common guest stay durations or potential owner blocking patterns.
- A notable 16.5% of properties secure long booking periods (181+ days booked per year), highlighting successful long-term rental strategies or significant owner usage.
Fort Erie Airbnb Minimum Stay Requirements Analysis
Distribution of Listings by Minimum Night Requirement
1 Night
30 listings
16.5% of total
2 Nights
79 listings
43.4% of total
3 Nights
32 listings
17.6% of total
4-6 Nights
11 listings
6% of total
7-29 Nights
10 listings
5.5% of total
30+ Nights
20 listings
11% of total
Key Insights
- The most prevalent minimum stay requirement in Fort Erie is 2 Nights, adopted by 43.4% of listings. This highlights the market's preference for shorter, flexible bookings.
- A significant segment (11%) caters to monthly stays (30+ nights) in Fort Erie, pointing to opportunities in the extended-stay market.
Recommendations
- Align with the market by considering a 2 Nights minimum stay, as 43.4% of Fort Erie hosts use this setting.
- If feasible, allowing 1-night stays, especially midweek or during low season, could capture last-minute bookings, as only 16.5% currently do.
- A 2-night minimum appears standard (43.4%). Consider this for weekends or peak periods.
- Explore offering discounts for stays of 30+ nights to attract the 11% of the market seeking extended stays.
- Adjust minimum nights based on seasonality – potentially shorter during low season and longer during peak demand periods in Fort Erie.
Fort Erie Airbnb Cancellation Policy Trends Analysis (2025)
Flexible
15 listings
9.1% of total
Moderate
43 listings
26.1% of total
Firm
56 listings
33.9% of total
Strict
51 listings
30.9% of total
Cancellation Policy Insights for Fort Erie
- The prevailing Airbnb cancellation policy trend in Fort Erie is Firm, used by 33.9% of listings.
- A majority (64.8%) of hosts in Fort Erie utilize Firm or Strict policies, indicating a market where hosts prioritize booking security.
Recommendations for Hosts
- Consider adopting a Firm policy to align with the 33.9% market standard in Fort Erie.
- With 30.9% using Strict terms, this is a viable option in Fort Erie, particularly for high-value properties or during peak demand periods.
- Regularly review your cancellation policy against competitors and market demand shifts in Fort Erie.
Fort Erie STR Booking Lead Time Analysis (2025)
Average Booking Lead Time by Month
Booking Lead Time Insights for Fort Erie
- The overall average booking lead time for vacation rentals in Fort Erie is 52 days.
- Guests book furthest in advance for stays during July (average 97 days), likely coinciding with peak travel demand or local events.
- The shortest booking windows occur for stays in January (average 28 days), indicating more last-minute travel plans during this time.
- Seasonally, Summer (77 days avg.) sees the longest lead times, while Winter (29 days avg.) has the shortest, reflecting typical travel planning cycles.
Recommendations for Hosts
- Use the overall average lead time (52 days) as a baseline for your pricing and availability strategy in Fort Erie.
- For July stays, consider implementing length-of-stay discounts or slightly higher rates for bookings made less than 97 days out to capitalize on advance planning.
- Target marketing efforts for the Summer season well in advance (at least 77 days) to capture early planners.
- Monitor your own booking lead times against these Fort Erie averages to identify opportunities for dynamic pricing adjustments.
Popular & Essential Airbnb Amenities in Fort Erie (2025)
Amenity Prevalence
Amenity Insights for Fort Erie
- Essential amenities in Fort Erie that guests expect include: Smoke alarm, Wifi, Carbon monoxide alarm, TV, Kitchen, Heating, Free parking on premises. Lacking these (any) could significantly impact bookings.
- Popular amenities like Hot water, Air conditioning, Essentials are common but not universal. Offering these can provide a competitive edge.
Recommendations for Hosts
- Ensure your listing includes all essential amenities for Fort Erie: Smoke alarm, Wifi, Carbon monoxide alarm, TV, Kitchen, Heating, Free parking on premises.
- Prioritize adding missing essentials: Wifi, Carbon monoxide alarm, TV, Kitchen, Heating, Free parking on premises.
- Consider adding popular differentiators like Hot water or Air conditioning to increase appeal.
- Highlight unique or less common amenities you offer (e.g., hot tub, dedicated workspace, EV charger) in your listing description and photos.
- Regularly check competitor amenities in Fort Erie to stay competitive.
Fort Erie Airbnb Guest Demographics & Profile Analysis (2025)
Guest Profile Summary for Fort Erie
- The typical guest profile for Airbnb in Fort Erie consists of a mix of domestic (58%) and international guests, often arriving from nearby Toronto, typically belonging to the Post-2000s (Gen Z/Alpha) group (50%), primarily speaking English or French.
- Domestic travelers account for 57.5% of guests.
- Key international markets include Canada (57.5%) and United States (39.1%).
- Top languages spoken are English (65.7%) followed by French (8%).
- A significant demographic segment is the Post-2000s (Gen Z/Alpha) group, representing 50% of guests.
Recommendations for Hosts
- Balance marketing efforts between domestic and international channels based on the guest mix.
- Tailor amenities and listing descriptions to appeal to the dominant Post-2000s (Gen Z/Alpha) demographic (e.g., highlight fast WiFi, smart home features, local guides).
- Highlight unique local experiences or amenities relevant to the primary guest profile.
- Consider seasonal promotions aligned with peak travel times for key origin markets.
Nearby Short-Term Rental Market Comparison
How does the Fort Erie Airbnb market stack up against its neighbors? Compare key performance metrics like average monthly revenue, ADR, and occupancy rates in surrounding areas to understand the broader regional STR landscape.
| Market | Active Properties | Monthly Revenue | Daily Rate | Avg. Occupancy |
|---|---|---|---|---|
| Town of Mansfield | 58 | $4,670 | $517.93 | 32% |
| Town of West Seneca | 15 | $4,337 | $246.11 | 52% |
| Town of Porter | 25 | $4,243 | $300.26 | 55% |
| Town of Ellicottville | 201 | $3,840 | $380.95 | 36% |
| Sandy Township | 21 | $3,681 | $239.13 | 47% |
| North East Township | 34 | $3,530 | $264.33 | 48% |
| Town of Elma | 10 | $3,377 | $418.28 | 48% |
| Niagara-on-the-Lake | 413 | $3,358 | $265.20 | 44% |
| Town of Orchard Park | 38 | $3,302 | $252.95 | 46% |
| Tonawanda Town | 21 | $3,213 | $206.17 | 53% |