Consecon Airbnb Market Analysis 2025: Short Term Rental Data & Vacation Rental Statistics in Ontario, Canada
Is Airbnb profitable in Consecon in 2025? Explore comprehensive Airbnb analytics for Consecon, Ontario, Canada to uncover income potential. This 2025 STR market report for Consecon, based on AirROI data from April 2024 to March 2025, reveals key trends in the niche market of 26 active listings.
Whether you're considering an Airbnb investment in Consecon, optimizing your existing vacation rental, or exploring rental arbitrage opportunities, understanding the Consecon Airbnb data is crucial. Navigating the high regulation landscape is key to maximizing your short term rental income potential. Let's dive into the specifics.
Key Consecon Airbnb Performance Metrics Overview
Monthly Airbnb Revenue Variations & Income Potential in Consecon (2025)
Understanding the monthly revenue variations for Airbnb listings in Consecon is key to maximizing your short term rental income potential. Seasonality significantly impacts earnings. Our analysis, based on data from the past 12 months, shows that the peak revenue month for STRs in Consecon is typically August, while February often presents the lowest earnings, highlighting opportunities for strategic pricing adjustments during shoulder and low seasons. Explore the typical Airbnb income in Consecon across different performance tiers:
- Best-in-class properties (Top 10%) achieve $7,952+ monthly, often utilizing dynamic pricing and superior guest experiences.
- Strong performing properties (Top 25%) earn $4,789 or more, indicating effective management and desirable locations/amenities.
- Typical properties (Median) generate around $2,835 per month, representing the average market performance.
- Entry-level properties (Bottom 25%) see earnings around $1,569, often with potential for optimization.
Average Monthly Airbnb Earnings Trend in Consecon
Consecon Airbnb Occupancy Rate Trends (2025)
Maximize your bookings by understanding the Consecon STR occupancy trends. Seasonal demand shifts significantly influence how often properties are booked. Typically, Augustsees the highest demand (peak season occupancy), while March experiences the lowest (low season). Effective strategies, like adjusting minimum stays or offering promotions, can boost occupancy during slower periods. Here's how different property tiers perform in Consecon:
- Best-in-class properties (Top 10%) achieve 70%+ occupancy, indicating high desirability and potentially optimized availability.
- Strong performing properties (Top 25%) maintain 56% or higher occupancy, suggesting good market fit and guest satisfaction.
- Typical properties (Median) have an occupancy rate around 37%.
- Entry-level properties (Bottom 25%) average 22% occupancy, potentially facing higher vacancy.
Average Monthly Occupancy Rate Trend in Consecon
Average Daily Rate (ADR) Airbnb Trends in Consecon (2025)
Effective short term rental pricing strategy in Consecon involves understanding monthly ADR fluctuations. The Average Daily Rate (ADR) for Airbnb in Consecon typically peaks in July and dips lowest during March. Leveraging Airbnb dynamic pricing tools or strategies based on this seasonality can significantly boost revenue. Here's a look at the typical nightly rates achieved:
- Best-in-class properties (Top 10%) command rates of $564+ per night, often due to premium features or locations.
- Strong performing properties (Top 25%) achieve nightly rates of $339 or more.
- Typical properties (Median) charge around $232 per night.
- Entry-level properties (Bottom 25%) earn around $159 per night.
Average Daily Rate (ADR) Trend by Month in Consecon
Get Live Consecon Market Intelligence 👇

Explore Real-time Analytics
Airbnb Seasonality Analysis & Trends in Consecon (2025)
Peak Season (August, July, June)
- Revenue averages $6,718 per month
- Occupancy rates average 60.9%
- Daily rates average $325
Shoulder Season
- Revenue averages $3,320 per month
- Occupancy maintains around 36.0%
- Daily rates hold near $295
Low Season (February, March, November)
- Revenue drops to average $1,827 per month
- Occupancy decreases to average 27.6%
- Daily rates adjust to average $267
Seasonality Insights for Consecon
- The Airbnb seasonality in Consecon shows highly seasonal trends requiring careful strategy. While the sections above show seasonal averages, it's also insightful to look at the extremes:
- During the high season, the absolute peak month showcases Consecon's highest earning potential, with monthly revenues capable of climbing to $8,234, occupancy reaching a high of 73.7%, and ADRs peaking at $332.
- Conversely, the slowest single month of the year, typically falling within the low season, marks the market's lowest point. In this month, revenue might dip to $1,361, occupancy could drop to 24.0%, and ADRs may adjust down to $261.
- Understanding both the seasonal averages and these monthly peaks and troughs in revenue, occupancy, and ADR is crucial for maximizing your Airbnb profit potential in Consecon.
Seasonal Strategies for Maximizing Profit
- Peak Season: Maximize revenue through premium pricing and potentially longer minimum stays. Ensure high availability.
- Low Season: Offer competitive pricing, special promotions (e.g., extended stay discounts), and flexible cancellation policies. Target off-season travelers like remote workers or budget-conscious guests.
- Shoulder Seasons: Implement dynamic pricing that balances peak and low rates. Target weekend travelers or specific events. Offer slightly more flexible terms than peak season.
- Regularly analyze your own performance against these Consecon seasonality benchmarks and adjust your pricing and availability strategy accordingly.
Best Areas for Airbnb Investment in Consecon (2025)
Exploring the top neighborhoods for short-term rentals in Consecon? This section highlights key areas, outlining why they are attractive for hosts and guests, along with notable local attractions. Consider these locations based on your target guest profile and investment strategy.
| Neighborhood / Area | Why Host Here? (Target Guests & Appeal) | Key Attractions & Landmarks |
|---|---|---|
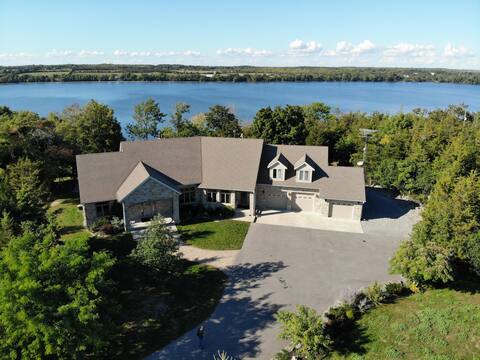
| Consecon Lake | A picturesque area known for its beautiful waterfront views and tranquil setting. Ideal for tourists looking to enjoy nature, fishing, and boating activities. | Consecon Lake, Lake Consecon Park, Fishing spots, Boating opportunities, Picnic areas |
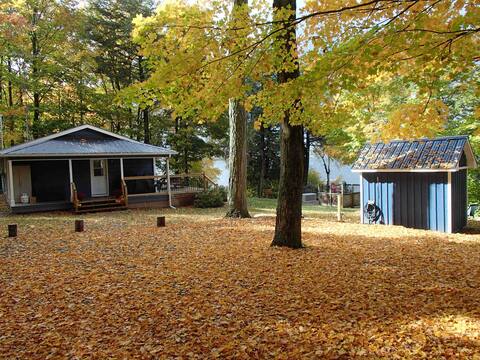
| North Beach | A serene beach area that offers a relaxing getaway for those wishing to escape the city. Perfect for families and couples looking for leisure by the water. | North Beach, Scenic walking trails, Sunbathing spots, Wildlife watching |
| Wellington Main Street | A charming village center with boutiques, cafés, and local shops. Attracts visitors interested in local culture and craftsmanship. | Wellington Heritage Museum, Local artisan shops, Cafés and restaurants, Seasonal festivals |
| Prince Edward County Wine Region | Famous for its wineries and vineyards, this area attracts wine enthusiasts and offers wine tours and tastings. | Wine tours, Vineyard tastings, Scenic countryside, Art galleries |
| Picton | The largest town in Prince Edward County, providing a vibrant downtown with restaurants and shops. Perfect for visitors looking for a mix of culture and recreation. | Picton Main Street, Picton Harbour, Local events and festivals, Shopping and dining |
| Sandbanks Provincial Park | One of Canada's most popular provincial parks, known for its stunning beaches and hiking trails. Ideal for those looking to enjoy the outdoors. | Sandbanks beaches, Hiking trails, Swimming, Nature activities |
| Ameliasburg | A quiet, rural area with access to nature and outdoor activities. Attracts guests looking for a peaceful retreat. | Natural landscapes, Hiking and biking trails, Rural charm |
| Bloomfield | A quaint village with a rich history and a community feel. Known for its arts scene and local markets, making it attractive to visitors seeking a unique experience. | Local art galleries, Farmers market, Historic sites, Community events |
Understanding Airbnb License Requirements & STR Laws in Consecon (2025)
Yes, Consecon, Ontario, Canada enforces high STR regulations. Obtaining a license and ensuring compliance is almost certainly required according to current 2025 STR laws. Always verify the latest short term rental regulations and Airbnb license requirements directly with local government authorities for Consecon to ensure full compliance before hosting.
(Source: AirROI data, 2025, based on 58% licensed listings)
Top Performing Airbnb Properties in Consecon (2025)
Benchmark your potential! Explore examples of top-performing Airbnb properties in Conseconbased on Trailing Twelve Month (TTM) revenue. Analyze their characteristics, revenue, occupancy rate, and ADR to understand what drives success in this market.
6 Acre | 8 Bedroom Lakefront | Pickleball Court
Entire Place • 8 bedrooms

Muskoka-Style Lakefront Cottage with Pool & Sauna
Entire Place • 5 bedrooms

A modern “County Creek House” in PEC (MT20211638)
Entire Place • 4 bedrooms

The Hudson | Waterfront with Hot Tub
Entire Place • 2 bedrooms
Charming Waterfront Home
Entire Place • 3 bedrooms

The Pink House
Entire Place • 4 bedrooms
Note: Performance varies based on location, size, amenities, seasonality, and management quality. Data reflects the past 12 months.
Top Performing Airbnb Hosts in Consecon (2025)
Learn from the best! This table showcases top-performing Airbnb hosts in Consecon based on the number of properties managed and estimated total revenue over the past year. Analyze their scale and performance metrics.
| Host Name | Properties | Grossing Revenue | Stay Reviews | Avg Rating |
|---|---|---|---|---|
| County Curated | 2 | $210,071 | 97 | 4.76/5.0 |
| Heather | 1 | $96,947 | 225 | 4.93/5.0 |
| Heather | 1 | $87,566 | 105 | 4.93/5.0 |
| Allison | 3 | $54,820 | 235 | 4.76/5.0 |
| Penny | 1 | $45,951 | 86 | 5.00/5.0 |
| Alice | 1 | $45,906 | 64 | 4.94/5.0 |
| Dale & Roz | 1 | $44,172 | 213 | 5.00/5.0 |
| Donna & Bobby | 1 | $42,467 | 100 | 4.92/5.0 |
| Shannon | 1 | $40,630 | 89 | 4.85/5.0 |
| Karen | 1 | $39,948 | 26 | 4.96/5.0 |
Analyzing the strategies of top hosts, such as their property selection, pricing, and guest communication, can offer valuable lessons for optimizing your own Airbnb operations in Consecon.
Dive Deeper: Advanced Consecon STR Market Data (2025)
Ready to unlock more insights? AirROI provides access to advanced metrics and comprehensive Airbnb data for Consecon. Explore detailed analytics beyond this report to refine your investment strategy, optimize pricing, and maximize your vacation rental profits.
Explore Advanced MetricsConsecon Short-Term Rental Market Composition (2025): Property & Room Types
Room Type Distribution
Property Type Distribution
Market Composition Insights for Consecon
- The Consecon Airbnb market composition is heavily skewed towards Entire Home/Apt listings, which make up 100% of the 26 active rentals. This indicates strong guest preference for privacy and space.
- Looking at the property type distribution in Consecon, House properties are the most common (76.9%), reflecting the local real estate landscape.
- Houses represent a significant 76.9% portion, catering likely to families or larger groups.
- Smaller segments like apartment/condo, hotel/boutique, outdoor/unique (combined 11.4%) offer potential for unique stay experiences.
Consecon Airbnb Room Capacity Analysis (2025): Bedroom Distribution
Distribution of Listings by Number of Bedrooms
Room Capacity Insights for Consecon
- The dominant room capacity in Consecon is 1 bedroom listings, making up 30.8% of the market. This suggests a strong demand for properties suitable for couples or solo travelers.
- Together, 1 bedroom and 3 bedrooms properties represent 53.9% of the active Airbnb listings in Consecon, indicating a high concentration in these sizes.
- A significant 50.0% of listings offer 3+ bedrooms, catering to larger groups and families seeking more space in Consecon.
Consecon Vacation Rental Guest Capacity Trends (2025)
Distribution of Listings by Guest Capacity
Guest Capacity Insights for Consecon
- The most common guest capacity trend in Consecon vacation rentals is listings accommodating 8+ guests (26.9%). This suggests the primary traveler segment is likely larger groups.
- Properties designed for 8+ guests and 2 guests dominate the Consecon STR market, accounting for 50.0% of listings.
- 50.0% of properties accommodate 6+ guests, serving the market segment for larger families or group travel in Consecon.
- On average, properties in Consecon are equipped to host 5.0 guests.
Consecon Airbnb Booking Patterns (2025): Available vs. Booked Days
Available Days Distribution
Booked Days Distribution
Booking Pattern Insights for Consecon
- The most common availability pattern in Consecon falls within the 181-270 days range, representing 42.3% of listings. This suggests many properties have significant open periods on their calendars.
- Approximately 84.6% of listings show high availability (181+ days open annually), indicating potential for increased bookings or specific owner usage patterns.
- For booked days, the 31-90 days range is most frequent in Consecon (42.3%), reflecting common guest stay durations or potential owner blocking patterns.
- A notable 19.2% of properties secure long booking periods (181+ days booked per year), highlighting successful long-term rental strategies or significant owner usage.
Consecon Airbnb Minimum Stay Requirements Analysis
Distribution of Listings by Minimum Night Requirement
1 Night
3 listings
12% of total
2 Nights
15 listings
60% of total
3 Nights
2 listings
8% of total
30+ Nights
5 listings
20% of total
Key Insights
- The most prevalent minimum stay requirement in Consecon is 2 Nights, adopted by 60% of listings. This highlights the market's preference for shorter, flexible bookings.
- A strong majority (72.0%) of the Consecon Airbnb data shows acceptance of very short stays (1-2 nights), indicating a dynamic, high-turnover market.
- A significant segment (20%) caters to monthly stays (30+ nights) in Consecon, pointing to opportunities in the extended-stay market.
Recommendations
- Align with the market by considering a 2 Nights minimum stay, as 60% of Consecon hosts use this setting.
- If feasible, allowing 1-night stays, especially midweek or during low season, could capture last-minute bookings, as only 12% currently do.
- A 2-night minimum appears standard (60%). Consider this for weekends or peak periods.
- Explore offering discounts for stays of 30+ nights to attract the 20% of the market seeking extended stays.
- Adjust minimum nights based on seasonality – potentially shorter during low season and longer during peak demand periods in Consecon.
Consecon Airbnb Cancellation Policy Trends Analysis (2025)
Super Strict 30 Days
1 listings
3.8% of total
Flexible
2 listings
7.7% of total
Moderate
11 listings
42.3% of total
Firm
6 listings
23.1% of total
Strict
6 listings
23.1% of total
Cancellation Policy Insights for Consecon
- The prevailing Airbnb cancellation policy trend in Consecon is Moderate, used by 42.3% of listings.
- There's a relatively balanced mix between guest-friendly (50.0%) and stricter (46.2%) policies, offering choices for different guest needs.
Recommendations for Hosts
- Consider adopting a Moderate policy to align with the 42.3% market standard in Consecon.
- Regularly review your cancellation policy against competitors and market demand shifts in Consecon.
Consecon STR Booking Lead Time Analysis (2025)
Average Booking Lead Time by Month
Booking Lead Time Insights for Consecon
- The overall average booking lead time for vacation rentals in Consecon is 56 days.
- Guests book furthest in advance for stays during August (average 95 days), likely coinciding with peak travel demand or local events.
- The shortest booking windows occur for stays in November (average 40 days), indicating more last-minute travel plans during this time.
- Seasonally, Summer (81 days avg.) sees the longest lead times, while Fall (49 days avg.) has the shortest, reflecting typical travel planning cycles.
Recommendations for Hosts
- Use the overall average lead time (56 days) as a baseline for your pricing and availability strategy in Consecon.
- For August stays, consider implementing length-of-stay discounts or slightly higher rates for bookings made less than 95 days out to capitalize on advance planning.
- Target marketing efforts for the Summer season well in advance (at least 81 days) to capture early planners.
- Monitor your own booking lead times against these Consecon averages to identify opportunities for dynamic pricing adjustments.
Popular & Essential Airbnb Amenities in Consecon (2025)
Amenity Prevalence
Amenity Insights for Consecon
- Essential amenities in Consecon that guests expect include: Smoke alarm, Heating, Free parking on premises, Hot water, Dishes and silverware, Carbon monoxide alarm, Fire extinguisher, Backyard, Kitchen, Essentials. Lacking these (any) could significantly impact bookings.
Recommendations for Hosts
- Ensure your listing includes all essential amenities for Consecon: Smoke alarm, Heating, Free parking on premises, Hot water, Dishes and silverware, Carbon monoxide alarm, Fire extinguisher, Backyard, Kitchen, Essentials.
- Prioritize adding missing essentials: Fire extinguisher, Backyard, Kitchen, Essentials.
- Highlight unique or less common amenities you offer (e.g., hot tub, dedicated workspace, EV charger) in your listing description and photos.
- Regularly check competitor amenities in Consecon to stay competitive.
Consecon Airbnb Guest Demographics & Profile Analysis (2025)
Guest Profile Summary for Consecon
- The typical guest profile for Airbnb in Consecon consists of primarily domestic travelers (93%), often arriving from nearby Toronto, typically belonging to the Post-2000s (Gen Z/Alpha) group (50%), primarily speaking English or French.
- Domestic travelers account for 92.5% of guests.
- Key international markets include Canada (92.5%) and United States (4.1%).
- Top languages spoken are English (56.1%) followed by French (24.7%).
- A significant demographic segment is the Post-2000s (Gen Z/Alpha) group, representing 50% of guests.
Recommendations for Hosts
- Target domestic marketing efforts towards travelers from Toronto and Ottawa.
- Tailor amenities and listing descriptions to appeal to the dominant Post-2000s (Gen Z/Alpha) demographic (e.g., highlight fast WiFi, smart home features, local guides).
- Highlight unique local experiences or amenities relevant to the primary guest profile.
- Consider seasonal promotions aligned with peak travel times for key origin markets.
Nearby Short-Term Rental Market Comparison
How does the Consecon Airbnb market stack up against its neighbors? Compare key performance metrics like average monthly revenue, ADR, and occupancy rates in surrounding areas to understand the broader regional STR landscape.
| Market | Active Properties | Monthly Revenue | Daily Rate | Avg. Occupancy |
|---|---|---|---|---|
| Rushville | 13 | $6,613 | $489.17 | 50% |
| Naples | 21 | $6,262 | $553.45 | 47% |
| Town of Otisco | 19 | $5,936 | $404.67 | 44% |
| Town of Skaneateles | 62 | $5,047 | $476.41 | 46% |
| Town of Varick | 32 | $4,969 | $420.62 | 46% |
| Town of Canandaigua | 84 | $4,922 | $429.04 | 44% |
| Town of Torrey | 29 | $4,796 | $376.23 | 51% |
| Town of Mansfield | 58 | $4,670 | $517.93 | 32% |
| Town of Pulteney | 63 | $4,627 | $428.38 | 46% |
| Town of Niles | 34 | $4,449 | $670.82 | 41% |