Carling Township Airbnb Market Analysis 2025: Short Term Rental Data & Vacation Rental Statistics in Ontario, Canada
Is Airbnb profitable in Carling Township in 2025? Explore comprehensive Airbnb analytics for Carling Township, Ontario, Canada to uncover income potential. This 2025 STR market report for Carling Township, based on AirROI data from April 2024 to March 2025, reveals key trends in the niche market of 44 active listings.
Whether you're considering an Airbnb investment in Carling Township, optimizing your existing vacation rental, or exploring rental arbitrage opportunities, understanding the Carling Township Airbnb data is crucial. Leveraging the low regulation environment is key to maximizing your short term rental income potential. Let's dive into the specifics.
Key Carling Township Airbnb Performance Metrics Overview
Monthly Airbnb Revenue Variations & Income Potential in Carling Township (2025)
Understanding the monthly revenue variations for Airbnb listings in Carling Township is key to maximizing your short term rental income potential. Seasonality significantly impacts earnings. Our analysis, based on data from the past 12 months, shows that the peak revenue month for STRs in Carling Township is typically August, while January often presents the lowest earnings, highlighting opportunities for strategic pricing adjustments during shoulder and low seasons. Explore the typical Airbnb income in Carling Township across different performance tiers:
- Best-in-class properties (Top 10%) achieve $6,558+ monthly, often utilizing dynamic pricing and superior guest experiences.
- Strong performing properties (Top 25%) earn $4,999 or more, indicating effective management and desirable locations/amenities.
- Typical properties (Median) generate around $3,353 per month, representing the average market performance.
- Entry-level properties (Bottom 25%) see earnings around $2,054, often with potential for optimization.
Average Monthly Airbnb Earnings Trend in Carling Township
Carling Township Airbnb Occupancy Rate Trends (2025)
Maximize your bookings by understanding the Carling Township STR occupancy trends. Seasonal demand shifts significantly influence how often properties are booked. Typically, Augustsees the highest demand (peak season occupancy), while May experiences the lowest (low season). Effective strategies, like adjusting minimum stays or offering promotions, can boost occupancy during slower periods. Here's how different property tiers perform in Carling Township:
- Best-in-class properties (Top 10%) achieve 72%+ occupancy, indicating high desirability and potentially optimized availability.
- Strong performing properties (Top 25%) maintain 57% or higher occupancy, suggesting good market fit and guest satisfaction.
- Typical properties (Median) have an occupancy rate around 42%.
- Entry-level properties (Bottom 25%) average 22% occupancy, potentially facing higher vacancy.
Average Monthly Occupancy Rate Trend in Carling Township
Average Daily Rate (ADR) Airbnb Trends in Carling Township (2025)
Effective short term rental pricing strategy in Carling Township involves understanding monthly ADR fluctuations. The Average Daily Rate (ADR) for Airbnb in Carling Township typically peaks in July and dips lowest during March. Leveraging Airbnb dynamic pricing tools or strategies based on this seasonality can significantly boost revenue. Here's a look at the typical nightly rates achieved:
- Best-in-class properties (Top 10%) command rates of $436+ per night, often due to premium features or locations.
- Strong performing properties (Top 25%) achieve nightly rates of $298 or more.
- Typical properties (Median) charge around $235 per night.
- Entry-level properties (Bottom 25%) earn around $182 per night.
Average Daily Rate (ADR) Trend by Month in Carling Township
Get Live Carling Township Market Intelligence 👇

Explore Real-time Analytics
Airbnb Seasonality Analysis & Trends in Carling Township (2025)
Peak Season (August, April, July)
- Revenue averages $5,657 per month
- Occupancy rates average 59.0%
- Daily rates average $288
Shoulder Season
- Revenue averages $3,528 per month
- Occupancy maintains around 38.3%
- Daily rates hold near $266
Low Season (January, March, October)
- Revenue drops to average $2,147 per month
- Occupancy decreases to average 30.1%
- Daily rates adjust to average $254
Seasonality Insights for Carling Township
- The Airbnb seasonality in Carling Township shows highly seasonal trends requiring careful strategy. While the sections above show seasonal averages, it's also insightful to look at the extremes:
- During the high season, the absolute peak month showcases Carling Township's highest earning potential, with monthly revenues capable of climbing to $6,040, occupancy reaching a high of 64.4%, and ADRs peaking at $297.
- Conversely, the slowest single month of the year, typically falling within the low season, marks the market's lowest point. In this month, revenue might dip to $1,959, occupancy could drop to 27.7%, and ADRs may adjust down to $242.
- Understanding both the seasonal averages and these monthly peaks and troughs in revenue, occupancy, and ADR is crucial for maximizing your Airbnb profit potential in Carling Township.
Seasonal Strategies for Maximizing Profit
- Peak Season: Maximize revenue through premium pricing and potentially longer minimum stays. Ensure high availability.
- Low Season: Offer competitive pricing, special promotions (e.g., extended stay discounts), and flexible cancellation policies. Target off-season travelers like remote workers or budget-conscious guests.
- Shoulder Seasons: Implement dynamic pricing that balances peak and low rates. Target weekend travelers or specific events. Offer slightly more flexible terms than peak season.
- Regularly analyze your own performance against these Carling Township seasonality benchmarks and adjust your pricing and availability strategy accordingly.
Best Areas for Airbnb Investment in Carling Township (2025)
Exploring the top neighborhoods for short-term rentals in Carling Township? This section highlights key areas, outlining why they are attractive for hosts and guests, along with notable local attractions. Consider these locations based on your target guest profile and investment strategy.
| Neighborhood / Area | Why Host Here? (Target Guests & Appeal) | Key Attractions & Landmarks |
|---|---|---|
| Carling Bay | A scenic waterfront area popular for its beautiful views and water activities. Attracts families and tourists looking to enjoy nature, swimming, and boating. | Carling Bay Beach, Docking facilities, Nature trails, Picnic areas, Stargazing spots |
| Parry Sound Area | A well-known tourist destination with rich cultural heritage and stunning landscapes. Ideal for vacation rentals and tourists interested in outdoor adventures and relaxation. | Parry Sound Marina, Hiking trails, Fishing spots, Cultural events, Historical tours |
| Aula Park | A quiet suburban area with easy access to parks and recreational facilities. Great for families and those seeking a calm atmosphere while still being close to attractions. | Local parks, Playgrounds, Walking trails, Community events, Nearby shops |
| Lake Manitouwabing | A popular spot for summer vacations with its clear waters and fishing opportunities. Attracts outdoor enthusiasts and nature lovers. | Lake activities, Fishing, Canoeing, Guided tours, Campgrounds |
| Killarney Provincial Park | Known for its stunning natural beauty, this park attracts nature lovers and those seeking outdoor adventures. A prime spot for hosting eco-friendly stays. | Hiking trails, Kayaking, Wildlife viewing, Photography, Camping |
| Nobel | A charming small town with access to lakes and nature, ideal for quiet getaways and family vacations away from the city bustle. | Local crafts, Small shops, Scenic views, Fishing, Canoeing |
| Homewood | A close-knit community that offers recreational opportunities and a relaxing environment. Perfect for those looking to escape to a quieter life while still being near attractions. | Community events, Nature trails, Cultural festivals, Local dining, Fishing spots |
| Muskoka Lakes | Renowned as a premier vacation destination, this area is famous for its beautiful lakes and high-end cabins. Ideal for luxury Airbnb rentals. | Muskoka Lake activities, Boating, Gourmet dining, Scenic views, Wellness retreats |
Understanding Airbnb License Requirements & STR Laws in Carling Township (2025)
While Carling Township, Ontario, Canada currently shows low STR regulations, specific Airbnb license requirements might still exist or change. Always verify the latest short term rental regulations and Airbnb license requirements directly with local government authorities for Carling Township to ensure full compliance before hosting.
(Source: AirROI data, 2025, finding no licensed listings among those analyzed)
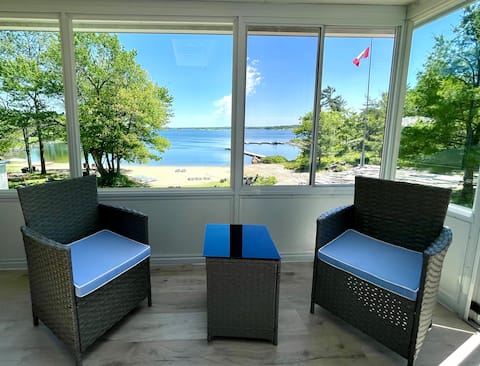
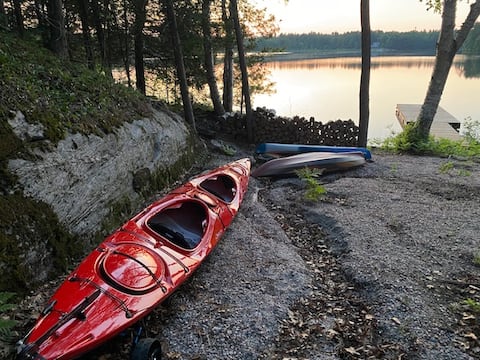
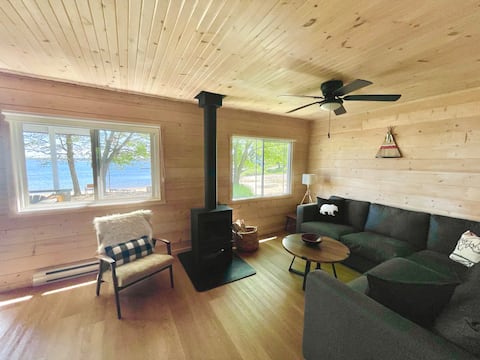
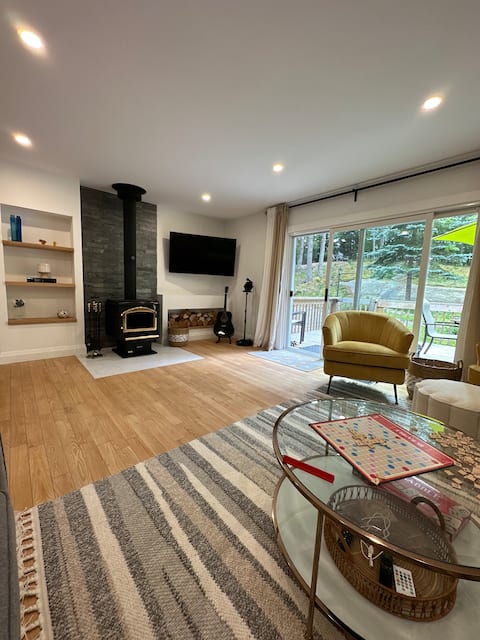
Top Performing Airbnb Properties in Carling Township (2025)
Benchmark your potential! Explore examples of top-performing Airbnb properties in Carling Townshipbased on Trailing Twelve Month (TTM) revenue. Analyze their characteristics, revenue, occupancy rate, and ADR to understand what drives success in this market.
Georgian Bay 3-bdrm lakefront Main House
Entire Place • 3 bedrooms
LakeHaven: New, inspired, monthly retreat
Entire Place • 3 bedrooms
Georgian Bay Rockwood 3-bdrm Waterfront Cottage #2
Entire Place • 3 bedrooms
"4BR Cottage: Hot Tub, Sauna, Beach Access, Parks"
Entire Place • 4 bedrooms

Explore Carling Bay from this Waterfront Retreat
Entire Place • 5 bedrooms
Georgian Bay Lakeview Cottage (Rockwood #5)
Entire Place • 3 bedrooms
Note: Performance varies based on location, size, amenities, seasonality, and management quality. Data reflects the past 12 months.
Top Performing Airbnb Hosts in Carling Township (2025)
Learn from the best! This table showcases top-performing Airbnb hosts in Carling Township based on the number of properties managed and estimated total revenue over the past year. Analyze their scale and performance metrics.
| Host Name | Properties | Grossing Revenue | Stay Reviews | Avg Rating |
|---|---|---|---|---|
| LakeFront Resorts | 11 | $481,378 | 255 | 3.86/5.0 |
| Dmitry | 11 | $225,547 | 102 | 3.96/5.0 |
| Katawoda | 10 | $138,060 | 81 | 4.61/5.0 |
| Sam | 1 | $76,147 | 3 | 5.00/5.0 |
| Lukas | 1 | $60,071 | 17 | 4.76/5.0 |
| James | 1 | $58,493 | 21 | 4.95/5.0 |
| Thomas | 1 | $49,701 | 5 | 5.00/5.0 |
| Tammy Chung | 1 | $35,996 | 27 | 4.89/5.0 |
| Emily | 1 | $29,655 | 9 | 4.89/5.0 |
| Loretta | 1 | $26,446 | 26 | 5.00/5.0 |
Analyzing the strategies of top hosts, such as their property selection, pricing, and guest communication, can offer valuable lessons for optimizing your own Airbnb operations in Carling Township.
Dive Deeper: Advanced Carling Township STR Market Data (2025)
Ready to unlock more insights? AirROI provides access to advanced metrics and comprehensive Airbnb data for Carling Township. Explore detailed analytics beyond this report to refine your investment strategy, optimize pricing, and maximize your vacation rental profits.
Explore Advanced MetricsCarling Township Short-Term Rental Market Composition (2025): Property & Room Types
Room Type Distribution
Property Type Distribution
Market Composition Insights for Carling Township
- The Carling Township Airbnb market composition is heavily skewed towards Entire Home/Apt listings, which make up 100% of the 44 active rentals. This indicates strong guest preference for privacy and space.
- Looking at the property type distribution in Carling Township, House properties are the most common (75%), reflecting the local real estate landscape.
- Houses represent a significant 75% portion, catering likely to families or larger groups.
Carling Township Airbnb Room Capacity Analysis (2025): Bedroom Distribution
Distribution of Listings by Number of Bedrooms
Room Capacity Insights for Carling Township
- The dominant room capacity in Carling Township is 2 bedrooms listings, making up 43.2% of the market. This suggests a strong demand for properties suitable for couples or solo travelers.
- Together, 2 bedrooms and 3 bedrooms properties represent 81.8% of the active Airbnb listings in Carling Township, indicating a high concentration in these sizes.
- A significant 47.6% of listings offer 3+ bedrooms, catering to larger groups and families seeking more space in Carling Township.
Carling Township Vacation Rental Guest Capacity Trends (2025)
Distribution of Listings by Guest Capacity
Guest Capacity Insights for Carling Township
- The most common guest capacity trend in Carling Township vacation rentals is listings accommodating 6 guests (38.6%). This suggests the primary traveler segment is likely larger groups.
- Properties designed for 6 guests and 4 guests dominate the Carling Township STR market, accounting for 70.4% of listings.
- 50.0% of properties accommodate 6+ guests, serving the market segment for larger families or group travel in Carling Township.
- On average, properties in Carling Township are equipped to host 5.1 guests.
Carling Township Airbnb Booking Patterns (2025): Available vs. Booked Days
Available Days Distribution
Booked Days Distribution
Booking Pattern Insights for Carling Township
- The most common availability pattern in Carling Township falls within the 271-366 days range, representing 43.2% of listings. This suggests many properties have significant open periods on their calendars.
- Approximately 84.1% of listings show high availability (181+ days open annually), indicating potential for increased bookings or specific owner usage patterns.
- For booked days, the 91-180 days range is most frequent in Carling Township (40.9%), reflecting common guest stay durations or potential owner blocking patterns.
- A notable 18.2% of properties secure long booking periods (181+ days booked per year), highlighting successful long-term rental strategies or significant owner usage.
Carling Township Airbnb Minimum Stay Requirements Analysis
Distribution of Listings by Minimum Night Requirement
1 Night
20 listings
50% of total
2 Nights
4 listings
10% of total
3 Nights
3 listings
7.5% of total
4-6 Nights
2 listings
5% of total
7-29 Nights
1 listings
2.5% of total
30+ Nights
10 listings
25% of total
Key Insights
- The most prevalent minimum stay requirement in Carling Township is 1 Night, adopted by 50% of listings. This highlights the market's preference for shorter, flexible bookings.
- A significant segment (25%) caters to monthly stays (30+ nights) in Carling Township, pointing to opportunities in the extended-stay market.
Recommendations
- Align with the market by considering a 1 Night minimum stay, as 50% of Carling Township hosts use this setting.
- Explore offering discounts for stays of 30+ nights to attract the 25% of the market seeking extended stays.
- Adjust minimum nights based on seasonality – potentially shorter during low season and longer during peak demand periods in Carling Township.
Carling Township Airbnb Cancellation Policy Trends Analysis (2025)
Super Strict 60 Days
10 listings
26.3% of total
Flexible
18 listings
47.4% of total
Moderate
3 listings
7.9% of total
Firm
4 listings
10.5% of total
Strict
3 listings
7.9% of total
Cancellation Policy Insights for Carling Township
- The prevailing Airbnb cancellation policy trend in Carling Township is Flexible, used by 47.4% of listings.
- There's a relatively balanced mix between guest-friendly (55.3%) and stricter (18.4%) policies, offering choices for different guest needs.
- Strict cancellation policies are quite rare (7.9%), potentially making listings with this policy less competitive unless justified by high demand or property type.
Recommendations for Hosts
- Consider adopting a Flexible policy to align with the 47.4% market standard in Carling Township.
- Using a Strict policy might deter some guests, as only 7.9% of listings use it. Evaluate if potential revenue protection outweighs possible lower booking rates.
- Regularly review your cancellation policy against competitors and market demand shifts in Carling Township.
Carling Township STR Booking Lead Time Analysis (2025)
Average Booking Lead Time by Month
Booking Lead Time Insights for Carling Township
- The overall average booking lead time for vacation rentals in Carling Township is 48 days.
- Guests book furthest in advance for stays during April (average 85 days), likely coinciding with peak travel demand or local events.
- The shortest booking windows occur for stays in January (average 6 days), indicating more last-minute travel plans during this time.
- Seasonally, Summer (70 days avg.) sees the longest lead times, while Winter (25 days avg.) has the shortest, reflecting typical travel planning cycles.
Recommendations for Hosts
- Use the overall average lead time (48 days) as a baseline for your pricing and availability strategy in Carling Township.
- For April stays, consider implementing length-of-stay discounts or slightly higher rates for bookings made less than 85 days out to capitalize on advance planning.
- During January, focus on last-minute booking availability and promotions, as guests book with very short notice (6 days avg.).
- Target marketing efforts for the Summer season well in advance (at least 70 days) to capture early planners.
- Monitor your own booking lead times against these Carling Township averages to identify opportunities for dynamic pricing adjustments.
Popular & Essential Airbnb Amenities in Carling Township (2025)
Amenity Prevalence
Amenity Insights for Carling Township
- Essential amenities in Carling Township that guests expect include: Free parking on premises, Kitchen, Heating, Lake access. Lacking these (any) could significantly impact bookings.
- Popular amenities like Smoke alarm, Carbon monoxide alarm, BBQ grill are common but not universal. Offering these can provide a competitive edge.
Recommendations for Hosts
- Ensure your listing includes all essential amenities for Carling Township: Free parking on premises, Kitchen, Heating, Lake access.
- Prioritize adding missing essentials: Heating, Lake access.
- Consider adding popular differentiators like Smoke alarm or Carbon monoxide alarm to increase appeal.
- Highlight unique or less common amenities you offer (e.g., hot tub, dedicated workspace, EV charger) in your listing description and photos.
- Regularly check competitor amenities in Carling Township to stay competitive.
Carling Township Airbnb Guest Demographics & Profile Analysis (2025)
Guest Profile Summary for Carling Township
- The typical guest profile for Airbnb in Carling Township consists of primarily domestic travelers (91%), often arriving from nearby Toronto, typically belonging to the Post-2000s (Gen Z/Alpha) group (50%), primarily speaking English or Hindi.
- Domestic travelers account for 91.2% of guests.
- Key international markets include Canada (91.2%) and United States (4.8%).
- Top languages spoken are English (55.2%) followed by Hindi (7.5%).
- A significant demographic segment is the Post-2000s (Gen Z/Alpha) group, representing 50% of guests.
Recommendations for Hosts
- Target domestic marketing efforts towards travelers from Toronto and Mississauga.
- Tailor amenities and listing descriptions to appeal to the dominant Post-2000s (Gen Z/Alpha) demographic (e.g., highlight fast WiFi, smart home features, local guides).
- Highlight unique local experiences or amenities relevant to the primary guest profile.
- Consider seasonal promotions aligned with peak travel times for key origin markets.
Nearby Short-Term Rental Market Comparison
How does the Carling Township Airbnb market stack up against its neighbors? Compare key performance metrics like average monthly revenue, ADR, and occupancy rates in surrounding areas to understand the broader regional STR landscape.
| Market | Active Properties | Monthly Revenue | Daily Rate | Avg. Occupancy |
|---|---|---|---|---|
| McMurrich/Monteith Township | 26 | $3,922 | $372.53 | 42% |
| South River | 10 | $3,752 | $259.89 | 45% |
| Muskoka Lakes Township | 376 | $3,060 | $435.47 | 38% |
| McKellar Township | 39 | $2,980 | $368.05 | 40% |
| Huntsville | 305 | $2,978 | $273.77 | 43% |
| Kearney | 59 | $2,897 | $263.86 | 44% |
| Bracebridge | 207 | $2,862 | $321.96 | 40% |
| Perry Township | 61 | $2,845 | $282.82 | 43% |
| Severn | 154 | $2,845 | $306.35 | 39% |
| Meaford | 129 | $2,843 | $246.44 | 45% |