Cambridge Airbnb Market Analysis 2025: Short Term Rental Data & Vacation Rental Statistics in Ontario, Canada
Is Airbnb profitable in Cambridge in 2025? Explore comprehensive Airbnb analytics for Cambridge, Ontario, Canada to uncover income potential. This 2025 STR market report for Cambridge, based on AirROI data from April 2024 to March 2025, reveals key trends in the niche market of 161 active listings.
Whether you're considering an Airbnb investment in Cambridge, optimizing your existing vacation rental, or exploring rental arbitrage opportunities, understanding the Cambridge Airbnb data is crucial. Leveraging the low regulation environment is key to maximizing your short term rental income potential. Let's dive into the specifics.
Key Cambridge Airbnb Performance Metrics Overview
Monthly Airbnb Revenue Variations & Income Potential in Cambridge (2025)
Understanding the monthly revenue variations for Airbnb listings in Cambridge is key to maximizing your short term rental income potential. Seasonality significantly impacts earnings. Our analysis, based on data from the past 12 months, shows that the peak revenue month for STRs in Cambridge is typically June, while February often presents the lowest earnings, highlighting opportunities for strategic pricing adjustments during shoulder and low seasons. Explore the typical Airbnb income in Cambridge across different performance tiers:
- Best-in-class properties (Top 10%) achieve $3,785+ monthly, often utilizing dynamic pricing and superior guest experiences.
- Strong performing properties (Top 25%) earn $2,377 or more, indicating effective management and desirable locations/amenities.
- Typical properties (Median) generate around $1,364 per month, representing the average market performance.
- Entry-level properties (Bottom 25%) see earnings around $616, often with potential for optimization.
Average Monthly Airbnb Earnings Trend in Cambridge
Cambridge Airbnb Occupancy Rate Trends (2025)
Maximize your bookings by understanding the Cambridge STR occupancy trends. Seasonal demand shifts significantly influence how often properties are booked. Typically, Augustsees the highest demand (peak season occupancy), while March experiences the lowest (low season). Effective strategies, like adjusting minimum stays or offering promotions, can boost occupancy during slower periods. Here's how different property tiers perform in Cambridge:
- Best-in-class properties (Top 10%) achieve 85%+ occupancy, indicating high desirability and potentially optimized availability.
- Strong performing properties (Top 25%) maintain 67% or higher occupancy, suggesting good market fit and guest satisfaction.
- Typical properties (Median) have an occupancy rate around 44%.
- Entry-level properties (Bottom 25%) average 23% occupancy, potentially facing higher vacancy.
Average Monthly Occupancy Rate Trend in Cambridge
Average Daily Rate (ADR) Airbnb Trends in Cambridge (2025)
Effective short term rental pricing strategy in Cambridge involves understanding monthly ADR fluctuations. The Average Daily Rate (ADR) for Airbnb in Cambridge typically peaks in November and dips lowest during April. Leveraging Airbnb dynamic pricing tools or strategies based on this seasonality can significantly boost revenue. Here's a look at the typical nightly rates achieved:
- Best-in-class properties (Top 10%) command rates of $163+ per night, often due to premium features or locations.
- Strong performing properties (Top 25%) achieve nightly rates of $117 or more.
- Typical properties (Median) charge around $73 per night.
- Entry-level properties (Bottom 25%) earn around $48 per night.
Average Daily Rate (ADR) Trend by Month in Cambridge
Get Live Cambridge Market Intelligence 👇

Explore Real-time Analytics
Airbnb Seasonality Analysis & Trends in Cambridge (2025)
Peak Season (June, May, July)
- Revenue averages $2,366 per month
- Occupancy rates average 49.0%
- Daily rates average $95
Shoulder Season
- Revenue averages $1,821 per month
- Occupancy maintains around 47.1%
- Daily rates hold near $96
Low Season (January, February, March)
- Revenue drops to average $1,256 per month
- Occupancy decreases to average 40.1%
- Daily rates adjust to average $96
Seasonality Insights for Cambridge
- The Airbnb seasonality in Cambridge shows highly seasonal trends requiring careful strategy. While the sections above show seasonal averages, it's also insightful to look at the extremes:
- During the high season, the absolute peak month showcases Cambridge's highest earning potential, with monthly revenues capable of climbing to $2,476, occupancy reaching a high of 56.8%, and ADRs peaking at $101.
- Conversely, the slowest single month of the year, typically falling within the low season, marks the market's lowest point. In this month, revenue might dip to $1,135, occupancy could drop to 37.8%, and ADRs may adjust down to $94.
- Understanding both the seasonal averages and these monthly peaks and troughs in revenue, occupancy, and ADR is crucial for maximizing your Airbnb profit potential in Cambridge.
Seasonal Strategies for Maximizing Profit
- Peak Season: Maximize revenue through premium pricing and potentially longer minimum stays. Ensure high availability.
- Low Season: Offer competitive pricing, special promotions (e.g., extended stay discounts), and flexible cancellation policies. Target off-season travelers like remote workers or budget-conscious guests.
- Shoulder Seasons: Implement dynamic pricing that balances peak and low rates. Target weekend travelers or specific events. Offer slightly more flexible terms than peak season.
- Regularly analyze your own performance against these Cambridge seasonality benchmarks and adjust your pricing and availability strategy accordingly.
Best Areas for Airbnb Investment in Cambridge (2025)
Exploring the top neighborhoods for short-term rentals in Cambridge? This section highlights key areas, outlining why they are attractive for hosts and guests, along with notable local attractions. Consider these locations based on your target guest profile and investment strategy.
| Neighborhood / Area | Why Host Here? (Target Guests & Appeal) | Key Attractions & Landmarks |
|---|---|---|
| Downtown Cambridge | The heart of the city with a vibrant atmosphere, historic buildings, and a growing number of restaurants and shops. Ideal for guests wanting to experience local culture and amenities. | Galt City Hall, Cambridge Mill, Wellington County Museum and Archives, Duncan McIntosh Park, Cambridge Farmers Market |
| Preston | A charming, historic neighborhood with a strong sense of community and proximity to the Grand River. Great for travelers seeking a quiet yet convenient location. | Duncan Park, Preston Memorial Auditorium, Grand River Trails, Dawn Park, Local cafes and cultural events |
| Hespeler | This area offers a unique blend of history and modern living, with picturesque views and numerous parks. Perfect for guests looking for a serene escape close to nature. | Speed River, Hespeler Village, Butterfly Conservatory, Parkhill Park, Local boutiques and eateries |
| North Cambridge | Featuring a mix of suburban living and easy access to natural parks, this area attracts families and outdoor enthusiasts. A great spot for longer stays. | Riverside Park, Langs Community Centre, Cambridge Butterfly Conservatory, Local shopping centers, Golf courses |
| University of Waterloo Area | Attracts students and academic visitors due to its proximity to the university. A good option for short-term rentals during the school year. | University of Waterloo, David Johnson Research and Technology Park, Local coffee shops, Cultural events, Research facilities |
| Cambridge Business Park | A growing commercial area with modern amenities and facilities. Ideal for business travelers looking for convenience to corporate events. | Local businesses, Networking events, Corporate services, Easy access to highways, Business-friendly accommodations |
| West Galt | Known for its historic charm and scenic waterfront, West Galt is evolving and boasts cozy cafes, galleries, and shops, making it appealing for tourists. | The Cambridge Sculpture Garden, The Grand River, Local art galleries, Parks along the river, Cafes with patio seating |
| East Cambridge | A quieter area offering residential comforts with nearby parks and community-based events. Ideal for families or groups looking for a more residential experience. | Mill Creek, Local schools and community centers, Parks for family activities, Sports facilities, Neighborhood events |
Understanding Airbnb License Requirements & STR Laws in Cambridge (2025)
While Cambridge, Ontario, Canada currently shows low STR regulations, specific Airbnb license requirements might still exist or change. Always verify the latest short term rental regulations and Airbnb license requirements directly with local government authorities for Cambridge to ensure full compliance before hosting.
(Source: AirROI data, 2025, finding no licensed listings among those analyzed)
Top Performing Airbnb Properties in Cambridge (2025)
Benchmark your potential! Explore examples of top-performing Airbnb properties in Cambridgebased on Trailing Twelve Month (TTM) revenue. Analyze their characteristics, revenue, occupancy rate, and ADR to understand what drives success in this market.
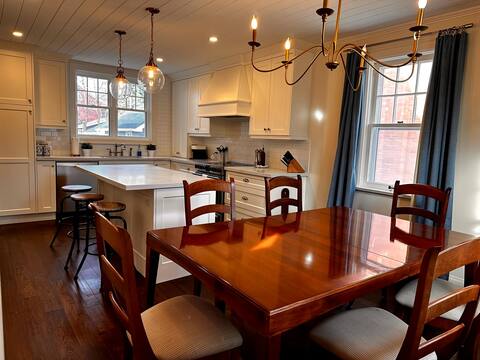
Under the Whispering Pines
Entire Place • 3 bedrooms
Luxury Villa for Accommodation & Events
Entire Place • 4 bedrooms

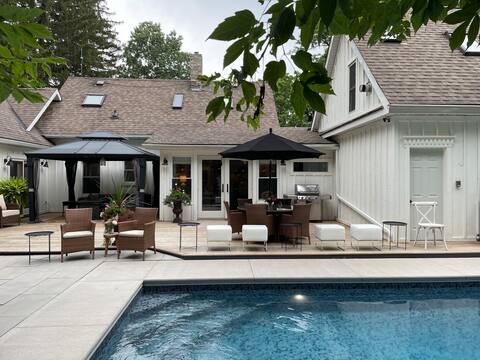
Perfect Cottage feel in the City. BBQ, POOL, GOLF
Entire Place • 5 bedrooms
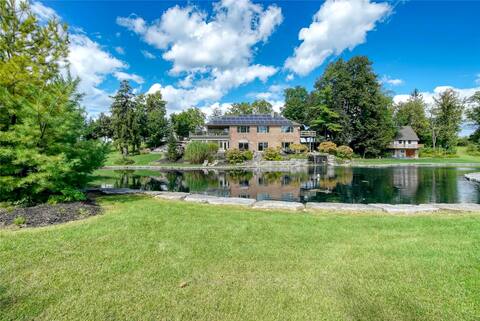
Historic House on a hill
Entire Place • 4 bedrooms

"Cottage Home On The River" 1 Bedroom
Entire Place • 1 bedroom
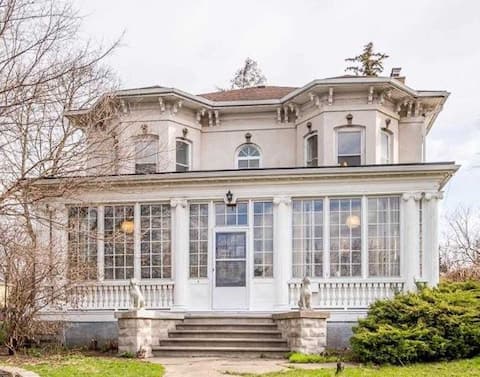
Prestigious Globe Lamped Street!
Entire Place • 4 bedrooms
Note: Performance varies based on location, size, amenities, seasonality, and management quality. Data reflects the past 12 months.
Top Performing Airbnb Hosts in Cambridge (2025)
Learn from the best! This table showcases top-performing Airbnb hosts in Cambridge based on the number of properties managed and estimated total revenue over the past year. Analyze their scale and performance metrics.
| Host Name | Properties | Grossing Revenue | Stay Reviews | Avg Rating |
|---|---|---|---|---|
| Niki | 1 | $120,076 | 12 | 5.00/5.0 |
| Bing | 2 | $119,895 | 358 | 4.88/5.0 |
| Amy | 3 | $77,167 | 166 | 4.99/5.0 |
| Hassan | 3 | $75,642 | 54 | 4.78/5.0 |
| Sai | 4 | $69,188 | 187 | 4.89/5.0 |
| Gurjeet | 1 | $57,143 | 3 | 4.00/5.0 |
| Maya | 1 | $54,998 | 13 | 4.92/5.0 |
| Marwan | 1 | $49,067 | 360 | 4.92/5.0 |
| Jillian | 3 | $48,928 | 30 | 4.80/5.0 |
| The Laundry Rooms | 2 | $48,715 | 71 | 4.88/5.0 |
Analyzing the strategies of top hosts, such as their property selection, pricing, and guest communication, can offer valuable lessons for optimizing your own Airbnb operations in Cambridge.
Dive Deeper: Advanced Cambridge STR Market Data (2025)
Ready to unlock more insights? AirROI provides access to advanced metrics and comprehensive Airbnb data for Cambridge. Explore detailed analytics beyond this report to refine your investment strategy, optimize pricing, and maximize your vacation rental profits.
Explore Advanced MetricsCambridge Short-Term Rental Market Composition (2025): Property & Room Types
Room Type Distribution
Property Type Distribution
Market Composition Insights for Cambridge
- The Cambridge Airbnb market composition is heavily skewed towards Entire Home/Apt listings, which make up 66.5% of the 161 active rentals. This indicates strong guest preference for privacy and space.
- However, a notable 33.5% share for Private Rooms suggests opportunities for budget-conscious travelers or hosts renting out spare rooms.
- Looking at the property type distribution in Cambridge, House properties are the most common (67.7%), reflecting the local real estate landscape.
- Houses represent a significant 67.7% portion, catering likely to families or larger groups.
- Smaller segments like hotel/boutique (combined 0.6%) offer potential for unique stay experiences.
Cambridge Airbnb Room Capacity Analysis (2025): Bedroom Distribution
Distribution of Listings by Number of Bedrooms
Room Capacity Insights for Cambridge
- The dominant room capacity in Cambridge is 1 bedroom listings, making up 43.5% of the market. This suggests a strong demand for properties suitable for couples or solo travelers.
- Together, 1 bedroom and 2 bedrooms properties represent 57.8% of the active Airbnb listings in Cambridge, indicating a high concentration in these sizes.
- A significant 23.0% of listings offer 3+ bedrooms, catering to larger groups and families seeking more space in Cambridge.
Cambridge Vacation Rental Guest Capacity Trends (2025)
Distribution of Listings by Guest Capacity
Guest Capacity Insights for Cambridge
- The most common guest capacity trend in Cambridge vacation rentals is listings accommodating 2 guests (28%). This suggests the primary traveler segment is likely couples or solo travelers.
- Properties designed for 2 guests and 4 guests dominate the Cambridge STR market, accounting for 46.0% of listings.
- 21.7% of properties accommodate 6+ guests, serving the market segment for larger families or group travel in Cambridge.
- On average, properties in Cambridge are equipped to host 3.3 guests.
Cambridge Airbnb Booking Patterns (2025): Available vs. Booked Days
Available Days Distribution
Booked Days Distribution
Booking Pattern Insights for Cambridge
- The most common availability pattern in Cambridge falls within the 181-270 days range, representing 39.8% of listings. This suggests many properties have significant open periods on their calendars.
- Approximately 74.0% of listings show high availability (181+ days open annually), indicating potential for increased bookings or specific owner usage patterns.
- For booked days, the 91-180 days range is most frequent in Cambridge (41.6%), reflecting common guest stay durations or potential owner blocking patterns.
- A notable 26.7% of properties secure long booking periods (181+ days booked per year), highlighting successful long-term rental strategies or significant owner usage.
Cambridge Airbnb Minimum Stay Requirements Analysis
Distribution of Listings by Minimum Night Requirement
1 Night
56 listings
42.4% of total
2 Nights
28 listings
21.2% of total
3 Nights
15 listings
11.4% of total
4-6 Nights
7 listings
5.3% of total
7-29 Nights
17 listings
12.9% of total
30+ Nights
9 listings
6.8% of total
Key Insights
- The most prevalent minimum stay requirement in Cambridge is 1 Night, adopted by 42.4% of listings. This highlights the market's preference for shorter, flexible bookings.
- A strong majority (63.6%) of the Cambridge Airbnb data shows acceptance of very short stays (1-2 nights), indicating a dynamic, high-turnover market.
Recommendations
- Align with the market by considering a 1 Night minimum stay, as 42.4% of Cambridge hosts use this setting.
- Explore offering discounts for stays of 30+ nights to attract the 6.8% of the market seeking extended stays.
- Adjust minimum nights based on seasonality – potentially shorter during low season and longer during peak demand periods in Cambridge.
Cambridge Airbnb Cancellation Policy Trends Analysis (2025)
Flexible
36 listings
29.5% of total
Moderate
35 listings
28.7% of total
Firm
22 listings
18% of total
Strict
29 listings
23.8% of total
Cancellation Policy Insights for Cambridge
- The prevailing Airbnb cancellation policy trend in Cambridge is Flexible, used by 29.5% of listings.
- There's a relatively balanced mix between guest-friendly (58.2%) and stricter (41.8%) policies, offering choices for different guest needs.
Recommendations for Hosts
- Consider adopting a Flexible policy to align with the 29.5% market standard in Cambridge.
- Regularly review your cancellation policy against competitors and market demand shifts in Cambridge.
Cambridge STR Booking Lead Time Analysis (2025)
Average Booking Lead Time by Month
Booking Lead Time Insights for Cambridge
- The overall average booking lead time for vacation rentals in Cambridge is 33 days.
- Guests book furthest in advance for stays during October (average 48 days), likely coinciding with peak travel demand or local events.
- The shortest booking windows occur for stays in March (average 17 days), indicating more last-minute travel plans during this time.
- Seasonally, Fall (43 days avg.) sees the longest lead times, while Spring (30 days avg.) has the shortest, reflecting typical travel planning cycles.
Recommendations for Hosts
- Use the overall average lead time (33 days) as a baseline for your pricing and availability strategy in Cambridge.
- For October stays, consider implementing length-of-stay discounts or slightly higher rates for bookings made less than 48 days out to capitalize on advance planning.
- Target marketing efforts for the Fall season well in advance (at least 43 days) to capture early planners.
- Monitor your own booking lead times against these Cambridge averages to identify opportunities for dynamic pricing adjustments.
Popular & Essential Airbnb Amenities in Cambridge (2025)
Amenity Prevalence
Amenity Insights for Cambridge
- Essential amenities in Cambridge that guests expect include: Wifi, Smoke alarm, Air conditioning, Carbon monoxide alarm, Heating. Lacking these (any) could significantly impact bookings.
- Popular amenities like TV, Kitchen, Free parking on premises are common but not universal. Offering these can provide a competitive edge.
Recommendations for Hosts
- Ensure your listing includes all essential amenities for Cambridge: Wifi, Smoke alarm, Air conditioning, Carbon monoxide alarm, Heating.
- Prioritize adding missing essentials: Smoke alarm, Air conditioning, Carbon monoxide alarm, Heating.
- Consider adding popular differentiators like TV or Kitchen to increase appeal.
- Highlight unique or less common amenities you offer (e.g., hot tub, dedicated workspace, EV charger) in your listing description and photos.
- Regularly check competitor amenities in Cambridge to stay competitive.
Cambridge Airbnb Guest Demographics & Profile Analysis (2025)
Guest Profile Summary for Cambridge
- The typical guest profile for Airbnb in Cambridge consists of primarily domestic travelers (80%), often arriving from nearby Toronto, typically belonging to the Post-2000s (Gen Z/Alpha) group (50%), primarily speaking English or French.
- Domestic travelers account for 80.3% of guests.
- Key international markets include Canada (80.3%) and United States (12%).
- Top languages spoken are English (62.2%) followed by French (11.1%).
- A significant demographic segment is the Post-2000s (Gen Z/Alpha) group, representing 50% of guests.
Recommendations for Hosts
- Target domestic marketing efforts towards travelers from Toronto and Cambridge.
- Tailor amenities and listing descriptions to appeal to the dominant Post-2000s (Gen Z/Alpha) demographic (e.g., highlight fast WiFi, smart home features, local guides).
- Highlight unique local experiences or amenities relevant to the primary guest profile.
- Consider seasonal promotions aligned with peak travel times for key origin markets.
Nearby Short-Term Rental Market Comparison
How does the Cambridge Airbnb market stack up against its neighbors? Compare key performance metrics like average monthly revenue, ADR, and occupancy rates in surrounding areas to understand the broader regional STR landscape.
| Market | Active Properties | Monthly Revenue | Daily Rate | Avg. Occupancy |
|---|---|---|---|---|
| North East Township | 34 | $3,530 | $264.33 | 48% |
| Niagara-on-the-Lake | 413 | $3,358 | $265.20 | 44% |
| Town of Stockton | 16 | $3,172 | $232.49 | 46% |
| Town of Brant | 10 | $2,928 | $274.43 | 43% |
| Severn | 154 | $2,845 | $306.35 | 39% |
| Meaford | 129 | $2,843 | $246.44 | 45% |
| Town of French Creek | 46 | $2,842 | $286.58 | 33% |
| King | 29 | $2,840 | $269.07 | 33% |
| Mulmur | 43 | $2,837 | $283.33 | 42% |
| Gravenhurst | 220 | $2,834 | $308.96 | 41% |