Callander Airbnb Market Analysis 2025: Short Term Rental Data & Vacation Rental Statistics in Ontario, Canada
Is Airbnb profitable in Callander in 2025? Explore comprehensive Airbnb analytics for Callander, Ontario, Canada to uncover income potential. This 2025 STR market report for Callander, based on AirROI data from April 2024 to March 2025, reveals key trends in the niche market of 21 active listings.
Whether you're considering an Airbnb investment in Callander, optimizing your existing vacation rental, or exploring rental arbitrage opportunities, understanding the Callander Airbnb data is crucial. Leveraging the low regulation environment is key to maximizing your short term rental income potential. Let's dive into the specifics.
Key Callander Airbnb Performance Metrics Overview
Monthly Airbnb Revenue Variations & Income Potential in Callander (2025)
Understanding the monthly revenue variations for Airbnb listings in Callander is key to maximizing your short term rental income potential. Seasonality significantly impacts earnings. Our analysis, based on data from the past 12 months, shows that the peak revenue month for STRs in Callander is typically July, while March often presents the lowest earnings, highlighting opportunities for strategic pricing adjustments during shoulder and low seasons. Explore the typical Airbnb income in Callander across different performance tiers:
- Best-in-class properties (Top 10%) achieve $4,822+ monthly, often utilizing dynamic pricing and superior guest experiences.
- Strong performing properties (Top 25%) earn $3,729 or more, indicating effective management and desirable locations/amenities.
- Typical properties (Median) generate around $2,582 per month, representing the average market performance.
- Entry-level properties (Bottom 25%) see earnings around $1,484, often with potential for optimization.
Average Monthly Airbnb Earnings Trend in Callander
Callander Airbnb Occupancy Rate Trends (2025)
Maximize your bookings by understanding the Callander STR occupancy trends. Seasonal demand shifts significantly influence how often properties are booked. Typically, Julysees the highest demand (peak season occupancy), while March experiences the lowest (low season). Effective strategies, like adjusting minimum stays or offering promotions, can boost occupancy during slower periods. Here's how different property tiers perform in Callander:
- Best-in-class properties (Top 10%) achieve 80%+ occupancy, indicating high desirability and potentially optimized availability.
- Strong performing properties (Top 25%) maintain 67% or higher occupancy, suggesting good market fit and guest satisfaction.
- Typical properties (Median) have an occupancy rate around 44%.
- Entry-level properties (Bottom 25%) average 27% occupancy, potentially facing higher vacancy.
Average Monthly Occupancy Rate Trend in Callander
Average Daily Rate (ADR) Airbnb Trends in Callander (2025)
Effective short term rental pricing strategy in Callander involves understanding monthly ADR fluctuations. The Average Daily Rate (ADR) for Airbnb in Callander typically peaks in July and dips lowest during March. Leveraging Airbnb dynamic pricing tools or strategies based on this seasonality can significantly boost revenue. Here's a look at the typical nightly rates achieved:
- Best-in-class properties (Top 10%) command rates of $329+ per night, often due to premium features or locations.
- Strong performing properties (Top 25%) achieve nightly rates of $231 or more.
- Typical properties (Median) charge around $166 per night.
- Entry-level properties (Bottom 25%) earn around $131 per night.
Average Daily Rate (ADR) Trend by Month in Callander
Get Live Callander Market Intelligence 👇

Explore Real-time Analytics
Airbnb Seasonality Analysis & Trends in Callander (2025)
Peak Season (July, August, May)
- Revenue averages $3,745 per month
- Occupancy rates average 56.2%
- Daily rates average $202
Shoulder Season
- Revenue averages $2,833 per month
- Occupancy maintains around 45.4%
- Daily rates hold near $192
Low Season (March, October, November)
- Revenue drops to average $1,909 per month
- Occupancy decreases to average 40.1%
- Daily rates adjust to average $186
Seasonality Insights for Callander
- The Airbnb seasonality in Callander shows highly seasonal trends requiring careful strategy. While the sections above show seasonal averages, it's also insightful to look at the extremes:
- During the high season, the absolute peak month showcases Callander's highest earning potential, with monthly revenues capable of climbing to $4,133, occupancy reaching a high of 62.8%, and ADRs peaking at $204.
- Conversely, the slowest single month of the year, typically falling within the low season, marks the market's lowest point. In this month, revenue might dip to $1,506, occupancy could drop to 27.9%, and ADRs may adjust down to $182.
- Understanding both the seasonal averages and these monthly peaks and troughs in revenue, occupancy, and ADR is crucial for maximizing your Airbnb profit potential in Callander.
Seasonal Strategies for Maximizing Profit
- Peak Season: Maximize revenue through premium pricing and potentially longer minimum stays. Ensure high availability.
- Low Season: Offer competitive pricing, special promotions (e.g., extended stay discounts), and flexible cancellation policies. Target off-season travelers like remote workers or budget-conscious guests.
- Shoulder Seasons: Implement dynamic pricing that balances peak and low rates. Target weekend travelers or specific events. Offer slightly more flexible terms than peak season.
- Regularly analyze your own performance against these Callander seasonality benchmarks and adjust your pricing and availability strategy accordingly.
Best Areas for Airbnb Investment in Callander (2025)
Exploring the top neighborhoods for short-term rentals in Callander? This section highlights key areas, outlining why they are attractive for hosts and guests, along with notable local attractions. Consider these locations based on your target guest profile and investment strategy.
| Neighborhood / Area | Why Host Here? (Target Guests & Appeal) | Key Attractions & Landmarks |
|---|---|---|
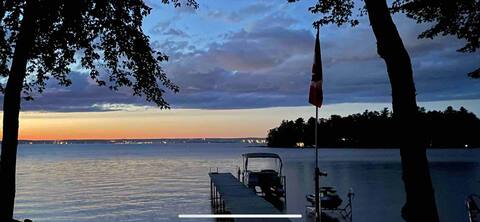
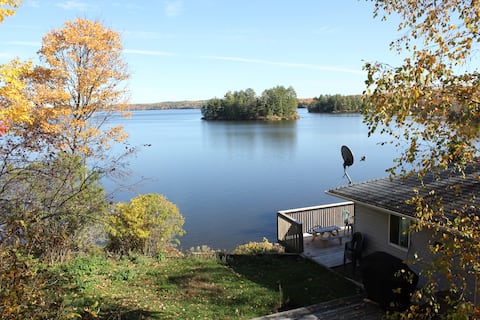
| Callander Bay | Scenic waterfront area ideal for travelers looking for lakeside activities, including swimming, fishing, and boating. A highly sought after location during summer months. | Callander Bay Park, Lake Nipissing, Beaches, Water Sports, Fishing, Hiking Trails |
| Main Street | The heart of Callander featuring charming shops, local cafes, and restaurants. Great for tourists wanting to experience local culture and cuisine. | Local Shops, Restaurants, Cafes, Callander Museum, Community Events |
| Parks and Recreation Area | A family-friendly area with parks, playgrounds, and recreational facilities attracting families and groups looking for outdoor activities. | Parks, Playgrounds, Sports Fields, Walking Trails, Nature Watching |
| Lakeshore Road | Offers breathtaking views and access to Lake Nipissing, perfect for those seeking relaxation and outdoor adventures. | Lakeshore Views, Canoeing, Kayaking, Nature Trails, Scenic Drives |
| Summit Beach | Popular destination in the summer for beachgoers, offering a fantastic beach experience that draws both locals and tourists. | Summit Beach, Swimming Areas, Picnic Areas, Beachside Activities |
| Nearby Nature Reserves | An excellent option for nature-lovers and those seeking tranquility. Ideal for ecotourism and outdoor adventures like hiking and bird watching. | Mattawa River Provincial Park, Nature Trails, Camping Spots, Wildlife Viewing |
| Winter Sports Area | Attracts winter sports enthusiasts with nearby skiing and snowboarding opportunities, making it a year-round destination. | Ski Resorts, Snowboarding, Winter Hiking, Ice Fishing, Local Winter Festivals |
| Local Vineyards and Farms | A unique cultural experience for tourists interested in local wine and food production, particularly in the fall harvest season. | Local Wineries, Farmers' Markets, Wine Tours, Agricultural Events |
Understanding Airbnb License Requirements & STR Laws in Callander (2025)
While Callander, Ontario, Canada currently shows low STR regulations, specific Airbnb license requirements might still exist or change. Always verify the latest short term rental regulations and Airbnb license requirements directly with local government authorities for Callander to ensure full compliance before hosting.
(Source: AirROI data, 2025, finding no licensed listings among those analyzed)
Top Performing Airbnb Properties in Callander (2025)
Benchmark your potential! Explore examples of top-performing Airbnb properties in Callanderbased on Trailing Twelve Month (TTM) revenue. Analyze their characteristics, revenue, occupancy rate, and ADR to understand what drives success in this market.
Bright 3 bedroom cottage with own beach
Entire Place • 3 bedrooms
Callander Bay Cottage Retreat
Entire Place • 4 bedrooms
Lake front Grandview cottage on Lake Nipissing
Entire Place • 3 bedrooms

Sandy Shores Lake House - Good Vibes&Amazing Space
Entire Place • 4 bedrooms
Lakeside Terrace on the Hill
Entire Place • 3 bedrooms
Lake View Retreat
Entire Place • 3 bedrooms
Note: Performance varies based on location, size, amenities, seasonality, and management quality. Data reflects the past 12 months.
Top Performing Airbnb Hosts in Callander (2025)
Learn from the best! This table showcases top-performing Airbnb hosts in Callander based on the number of properties managed and estimated total revenue over the past year. Analyze their scale and performance metrics.
| Host Name | Properties | Grossing Revenue | Stay Reviews | Avg Rating |
|---|---|---|---|---|
| Lindsay | 1 | $45,938 | 3 | 4.67/5.0 |
| Lisa | 1 | $42,678 | 133 | 4.95/5.0 |
| Michelle | 1 | $41,842 | 19 | 5.00/5.0 |
| M | 1 | $38,094 | 12 | 4.92/5.0 |
| Ginny | 1 | $35,537 | 69 | 4.97/5.0 |
| Lee Ann | 1 | $34,125 | 83 | 4.96/5.0 |
| Craig | 1 | $31,714 | 48 | 4.88/5.0 |
| Jay & April | 1 | $29,249 | 107 | 4.93/5.0 |
| C | 1 | $29,144 | 20 | 4.30/5.0 |
| Host #306710201 | 1 | $27,472 | 5 | 5.00/5.0 |
Analyzing the strategies of top hosts, such as their property selection, pricing, and guest communication, can offer valuable lessons for optimizing your own Airbnb operations in Callander.
Dive Deeper: Advanced Callander STR Market Data (2025)
Ready to unlock more insights? AirROI provides access to advanced metrics and comprehensive Airbnb data for Callander. Explore detailed analytics beyond this report to refine your investment strategy, optimize pricing, and maximize your vacation rental profits.
Explore Advanced MetricsCallander Short-Term Rental Market Composition (2025): Property & Room Types
Room Type Distribution
Property Type Distribution
Market Composition Insights for Callander
- The Callander Airbnb market composition is heavily skewed towards Entire Home/Apt listings, which make up 95.2% of the 21 active rentals. This indicates strong guest preference for privacy and space.
- Looking at the property type distribution in Callander, House properties are the most common (81%), reflecting the local real estate landscape.
- Houses represent a significant 81% portion, catering likely to families or larger groups.
Callander Airbnb Room Capacity Analysis (2025): Bedroom Distribution
Distribution of Listings by Number of Bedrooms
Room Capacity Insights for Callander
- The dominant room capacity in Callander is 3 bedrooms listings, making up 33.3% of the market. This suggests a strong demand for properties suitable for families or small groups.
- Together, 3 bedrooms and 2 bedrooms properties represent 57.1% of the active Airbnb listings in Callander, indicating a high concentration in these sizes.
- A significant 57.1% of listings offer 3+ bedrooms, catering to larger groups and families seeking more space in Callander.
Callander Vacation Rental Guest Capacity Trends (2025)
Distribution of Listings by Guest Capacity
Guest Capacity Insights for Callander
- The most common guest capacity trend in Callander vacation rentals is listings accommodating 4 guests (28.6%). This suggests the primary traveler segment is likely small families or groups.
- Properties designed for 4 guests and 8+ guests dominate the Callander STR market, accounting for 57.2% of listings.
- 57.2% of properties accommodate 6+ guests, serving the market segment for larger families or group travel in Callander.
- On average, properties in Callander are equipped to host 5.6 guests.
Callander Airbnb Booking Patterns (2025): Available vs. Booked Days
Available Days Distribution
Booked Days Distribution
Booking Pattern Insights for Callander
- The most common availability pattern in Callander falls within the 271-366 days range, representing 38.1% of listings. This suggests many properties have significant open periods on their calendars.
- Approximately 71.4% of listings show high availability (181+ days open annually), indicating potential for increased bookings or specific owner usage patterns.
- For booked days, the 91-180 days range is most frequent in Callander (28.6%), reflecting common guest stay durations or potential owner blocking patterns.
- A notable 33.3% of properties secure long booking periods (181+ days booked per year), highlighting successful long-term rental strategies or significant owner usage.
Callander Airbnb Minimum Stay Requirements Analysis
Distribution of Listings by Minimum Night Requirement
1 Night
2 listings
10.5% of total
2 Nights
7 listings
36.8% of total
3 Nights
5 listings
26.3% of total
4-6 Nights
1 listings
5.3% of total
30+ Nights
4 listings
21.1% of total
Key Insights
- The most prevalent minimum stay requirement in Callander is 2 Nights, adopted by 36.8% of listings. This highlights the market's preference for shorter, flexible bookings.
- A significant segment (21.1%) caters to monthly stays (30+ nights) in Callander, pointing to opportunities in the extended-stay market.
Recommendations
- Align with the market by considering a 2 Nights minimum stay, as 36.8% of Callander hosts use this setting.
- If feasible, allowing 1-night stays, especially midweek or during low season, could capture last-minute bookings, as only 10.5% currently do.
- A 2-night minimum appears standard (36.8%). Consider this for weekends or peak periods.
- Explore offering discounts for stays of 30+ nights to attract the 21.1% of the market seeking extended stays.
- Adjust minimum nights based on seasonality – potentially shorter during low season and longer during peak demand periods in Callander.
Callander Airbnb Cancellation Policy Trends Analysis (2025)
Flexible
3 listings
18.8% of total
Moderate
5 listings
31.3% of total
Firm
7 listings
43.8% of total
Strict
1 listings
6.3% of total
Cancellation Policy Insights for Callander
- The prevailing Airbnb cancellation policy trend in Callander is Firm, used by 43.8% of listings.
- A majority (50.1%) of hosts in Callander utilize Firm or Strict policies, indicating a market where hosts prioritize booking security.
- Strict cancellation policies are quite rare (6.3%), potentially making listings with this policy less competitive unless justified by high demand or property type.
Recommendations for Hosts
- Consider adopting a Firm policy to align with the 43.8% market standard in Callander.
- Using a Strict policy might deter some guests, as only 6.3% of listings use it. Evaluate if potential revenue protection outweighs possible lower booking rates.
- Regularly review your cancellation policy against competitors and market demand shifts in Callander.
Callander STR Booking Lead Time Analysis (2025)
Average Booking Lead Time by Month
Booking Lead Time Insights for Callander
- The overall average booking lead time for vacation rentals in Callander is 46 days.
- Guests book furthest in advance for stays during July (average 121 days), likely coinciding with peak travel demand or local events.
- The shortest booking windows occur for stays in November (average 22 days), indicating more last-minute travel plans during this time.
- Seasonally, Summer (89 days avg.) sees the longest lead times, while Fall (42 days avg.) has the shortest, reflecting typical travel planning cycles.
Recommendations for Hosts
- Use the overall average lead time (46 days) as a baseline for your pricing and availability strategy in Callander.
- For July stays, consider implementing length-of-stay discounts or slightly higher rates for bookings made less than 121 days out to capitalize on advance planning.
- Target marketing efforts for the Summer season well in advance (at least 89 days) to capture early planners.
- Monitor your own booking lead times against these Callander averages to identify opportunities for dynamic pricing adjustments.
Popular & Essential Airbnb Amenities in Callander (2025)
Amenity Prevalence
Amenity Insights for Callander
- Essential amenities in Callander that guests expect include: Smoke alarm, Heating, Free parking on premises, Hot water, Wifi, Carbon monoxide alarm. Lacking these (any) could significantly impact bookings.
- Popular amenities like Coffee maker, Fire extinguisher, Kitchen are common but not universal. Offering these can provide a competitive edge.
Recommendations for Hosts
- Ensure your listing includes all essential amenities for Callander: Smoke alarm, Heating, Free parking on premises, Hot water, Wifi, Carbon monoxide alarm.
- Prioritize adding missing essentials: Hot water, Wifi, Carbon monoxide alarm.
- Consider adding popular differentiators like Coffee maker or Fire extinguisher to increase appeal.
- Highlight unique or less common amenities you offer (e.g., hot tub, dedicated workspace, EV charger) in your listing description and photos.
- Regularly check competitor amenities in Callander to stay competitive.
Callander Airbnb Guest Demographics & Profile Analysis (2025)
Guest Profile Summary for Callander
- The typical guest profile for Airbnb in Callander consists of primarily domestic travelers (90%), often arriving from nearby Toronto, typically belonging to the Post-2000s (Gen Z/Alpha) group (50%), primarily speaking English or French.
- Domestic travelers account for 89.7% of guests.
- Key international markets include Canada (89.7%) and United States (6.2%).
- Top languages spoken are English (64.4%) followed by French (16.7%).
- A significant demographic segment is the Post-2000s (Gen Z/Alpha) group, representing 50% of guests.
Recommendations for Hosts
- Target domestic marketing efforts towards travelers from Toronto and Ottawa.
- Tailor amenities and listing descriptions to appeal to the dominant Post-2000s (Gen Z/Alpha) demographic (e.g., highlight fast WiFi, smart home features, local guides).
- Highlight unique local experiences or amenities relevant to the primary guest profile.
- Consider seasonal promotions aligned with peak travel times for key origin markets.
Nearby Short-Term Rental Market Comparison
How does the Callander Airbnb market stack up against its neighbors? Compare key performance metrics like average monthly revenue, ADR, and occupancy rates in surrounding areas to understand the broader regional STR landscape.
| Market | Active Properties | Monthly Revenue | Daily Rate | Avg. Occupancy |
|---|---|---|---|---|
| McMurrich/Monteith Township | 26 | $3,922 | $372.53 | 42% |
| South River | 10 | $3,752 | $259.89 | 45% |
| Muskoka Lakes Township | 376 | $3,060 | $435.47 | 38% |
| Dysart et al | 264 | $3,046 | $310.03 | 42% |
| McKellar Township | 39 | $2,980 | $368.05 | 40% |
| Huntsville | 305 | $2,978 | $273.77 | 43% |
| Kearney | 59 | $2,897 | $263.86 | 44% |
| Bracebridge | 207 | $2,862 | $321.96 | 40% |
| Perry Township | 61 | $2,845 | $282.82 | 43% |
| Lake of Bays Township | 195 | $2,761 | $313.89 | 38% |