Brudenell, Lyndoch and Raglan Airbnb Market Analysis 2025: Short Term Rental Data & Vacation Rental Statistics in Ontario, Canada
Is Airbnb profitable in Brudenell, Lyndoch and Raglan in 2025? Explore comprehensive Airbnb analytics for Brudenell, Lyndoch and Raglan, Ontario, Canada to uncover income potential. This 2025 STR market report for Brudenell, Lyndoch and Raglan, based on AirROI data from April 2024 to March 2025, reveals key trends in the niche market of 18 active listings.
Whether you're considering an Airbnb investment in Brudenell, Lyndoch and Raglan, optimizing your existing vacation rental, or exploring rental arbitrage opportunities, understanding the Brudenell, Lyndoch and Raglan Airbnb data is crucial. Leveraging the low regulation environment is key to maximizing your short term rental income potential. Let's dive into the specifics.
Key Brudenell, Lyndoch and Raglan Airbnb Performance Metrics Overview
Monthly Airbnb Revenue Variations & Income Potential in Brudenell, Lyndoch and Raglan (2025)
Understanding the monthly revenue variations for Airbnb listings in Brudenell, Lyndoch and Raglan is key to maximizing your short term rental income potential. Seasonality significantly impacts earnings. Our analysis, based on data from the past 12 months, shows that the peak revenue month for STRs in Brudenell, Lyndoch and Raglan is typically July, while April often presents the lowest earnings, highlighting opportunities for strategic pricing adjustments during shoulder and low seasons. Explore the typical Airbnb income in Brudenell, Lyndoch and Raglan across different performance tiers:
- Best-in-class properties (Top 10%) achieve $4,096+ monthly, often utilizing dynamic pricing and superior guest experiences.
- Strong performing properties (Top 25%) earn $2,504 or more, indicating effective management and desirable locations/amenities.
- Typical properties (Median) generate around $1,422 per month, representing the average market performance.
- Entry-level properties (Bottom 25%) see earnings around $626, often with potential for optimization.
Average Monthly Airbnb Earnings Trend in Brudenell, Lyndoch and Raglan
Brudenell, Lyndoch and Raglan Airbnb Occupancy Rate Trends (2025)
Maximize your bookings by understanding the Brudenell, Lyndoch and Raglan STR occupancy trends. Seasonal demand shifts significantly influence how often properties are booked. Typically, Februarysees the highest demand (peak season occupancy), while April experiences the lowest (low season). Effective strategies, like adjusting minimum stays or offering promotions, can boost occupancy during slower periods. Here's how different property tiers perform in Brudenell, Lyndoch and Raglan:
- Best-in-class properties (Top 10%) achieve 74%+ occupancy, indicating high desirability and potentially optimized availability.
- Strong performing properties (Top 25%) maintain 69% or higher occupancy, suggesting good market fit and guest satisfaction.
- Typical properties (Median) have an occupancy rate around 41%.
- Entry-level properties (Bottom 25%) average 18% occupancy, potentially facing higher vacancy.
Average Monthly Occupancy Rate Trend in Brudenell, Lyndoch and Raglan
Average Daily Rate (ADR) Airbnb Trends in Brudenell, Lyndoch and Raglan (2025)
Effective short term rental pricing strategy in Brudenell, Lyndoch and Raglan involves understanding monthly ADR fluctuations. The Average Daily Rate (ADR) for Airbnb in Brudenell, Lyndoch and Raglan typically peaks in January and dips lowest during May. Leveraging Airbnb dynamic pricing tools or strategies based on this seasonality can significantly boost revenue. Here's a look at the typical nightly rates achieved:
- Best-in-class properties (Top 10%) command rates of $204+ per night, often due to premium features or locations.
- Strong performing properties (Top 25%) achieve nightly rates of $145 or more.
- Typical properties (Median) charge around $102 per night.
- Entry-level properties (Bottom 25%) earn around $64 per night.
Average Daily Rate (ADR) Trend by Month in Brudenell, Lyndoch and Raglan
Get Live Brudenell, Lyndoch and Raglan Market Intelligence 👇

Explore Real-time Analytics
Airbnb Seasonality Analysis & Trends in Brudenell, Lyndoch and Raglan (2025)
Peak Season (July, August, September)
- Revenue averages $2,656 per month
- Occupancy rates average 49.8%
- Daily rates average $118
Shoulder Season
- Revenue averages $1,705 per month
- Occupancy maintains around 43.8%
- Daily rates hold near $123
Low Season (January, April, December)
- Revenue drops to average $1,279 per month
- Occupancy decreases to average 37.5%
- Daily rates adjust to average $126
Seasonality Insights for Brudenell, Lyndoch and Raglan
- The Airbnb seasonality in Brudenell, Lyndoch and Raglan shows highly seasonal trends requiring careful strategy. While the sections above show seasonal averages, it's also insightful to look at the extremes:
- During the high season, the absolute peak month showcases Brudenell, Lyndoch and Raglan's highest earning potential, with monthly revenues capable of climbing to $2,878, occupancy reaching a high of 54.8%, and ADRs peaking at $131.
- Conversely, the slowest single month of the year, typically falling within the low season, marks the market's lowest point. In this month, revenue might dip to $1,150, occupancy could drop to 24.8%, and ADRs may adjust down to $115.
- Understanding both the seasonal averages and these monthly peaks and troughs in revenue, occupancy, and ADR is crucial for maximizing your Airbnb profit potential in Brudenell, Lyndoch and Raglan.
Seasonal Strategies for Maximizing Profit
- Peak Season: Maximize revenue through premium pricing and potentially longer minimum stays. Ensure high availability.
- Low Season: Offer competitive pricing, special promotions (e.g., extended stay discounts), and flexible cancellation policies. Target off-season travelers like remote workers or budget-conscious guests.
- Shoulder Seasons: Implement dynamic pricing that balances peak and low rates. Target weekend travelers or specific events. Offer slightly more flexible terms than peak season.
- Regularly analyze your own performance against these Brudenell, Lyndoch and Raglan seasonality benchmarks and adjust your pricing and availability strategy accordingly.
Best Areas for Airbnb Investment in Brudenell, Lyndoch and Raglan (2025)
Exploring the top neighborhoods for short-term rentals in Brudenell, Lyndoch and Raglan? This section highlights key areas, outlining why they are attractive for hosts and guests, along with notable local attractions. Consider these locations based on your target guest profile and investment strategy.
| Neighborhood / Area | Why Host Here? (Target Guests & Appeal) | Key Attractions & Landmarks |
|---|---|---|
| Brudenell | A beautiful rural area known for its scenic landscapes and recreational activities. Ideal for those looking to escape the city and enjoy nature, with plenty of options for outdoor adventures. | Brudenell River Provincial Park, local hiking trails, kayaking and canoeing activities, scenic picnic spots |
| Lyndoch | A quaint and quiet community perfect for relaxation and enjoying the serene Ontario countryside. Attracts visitors looking for a peaceful getaway and the charm of small-town life. | local farms, farmers' markets, nature trails, community events, cozy inns |
| Raglan | A charming village with a rich history and close-knit community atmosphere. Appeals to visitors wanting to experience authentic rural Ontario living and cultural heritage. | Raglan Community Centre, local art galleries, historical landmarks, quaint cafes, outdoor recreational activities |
| Smiths Falls | A vibrant town with historical significance and plenty of local amenities. Ideal for visitors looking to explore the Rideau Canal and surrounding natural beauty. | Rideau Canal, Smiths Falls Heritage House, local artisans and crafts, parks for families |
| Perth | A picturesque town known for its well-preserved heritage and vibrant arts scene. Perfect for travelers interested in history and culture combined with natural beauty. | Perth Museum, Stewart Park, local festivals, art galleries, historical tours |
| Maberly | A small, serene community that offers a cozy retreat in the countryside. Great for nature lovers looking to enjoy the outdoors and local wildlife. | Maberly Beach, local hiking spots, scenic viewpoints, fishing areas |
| Westport | A charming waterfront village with a lively arts and music scene. Ideal for visitors interested in boating, swimming, and exploring local shops and cafes. | Westport Marina, local boutiques, art galleries, summer music festivals |
| Rideau Lakes | A beautiful area composed of many lakes surrounded by nature, great for water sports and outdoor activities. Attracts visitors looking for adventure and relaxation in nature. | Rideau Lakes trails, boating and fishing spots, campgrounds, nature parks |
Understanding Airbnb License Requirements & STR Laws in Brudenell, Lyndoch and Raglan (2025)
While Brudenell, Lyndoch and Raglan, Ontario, Canada currently shows low STR regulations, specific Airbnb license requirements might still exist or change. Always verify the latest short term rental regulations and Airbnb license requirements directly with local government authorities for Brudenell, Lyndoch and Raglan to ensure full compliance before hosting.
(Source: AirROI data, 2025, finding no licensed listings among those analyzed)
Top Performing Airbnb Properties in Brudenell, Lyndoch and Raglan (2025)
Benchmark your potential! Explore examples of top-performing Airbnb properties in Brudenell, Lyndoch and Raglanbased on Trailing Twelve Month (TTM) revenue. Analyze their characteristics, revenue, occupancy rate, and ADR to understand what drives success in this market.
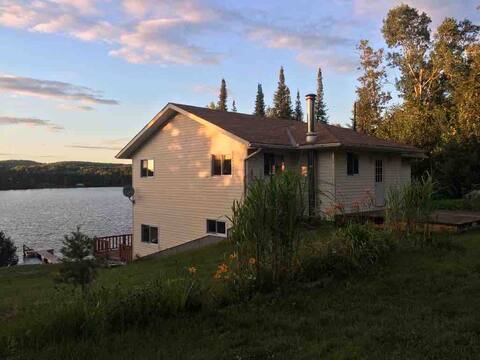
Beautiful lake front property in very private area
Entire Place • 5 bedrooms
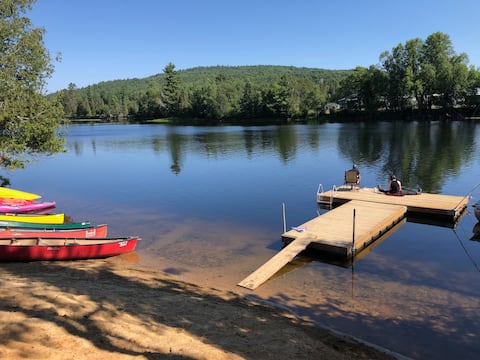
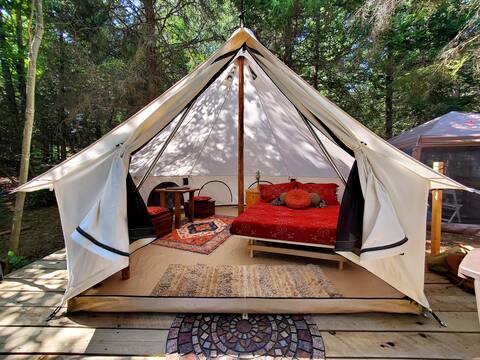
The Outside Inn - Mad River Beach Glamping Retreat
Entire Place • 5 bedrooms
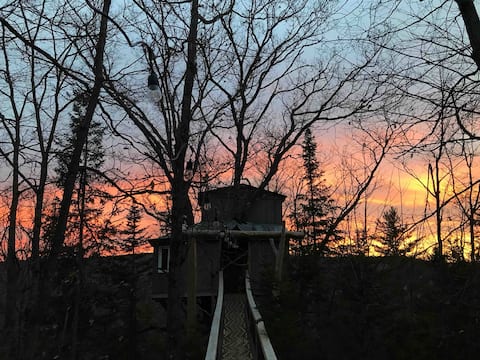
A Birds Eye View Tree House
Entire Place • 1 bedroom
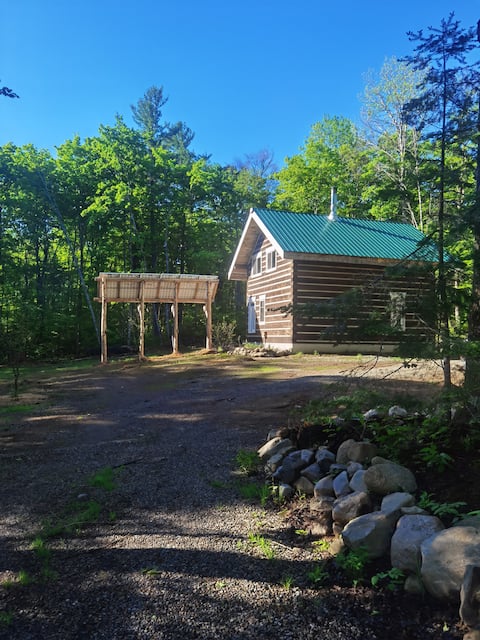
Perfect Private getaway log cabin in the woods
Entire Place • 2 bedrooms
200 Acre Romantic Glamping on Tiny Spring Fed Lake
Entire Place • 1 bedroom

Cottage Country Lakefront Suite (Kayak & Starlink)
Entire Place • 1 bedroom
Note: Performance varies based on location, size, amenities, seasonality, and management quality. Data reflects the past 12 months.
Top Performing Airbnb Hosts in Brudenell, Lyndoch and Raglan (2025)
Learn from the best! This table showcases top-performing Airbnb hosts in Brudenell, Lyndoch and Raglan based on the number of properties managed and estimated total revenue over the past year. Analyze their scale and performance metrics.
| Host Name | Properties | Grossing Revenue | Stay Reviews | Avg Rating |
|---|---|---|---|---|
| Matt | 1 | $34,694 | 24 | 4.96/5.0 |
| Scott | 1 | $32,800 | 3 | 5.00/5.0 |
| Brenda | 1 | $29,723 | 114 | 4.97/5.0 |
| Raene And Alex | 1 | $29,460 | 65 | 5.00/5.0 |
| Kristina | 1 | $19,361 | 22 | 5.00/5.0 |
| Kim | 1 | $18,763 | 57 | 4.98/5.0 |
| Hugh | 2 | $13,367 | 38 | 4.96/5.0 |
| August-Edward | 1 | $11,933 | 213 | 4.86/5.0 |
| Gabriela | 1 | $8,778 | 8 | 4.88/5.0 |
| Host #63650476 | 1 | $7,373 | 19 | 4.89/5.0 |
Analyzing the strategies of top hosts, such as their property selection, pricing, and guest communication, can offer valuable lessons for optimizing your own Airbnb operations in Brudenell, Lyndoch and Raglan.
Dive Deeper: Advanced Brudenell, Lyndoch and Raglan STR Market Data (2025)
Ready to unlock more insights? AirROI provides access to advanced metrics and comprehensive Airbnb data for Brudenell, Lyndoch and Raglan. Explore detailed analytics beyond this report to refine your investment strategy, optimize pricing, and maximize your vacation rental profits.
Explore Advanced MetricsBrudenell, Lyndoch and Raglan Short-Term Rental Market Composition (2025): Property & Room Types
Room Type Distribution
Property Type Distribution
Market Composition Insights for Brudenell, Lyndoch and Raglan
- The Brudenell, Lyndoch and Raglan Airbnb market composition is heavily skewed towards Entire Home/Apt listings, which make up 88.9% of the 18 active rentals. This indicates strong guest preference for privacy and space.
- Looking at the property type distribution in Brudenell, Lyndoch and Raglan, Outdoor/Unique properties are the most common (55.6%), reflecting the local real estate landscape.
- Houses represent a significant 27.8% portion, catering likely to families or larger groups.
- The presence of 5.6% Hotel/Boutique listings indicates integration with traditional hospitality.
Brudenell, Lyndoch and Raglan Airbnb Room Capacity Analysis (2025): Bedroom Distribution
Distribution of Listings by Number of Bedrooms
Room Capacity Insights for Brudenell, Lyndoch and Raglan
- The dominant room capacity in Brudenell, Lyndoch and Raglan is 1 bedroom listings, making up 33.3% of the market. This suggests a strong demand for properties suitable for couples or solo travelers.
- Together, 1 bedroom and 3 bedrooms properties represent 55.5% of the active Airbnb listings in Brudenell, Lyndoch and Raglan, indicating a high concentration in these sizes.
- A significant 38.9% of listings offer 3+ bedrooms, catering to larger groups and families seeking more space in Brudenell, Lyndoch and Raglan.
Brudenell, Lyndoch and Raglan Vacation Rental Guest Capacity Trends (2025)
Distribution of Listings by Guest Capacity
Guest Capacity Insights for Brudenell, Lyndoch and Raglan
- The most common guest capacity trend in Brudenell, Lyndoch and Raglan vacation rentals is listings accommodating 2 guests (27.8%). This suggests the primary traveler segment is likely couples or solo travelers.
- Properties designed for 2 guests and 8+ guests dominate the Brudenell, Lyndoch and Raglan STR market, accounting for 55.6% of listings.
- 50.1% of properties accommodate 6+ guests, serving the market segment for larger families or group travel in Brudenell, Lyndoch and Raglan.
- On average, properties in Brudenell, Lyndoch and Raglan are equipped to host 4.8 guests.
Brudenell, Lyndoch and Raglan Airbnb Booking Patterns (2025): Available vs. Booked Days
Available Days Distribution
Booked Days Distribution
Booking Pattern Insights for Brudenell, Lyndoch and Raglan
- The most common availability pattern in Brudenell, Lyndoch and Raglan falls within the 271-366 days range, representing 55.6% of listings. This suggests many properties have significant open periods on their calendars.
- Approximately 88.9% of listings show high availability (181+ days open annually), indicating potential for increased bookings or specific owner usage patterns.
- For booked days, the 91-180 days range is most frequent in Brudenell, Lyndoch and Raglan (33.3%), reflecting common guest stay durations or potential owner blocking patterns.
- A notable 11.2% of properties secure long booking periods (181+ days booked per year), highlighting successful long-term rental strategies or significant owner usage.
Brudenell, Lyndoch and Raglan Airbnb Minimum Stay Requirements Analysis
Distribution of Listings by Minimum Night Requirement
1 Night
4 listings
25% of total
2 Nights
7 listings
43.8% of total
4-6 Nights
1 listings
6.3% of total
7-29 Nights
1 listings
6.3% of total
30+ Nights
3 listings
18.8% of total
Key Insights
- The most prevalent minimum stay requirement in Brudenell, Lyndoch and Raglan is 2 Nights, adopted by 43.8% of listings. This highlights the market's preference for shorter, flexible bookings.
- A strong majority (68.8%) of the Brudenell, Lyndoch and Raglan Airbnb data shows acceptance of very short stays (1-2 nights), indicating a dynamic, high-turnover market.
- A significant segment (18.8%) caters to monthly stays (30+ nights) in Brudenell, Lyndoch and Raglan, pointing to opportunities in the extended-stay market.
Recommendations
- Align with the market by considering a 2 Nights minimum stay, as 43.8% of Brudenell, Lyndoch and Raglan hosts use this setting.
- If feasible, allowing 1-night stays, especially midweek or during low season, could capture last-minute bookings, as only 25% currently do.
- Explore offering discounts for stays of 30+ nights to attract the 18.8% of the market seeking extended stays.
- Adjust minimum nights based on seasonality – potentially shorter during low season and longer during peak demand periods in Brudenell, Lyndoch and Raglan.
Brudenell, Lyndoch and Raglan Airbnb Cancellation Policy Trends Analysis (2025)
Flexible
3 listings
17.6% of total
Moderate
6 listings
35.3% of total
Firm
6 listings
35.3% of total
Strict
2 listings
11.8% of total
Cancellation Policy Insights for Brudenell, Lyndoch and Raglan
- The prevailing Airbnb cancellation policy trend in Brudenell, Lyndoch and Raglan is Moderate, used by 35.3% of listings.
- There's a relatively balanced mix between guest-friendly (52.9%) and stricter (47.1%) policies, offering choices for different guest needs.
Recommendations for Hosts
- Consider adopting a Moderate policy to align with the 35.3% market standard in Brudenell, Lyndoch and Raglan.
- Using a Strict policy might deter some guests, as only 11.8% of listings use it. Evaluate if potential revenue protection outweighs possible lower booking rates.
- Regularly review your cancellation policy against competitors and market demand shifts in Brudenell, Lyndoch and Raglan.
Brudenell, Lyndoch and Raglan STR Booking Lead Time Analysis (2025)
Average Booking Lead Time by Month
Booking Lead Time Insights for Brudenell, Lyndoch and Raglan
- The overall average booking lead time for vacation rentals in Brudenell, Lyndoch and Raglan is 52 days.
- Guests book furthest in advance for stays during November (average 103 days), likely coinciding with peak travel demand or local events.
- The shortest booking windows occur for stays in March (average 18 days), indicating more last-minute travel plans during this time.
- Seasonally, Fall (66 days avg.) sees the longest lead times, while Winter (26 days avg.) has the shortest, reflecting typical travel planning cycles.
Recommendations for Hosts
- Use the overall average lead time (52 days) as a baseline for your pricing and availability strategy in Brudenell, Lyndoch and Raglan.
- For November stays, consider implementing length-of-stay discounts or slightly higher rates for bookings made less than 103 days out to capitalize on advance planning.
- Target marketing efforts for the Fall season well in advance (at least 66 days) to capture early planners.
- Monitor your own booking lead times against these Brudenell, Lyndoch and Raglan averages to identify opportunities for dynamic pricing adjustments.
Popular & Essential Airbnb Amenities in Brudenell, Lyndoch and Raglan (2025)
Amenity Prevalence
Amenity Insights for Brudenell, Lyndoch and Raglan
- Essential amenities in Brudenell, Lyndoch and Raglan that guests expect include: Cooking basics, Dishes and silverware, Free parking on premises. Lacking these (any) could significantly impact bookings.
- Popular amenities like BBQ grill, Coffee maker, Private entrance are common but not universal. Offering these can provide a competitive edge.
Recommendations for Hosts
- Ensure your listing includes all essential amenities for Brudenell, Lyndoch and Raglan: Cooking basics, Dishes and silverware, Free parking on premises.
- Consider adding popular differentiators like BBQ grill or Coffee maker to increase appeal.
- Highlight unique or less common amenities you offer (e.g., hot tub, dedicated workspace, EV charger) in your listing description and photos.
- Regularly check competitor amenities in Brudenell, Lyndoch and Raglan to stay competitive.
Brudenell, Lyndoch and Raglan Airbnb Guest Demographics & Profile Analysis (2025)
Guest Profile Summary for Brudenell, Lyndoch and Raglan
- The typical guest profile for Airbnb in Brudenell, Lyndoch and Raglan consists of primarily domestic travelers (84%), often arriving from nearby Toronto, typically belonging to the Post-2000s (Gen Z/Alpha) group (50%), primarily speaking English or French.
- Domestic travelers account for 84.1% of guests.
- Key international markets include Canada (84.1%) and France (3.8%).
- Top languages spoken are English (56.3%) followed by French (12.6%).
- A significant demographic segment is the Post-2000s (Gen Z/Alpha) group, representing 50% of guests.
Recommendations for Hosts
- Target domestic marketing efforts towards travelers from Toronto and Ottawa.
- Tailor amenities and listing descriptions to appeal to the dominant Post-2000s (Gen Z/Alpha) demographic (e.g., highlight fast WiFi, smart home features, local guides).
- Highlight unique local experiences or amenities relevant to the primary guest profile.
- Consider seasonal promotions aligned with peak travel times for key origin markets.
Nearby Short-Term Rental Market Comparison
How does the Brudenell, Lyndoch and Raglan Airbnb market stack up against its neighbors? Compare key performance metrics like average monthly revenue, ADR, and occupancy rates in surrounding areas to understand the broader regional STR landscape.
| Market | Active Properties | Monthly Revenue | Daily Rate | Avg. Occupancy |
|---|---|---|---|---|
| Carrying Place | 20 | $3,737 | $315.96 | 48% |
| Rossmore | 10 | $3,345 | $268.20 | 56% |
| Town of Lyme | 29 | $3,140 | $268.25 | 46% |
| Dysart et al | 264 | $3,046 | $310.03 | 42% |
| Trent Lakes | 197 | $2,968 | $331.60 | 38% |
| Stirling-Rawdon | 13 | $2,872 | $222.78 | 44% |
| Westport | 14 | $2,743 | $301.70 | 33% |
| Beckwith | 13 | $2,740 | $258.12 | 38% |
| Selwyn | 150 | $2,654 | $332.40 | 38% |
| Prince Edward County | 12 | $2,587 | $281.43 | 45% |