Brighton Airbnb Market Analysis 2025: Short Term Rental Data & Vacation Rental Statistics in Ontario, Canada
Is Airbnb profitable in Brighton in 2025? Explore comprehensive Airbnb analytics for Brighton, Ontario, Canada to uncover income potential. This 2025 STR market report for Brighton, based on AirROI data from April 2024 to March 2025, reveals key trends in the niche market of 44 active listings.
Whether you're considering an Airbnb investment in Brighton, optimizing your existing vacation rental, or exploring rental arbitrage opportunities, understanding the Brighton Airbnb data is crucial. Leveraging the low regulation environment is key to maximizing your short term rental income potential. Let's dive into the specifics.
Key Brighton Airbnb Performance Metrics Overview
Monthly Airbnb Revenue Variations & Income Potential in Brighton (2025)
Understanding the monthly revenue variations for Airbnb listings in Brighton is key to maximizing your short term rental income potential. Seasonality significantly impacts earnings. Our analysis, based on data from the past 12 months, shows that the peak revenue month for STRs in Brighton is typically July, while February often presents the lowest earnings, highlighting opportunities for strategic pricing adjustments during shoulder and low seasons. Explore the typical Airbnb income in Brighton across different performance tiers:
- Best-in-class properties (Top 10%) achieve $5,962+ monthly, often utilizing dynamic pricing and superior guest experiences.
- Strong performing properties (Top 25%) earn $3,363 or more, indicating effective management and desirable locations/amenities.
- Typical properties (Median) generate around $1,901 per month, representing the average market performance.
- Entry-level properties (Bottom 25%) see earnings around $878, often with potential for optimization.
Average Monthly Airbnb Earnings Trend in Brighton
Brighton Airbnb Occupancy Rate Trends (2025)
Maximize your bookings by understanding the Brighton STR occupancy trends. Seasonal demand shifts significantly influence how often properties are booked. Typically, Augustsees the highest demand (peak season occupancy), while January experiences the lowest (low season). Effective strategies, like adjusting minimum stays or offering promotions, can boost occupancy during slower periods. Here's how different property tiers perform in Brighton:
- Best-in-class properties (Top 10%) achieve 70%+ occupancy, indicating high desirability and potentially optimized availability.
- Strong performing properties (Top 25%) maintain 48% or higher occupancy, suggesting good market fit and guest satisfaction.
- Typical properties (Median) have an occupancy rate around 29%.
- Entry-level properties (Bottom 25%) average 17% occupancy, potentially facing higher vacancy.
Average Monthly Occupancy Rate Trend in Brighton
Average Daily Rate (ADR) Airbnb Trends in Brighton (2025)
Effective short term rental pricing strategy in Brighton involves understanding monthly ADR fluctuations. The Average Daily Rate (ADR) for Airbnb in Brighton typically peaks in July and dips lowest during February. Leveraging Airbnb dynamic pricing tools or strategies based on this seasonality can significantly boost revenue. Here's a look at the typical nightly rates achieved:
- Best-in-class properties (Top 10%) command rates of $449+ per night, often due to premium features or locations.
- Strong performing properties (Top 25%) achieve nightly rates of $295 or more.
- Typical properties (Median) charge around $174 per night.
- Entry-level properties (Bottom 25%) earn around $108 per night.
Average Daily Rate (ADR) Trend by Month in Brighton
Get Live Brighton Market Intelligence 👇

Explore Real-time Analytics
Airbnb Seasonality Analysis & Trends in Brighton (2025)
Peak Season (July, August, June)
- Revenue averages $5,148 per month
- Occupancy rates average 51.3%
- Daily rates average $261
Shoulder Season
- Revenue averages $2,205 per month
- Occupancy maintains around 32.4%
- Daily rates hold near $246
Low Season (January, February, March)
- Revenue drops to average $1,204 per month
- Occupancy decreases to average 23.6%
- Daily rates adjust to average $233
Seasonality Insights for Brighton
- The Airbnb seasonality in Brighton shows highly seasonal trends requiring careful strategy. While the sections above show seasonal averages, it's also insightful to look at the extremes:
- During the high season, the absolute peak month showcases Brighton's highest earning potential, with monthly revenues capable of climbing to $6,136, occupancy reaching a high of 63.8%, and ADRs peaking at $264.
- Conversely, the slowest single month of the year, typically falling within the low season, marks the market's lowest point. In this month, revenue might dip to $1,111, occupancy could drop to 18.9%, and ADRs may adjust down to $228.
- Understanding both the seasonal averages and these monthly peaks and troughs in revenue, occupancy, and ADR is crucial for maximizing your Airbnb profit potential in Brighton.
Seasonal Strategies for Maximizing Profit
- Peak Season: Maximize revenue through premium pricing and potentially longer minimum stays. Ensure high availability.
- Low Season: Offer competitive pricing, special promotions (e.g., extended stay discounts), and flexible cancellation policies. Target off-season travelers like remote workers or budget-conscious guests.
- Shoulder Seasons: Implement dynamic pricing that balances peak and low rates. Target weekend travelers or specific events. Offer slightly more flexible terms than peak season.
- Regularly analyze your own performance against these Brighton seasonality benchmarks and adjust your pricing and availability strategy accordingly.
Best Areas for Airbnb Investment in Brighton (2025)
Exploring the top neighborhoods for short-term rentals in Brighton? This section highlights key areas, outlining why they are attractive for hosts and guests, along with notable local attractions. Consider these locations based on your target guest profile and investment strategy.
| Neighborhood / Area | Why Host Here? (Target Guests & Appeal) | Key Attractions & Landmarks |
|---|---|---|
| Brighton Bay | Scenic waterfront area known for its beautiful views and recreational activities. Ideal for travelers looking to relax by the water and enjoy outdoor adventures. | Brighton Marina, Presqu'ile Provincial Park, Brighton Bay Golf Course, Fishing and boating activities, Numerous beaches |
| Downtown Brighton | The heart of the town, offering a mix of shops, restaurants, and cultural experiences. A popular choice for visitors wanting to explore the local scene. | Brighton Arts Centre, Local boutiques, Restaurants and cafes, Annual festivals, Community events |
| Northumberland County | Surrounding area providing a quaint countryside experience with access to nature and outdoor fun. Perfect for guests looking to escape to rural Ontario. | Northumberland Forest, Trenton Greenbelt Trail, Historic sites, Local wineries, Agricultural fairs |
| Presqu'ile Provincial Park | A natural gem with stunning landscapes and rich wildlife. Great for those interested in hiking, bird watching, and camping. | Presqu'ile Beach, Bird observatory, Walking trails, Camping facilities, Nature interpretation programs |
| Brighton Golf Club | A scenic area featuring a popular golf club, making it attractive to golf enthusiasts looking for recreational options during their stay. | Golf courses, Clubhouse dining, Tournaments, Scenic views, Golf lessons |
| Trenton | Nearby city with a rich military history and vibrant arts scene, which can attract a diverse group of visitors. | Canadian Forces Base Trenton, Trenton Memorial Hospital, Carrie Adams Park, Local museums, Art galleries |
| Sandbanks Provincial Park | Known for its stunning sandy beaches and unique landscapes, this area draws significant tourist traffic, especially in summer. | Sandbanks Beach, Wellington, Wine country, Cycling trails, Scenic views |
| Prince Edward County | A popular destination for its wineries, art galleries, and culinary experiences, making it a great weekend getaway spot. | Numerous wineries, Local farm-to-table restaurants, Lighthouses, Art studios, Festivals and events |
Understanding Airbnb License Requirements & STR Laws in Brighton (2025)
While Brighton, Ontario, Canada currently shows low STR regulations, specific Airbnb license requirements might still exist or change. Always verify the latest short term rental regulations and Airbnb license requirements directly with local government authorities for Brighton to ensure full compliance before hosting.
(Source: AirROI data, 2025, finding no licensed listings among those analyzed)
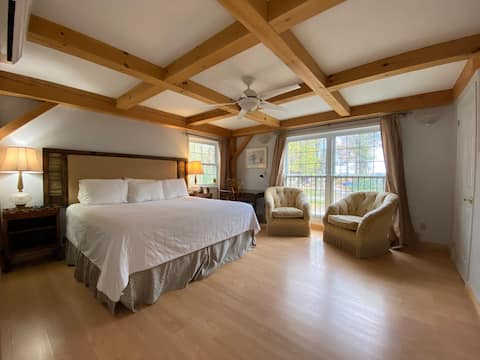
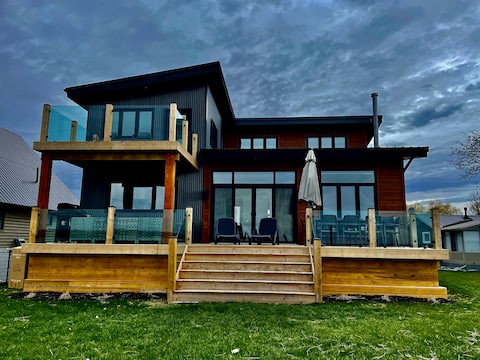
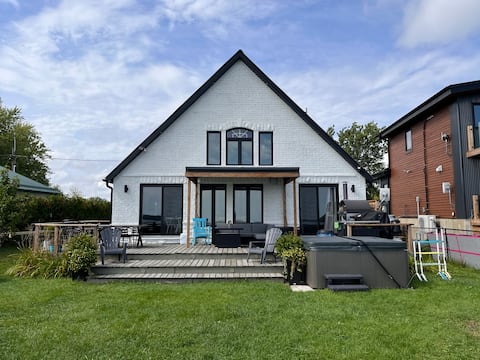
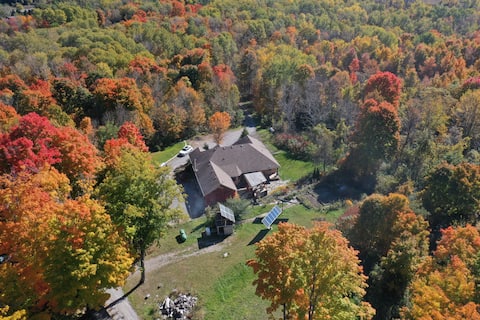
Top Performing Airbnb Properties in Brighton (2025)
Benchmark your potential! Explore examples of top-performing Airbnb properties in Brightonbased on Trailing Twelve Month (TTM) revenue. Analyze their characteristics, revenue, occupancy rate, and ADR to understand what drives success in this market.
Take over of Timber House Resort
Private Room • 10 bedrooms
Luxury Waterfront Lakehouse near PEC w/ EV Charger
Entire Place • 4 bedrooms
Zen Lakehouse with Panoramic Water Views.
Entire Place • 4 bedrooms

Presqu'ile BeachHouse Cottage.
Entire Place • 3 bedrooms
Nature's Haven: Blissful Escape
Entire Place • 6 bedrooms

Multi-Family cottage w/ Pool near Presqu'ile & PEC
Entire Place • 5 bedrooms
Note: Performance varies based on location, size, amenities, seasonality, and management quality. Data reflects the past 12 months.
Top Performing Airbnb Hosts in Brighton (2025)
Learn from the best! This table showcases top-performing Airbnb hosts in Brighton based on the number of properties managed and estimated total revenue over the past year. Analyze their scale and performance metrics.
| Host Name | Properties | Grossing Revenue | Stay Reviews | Avg Rating |
|---|---|---|---|---|
| Timber House | 5 | $158,455 | 187 | 3.64/5.0 |
| Jason | 7 | $115,384 | 354 | 4.87/5.0 |
| Jesse And Adria | 1 | $78,809 | 61 | 4.97/5.0 |
| Jenna | 3 | $71,298 | 67 | 3.32/5.0 |
| Alex | 1 | $70,221 | 104 | 4.98/5.0 |
| Daniel | 1 | $66,407 | 102 | 4.90/5.0 |
| Janagan | 1 | $58,381 | 17 | 4.94/5.0 |
| Freda | 1 | $50,709 | 46 | 4.93/5.0 |
| Wendy | 1 | $44,093 | 137 | 4.95/5.0 |
| Mitch | 1 | $43,013 | 719 | 4.83/5.0 |
Analyzing the strategies of top hosts, such as their property selection, pricing, and guest communication, can offer valuable lessons for optimizing your own Airbnb operations in Brighton.
Dive Deeper: Advanced Brighton STR Market Data (2025)
Ready to unlock more insights? AirROI provides access to advanced metrics and comprehensive Airbnb data for Brighton. Explore detailed analytics beyond this report to refine your investment strategy, optimize pricing, and maximize your vacation rental profits.
Explore Advanced MetricsBrighton Short-Term Rental Market Composition (2025): Property & Room Types
Room Type Distribution
Property Type Distribution
Market Composition Insights for Brighton
- The Brighton Airbnb market composition is heavily skewed towards Entire Home/Apt listings, which make up 75% of the 44 active rentals. This indicates strong guest preference for privacy and space.
- Looking at the property type distribution in Brighton, House properties are the most common (52.3%), reflecting the local real estate landscape.
- Houses represent a significant 52.3% portion, catering likely to families or larger groups.
- The presence of 18.2% Hotel/Boutique listings indicates integration with traditional hospitality.
- Smaller segments like outdoor/unique (combined 4.5%) offer potential for unique stay experiences.
Brighton Airbnb Room Capacity Analysis (2025): Bedroom Distribution
Distribution of Listings by Number of Bedrooms
Room Capacity Insights for Brighton
- The dominant room capacity in Brighton is 2 bedrooms listings, making up 27.3% of the market. This suggests a strong demand for properties suitable for couples or solo travelers.
- Together, 2 bedrooms and 3 bedrooms properties represent 50.0% of the active Airbnb listings in Brighton, indicating a high concentration in these sizes.
- A significant 43.2% of listings offer 3+ bedrooms, catering to larger groups and families seeking more space in Brighton.
Brighton Vacation Rental Guest Capacity Trends (2025)
Distribution of Listings by Guest Capacity
Guest Capacity Insights for Brighton
- The most common guest capacity trend in Brighton vacation rentals is listings accommodating 8+ guests (27.3%). This suggests the primary traveler segment is likely larger groups.
- Properties designed for 8+ guests and 4 guests dominate the Brighton STR market, accounting for 47.8% of listings.
- 45.5% of properties accommodate 6+ guests, serving the market segment for larger families or group travel in Brighton.
- On average, properties in Brighton are equipped to host 4.7 guests.
Brighton Airbnb Booking Patterns (2025): Available vs. Booked Days
Available Days Distribution
Booked Days Distribution
Booking Pattern Insights for Brighton
- The most common availability pattern in Brighton falls within the 181-270 days range, representing 45.5% of listings. This suggests many properties have significant open periods on their calendars.
- Approximately 88.7% of listings show high availability (181+ days open annually), indicating potential for increased bookings or specific owner usage patterns.
- For booked days, the 91-180 days range is most frequent in Brighton (47.7%), reflecting common guest stay durations or potential owner blocking patterns.
- A notable 11.4% of properties secure long booking periods (181+ days booked per year), highlighting successful long-term rental strategies or significant owner usage.
Brighton Airbnb Minimum Stay Requirements Analysis
Distribution of Listings by Minimum Night Requirement
1 Night
11 listings
25.6% of total
2 Nights
24 listings
55.8% of total
3 Nights
2 listings
4.7% of total
30+ Nights
6 listings
14% of total
Key Insights
- The most prevalent minimum stay requirement in Brighton is 2 Nights, adopted by 55.8% of listings. This highlights the market's preference for shorter, flexible bookings.
- A strong majority (81.4%) of the Brighton Airbnb data shows acceptance of very short stays (1-2 nights), indicating a dynamic, high-turnover market.
- A significant segment (14%) caters to monthly stays (30+ nights) in Brighton, pointing to opportunities in the extended-stay market.
Recommendations
- Align with the market by considering a 2 Nights minimum stay, as 55.8% of Brighton hosts use this setting.
- If feasible, allowing 1-night stays, especially midweek or during low season, could capture last-minute bookings, as only 25.6% currently do.
- Explore offering discounts for stays of 30+ nights to attract the 14% of the market seeking extended stays.
- Adjust minimum nights based on seasonality – potentially shorter during low season and longer during peak demand periods in Brighton.
Brighton Airbnb Cancellation Policy Trends Analysis (2025)
Flexible
8 listings
20% of total
Moderate
8 listings
20% of total
Firm
18 listings
45% of total
Strict
6 listings
15% of total
Cancellation Policy Insights for Brighton
- The prevailing Airbnb cancellation policy trend in Brighton is Firm, used by 45% of listings.
- A majority (60.0%) of hosts in Brighton utilize Firm or Strict policies, indicating a market where hosts prioritize booking security.
Recommendations for Hosts
- Consider adopting a Firm policy to align with the 45% market standard in Brighton.
- Regularly review your cancellation policy against competitors and market demand shifts in Brighton.
Brighton STR Booking Lead Time Analysis (2025)
Average Booking Lead Time by Month
Booking Lead Time Insights for Brighton
- The overall average booking lead time for vacation rentals in Brighton is 44 days.
- Guests book furthest in advance for stays during June (average 72 days), likely coinciding with peak travel demand or local events.
- The shortest booking windows occur for stays in November (average 22 days), indicating more last-minute travel plans during this time.
- Seasonally, Summer (60 days avg.) sees the longest lead times, while Winter (32 days avg.) has the shortest, reflecting typical travel planning cycles.
Recommendations for Hosts
- Use the overall average lead time (44 days) as a baseline for your pricing and availability strategy in Brighton.
- For June stays, consider implementing length-of-stay discounts or slightly higher rates for bookings made less than 72 days out to capitalize on advance planning.
- Target marketing efforts for the Summer season well in advance (at least 60 days) to capture early planners.
- Monitor your own booking lead times against these Brighton averages to identify opportunities for dynamic pricing adjustments.
Popular & Essential Airbnb Amenities in Brighton (2025)
Amenity Prevalence
Amenity Insights for Brighton
- Essential amenities in Brighton that guests expect include: Heating, Free parking on premises, Wifi, Smoke alarm, TV, Bed linens, Hair dryer, Hot water. Lacking these (any) could significantly impact bookings.
- Popular amenities like Fire extinguisher, Hangers are common but not universal. Offering these can provide a competitive edge.
Recommendations for Hosts
- Ensure your listing includes all essential amenities for Brighton: Heating, Free parking on premises, Wifi, Smoke alarm, TV, Bed linens, Hair dryer, Hot water.
- Prioritize adding missing essentials: TV, Bed linens, Hair dryer, Hot water.
- Consider adding popular differentiators like Fire extinguisher or Hangers to increase appeal.
- Highlight unique or less common amenities you offer (e.g., hot tub, dedicated workspace, EV charger) in your listing description and photos.
- Regularly check competitor amenities in Brighton to stay competitive.
Brighton Airbnb Guest Demographics & Profile Analysis (2025)
Guest Profile Summary for Brighton
- The typical guest profile for Airbnb in Brighton consists of primarily domestic travelers (92%), often arriving from nearby Toronto, typically belonging to the Post-2000s (Gen Z/Alpha) group (50%), primarily speaking English or French.
- Domestic travelers account for 91.6% of guests.
- Key international markets include Canada (91.6%) and United States (4%).
- Top languages spoken are English (53.7%) followed by French (21.6%).
- A significant demographic segment is the Post-2000s (Gen Z/Alpha) group, representing 50% of guests.
Recommendations for Hosts
- Target domestic marketing efforts towards travelers from Toronto and Montreal.
- Tailor amenities and listing descriptions to appeal to the dominant Post-2000s (Gen Z/Alpha) demographic (e.g., highlight fast WiFi, smart home features, local guides).
- Highlight unique local experiences or amenities relevant to the primary guest profile.
- Consider seasonal promotions aligned with peak travel times for key origin markets.
Nearby Short-Term Rental Market Comparison
How does the Brighton Airbnb market stack up against its neighbors? Compare key performance metrics like average monthly revenue, ADR, and occupancy rates in surrounding areas to understand the broader regional STR landscape.
| Market | Active Properties | Monthly Revenue | Daily Rate | Avg. Occupancy |
|---|---|---|---|---|
| Town of Porter | 25 | $4,243 | $300.26 | 55% |
| Carrying Place | 20 | $3,737 | $315.96 | 48% |
| Town of Pittsford | 53 | $3,628 | $410.81 | 43% |
| Town of Cicero | 33 | $3,611 | $238.12 | 54% |
| Rossmore | 10 | $3,345 | $268.20 | 56% |
| Town of Wilson | 27 | $3,195 | $257.32 | 48% |
| Town of Lyme | 29 | $3,140 | $268.25 | 46% |
| Consecon | 26 | $3,124 | $299.57 | 43% |
| Village of Fairport | 25 | $3,068 | $216.06 | 54% |
| Dysart et al | 264 | $3,046 | $310.03 | 42% |