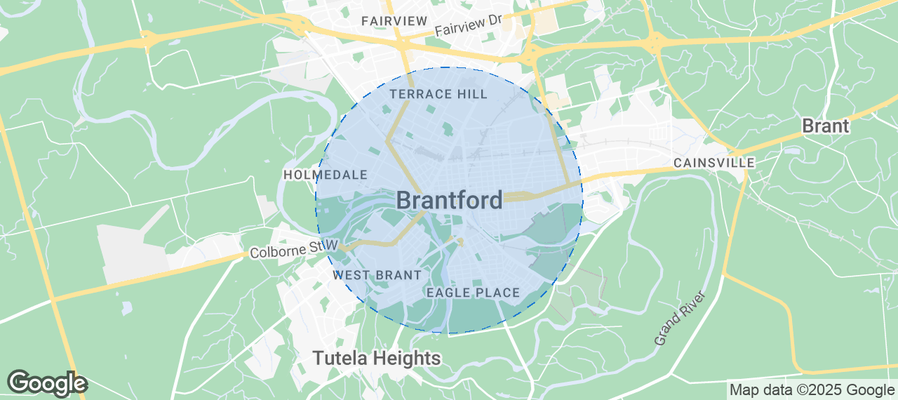
Brantford Airbnb Market Analysis 2025: Short Term Rental Data & Vacation Rental Statistics in Ontario, Canada
Is Airbnb profitable in Brantford in 2025? Explore comprehensive Airbnb analytics for Brantford, Ontario, Canada to uncover income potential. This 2025 STR market report for Brantford, based on AirROI data from April 2024 to March 2025, reveals key trends in the niche market of 86 active listings.
Whether you're considering an Airbnb investment in Brantford, optimizing your existing vacation rental, or exploring rental arbitrage opportunities, understanding the Brantford Airbnb data is crucial. Leveraging the low regulation environment is key to maximizing your short term rental income potential. Let's dive into the specifics.
Key Brantford Airbnb Performance Metrics Overview
Monthly Airbnb Revenue Variations & Income Potential in Brantford (2025)
Understanding the monthly revenue variations for Airbnb listings in Brantford is key to maximizing your short term rental income potential. Seasonality significantly impacts earnings. Our analysis, based on data from the past 12 months, shows that the peak revenue month for STRs in Brantford is typically May, while March often presents the lowest earnings, highlighting opportunities for strategic pricing adjustments during shoulder and low seasons. Explore the typical Airbnb income in Brantford across different performance tiers:
- Best-in-class properties (Top 10%) achieve $2,986+ monthly, often utilizing dynamic pricing and superior guest experiences.
- Strong performing properties (Top 25%) earn $2,196 or more, indicating effective management and desirable locations/amenities.
- Typical properties (Median) generate around $1,266 per month, representing the average market performance.
- Entry-level properties (Bottom 25%) see earnings around $603, often with potential for optimization.
Average Monthly Airbnb Earnings Trend in Brantford
Brantford Airbnb Occupancy Rate Trends (2025)
Maximize your bookings by understanding the Brantford STR occupancy trends. Seasonal demand shifts significantly influence how often properties are booked. Typically, Septembersees the highest demand (peak season occupancy), while February experiences the lowest (low season). Effective strategies, like adjusting minimum stays or offering promotions, can boost occupancy during slower periods. Here's how different property tiers perform in Brantford:
- Best-in-class properties (Top 10%) achieve 82%+ occupancy, indicating high desirability and potentially optimized availability.
- Strong performing properties (Top 25%) maintain 64% or higher occupancy, suggesting good market fit and guest satisfaction.
- Typical properties (Median) have an occupancy rate around 41%.
- Entry-level properties (Bottom 25%) average 19% occupancy, potentially facing higher vacancy.
Average Monthly Occupancy Rate Trend in Brantford
Average Daily Rate (ADR) Airbnb Trends in Brantford (2025)
Effective short term rental pricing strategy in Brantford involves understanding monthly ADR fluctuations. The Average Daily Rate (ADR) for Airbnb in Brantford typically peaks in June and dips lowest during February. Leveraging Airbnb dynamic pricing tools or strategies based on this seasonality can significantly boost revenue. Here's a look at the typical nightly rates achieved:
- Best-in-class properties (Top 10%) command rates of $147+ per night, often due to premium features or locations.
- Strong performing properties (Top 25%) achieve nightly rates of $109 or more.
- Typical properties (Median) charge around $83 per night.
- Entry-level properties (Bottom 25%) earn around $53 per night.
Average Daily Rate (ADR) Trend by Month in Brantford
Get Live Brantford Market Intelligence 👇
Explore Real-time Analytics
Airbnb Seasonality Analysis & Trends in Brantford (2025)
Peak Season (May, June, April)
- Revenue averages $2,146 per month
- Occupancy rates average 43.0%
- Daily rates average $93
Shoulder Season
- Revenue averages $1,495 per month
- Occupancy maintains around 47.0%
- Daily rates hold near $92
Low Season (January, February, March)
- Revenue drops to average $944 per month
- Occupancy decreases to average 34.5%
- Daily rates adjust to average $90
Seasonality Insights for Brantford
- The Airbnb seasonality in Brantford shows highly seasonal trends requiring careful strategy. While the sections above show seasonal averages, it's also insightful to look at the extremes:
- During the high season, the absolute peak month showcases Brantford's highest earning potential, with monthly revenues capable of climbing to $2,304, occupancy reaching a high of 55.8%, and ADRs peaking at $93.
- Conversely, the slowest single month of the year, typically falling within the low season, marks the market's lowest point. In this month, revenue might dip to $889, occupancy could drop to 31.8%, and ADRs may adjust down to $90.
- Understanding both the seasonal averages and these monthly peaks and troughs in revenue, occupancy, and ADR is crucial for maximizing your Airbnb profit potential in Brantford.
Seasonal Strategies for Maximizing Profit
- Peak Season: Maximize revenue through premium pricing and potentially longer minimum stays. Ensure high availability.
- Low Season: Offer competitive pricing, special promotions (e.g., extended stay discounts), and flexible cancellation policies. Target off-season travelers like remote workers or budget-conscious guests.
- Shoulder Seasons: Implement dynamic pricing that balances peak and low rates. Target weekend travelers or specific events. Offer slightly more flexible terms than peak season.
- Regularly analyze your own performance against these Brantford seasonality benchmarks and adjust your pricing and availability strategy accordingly.
Best Areas for Airbnb Investment in Brantford (2025)
Exploring the top neighborhoods for short-term rentals in Brantford? This section highlights key areas, outlining why they are attractive for hosts and guests, along with notable local attractions. Consider these locations based on your target guest profile and investment strategy.
| Neighborhood / Area | Why Host Here? (Target Guests & Appeal) | Key Attractions & Landmarks |
|---|---|---|
| Downtown Brantford | Vibrant hub of Brantford with shopping, dining, and entertainment options. Ideal for guests looking for an urban experience with easy access to attractions like the Bell Homestead. | Brantford Civic Centre, Brantford Public Library, Harmony Square, Brantford Farmer's Market, Bell Homestead National Historic Site |
| West Brant | Family-friendly neighborhood that offers a quiet suburban lifestyle with parks and schools. Attracts families and individuals seeking a peaceful stay near nature. | Gus Harris Park, Hanging Gardens of Brantford, Brant Conservation Area, West Brant Sports Complex, Briar Park |
| Brantford Township | A blend of rural charm with quick access to city amenities. Great for nature lovers and those looking to escape the urban hustle. | Lynden Park Mall, Grand River Trail, Pinehurst Lake Conservation Area, Woodland Cultural Centre, The Arboretum |
| Eagle Place | A diverse community known for its cultural richness and local community events. Perfect for guests who want to experience local life in Brantford. | Eagle Place Community Centre, Duncan McIntosh Park, Barker Park, Grand River, Local eateries |
| North End | A residential area with a mix of old and new homes. Popular among visitors who prefer a quieter stay while still being close to the city center. | North Park Sports Complex, Brantford Golf Club, St. Andrew's Church, Bankside Park, Chandler Park |
| St. George | A picturesque village offering a quaint atmosphere with local shops and dining. Ideal for those looking for a charming small-town experience. | St. George Historical Society, Pinehurst Lake, St. George Market, Brantford Golf and Country Club, Local cafes and boutiques |
| Bertie Park | An upcoming neighborhood with new developments and investments. Attracts young professionals and those interested in modern amenities. | Bertie Park, Newly developed residential areas, Closer to highway access, Local parks, Dining options |
| Ohsweken | Located on the Six Nations Reserve, this area offers a unique cultural experience with Indigenous history. Great for guests interested in cultural activities. | Six Nations Tourism, Iroquois Village, Local artisan shops, Cultural events, Nature trails |
Understanding Airbnb License Requirements & STR Laws in Brantford (2025)
While Brantford, Ontario, Canada currently shows low STR regulations, specific Airbnb license requirements might still exist or change. Always verify the latest short term rental regulations and Airbnb license requirements directly with local government authorities for Brantford to ensure full compliance before hosting.
(Source: AirROI data, 2025, finding no licensed listings among those analyzed)
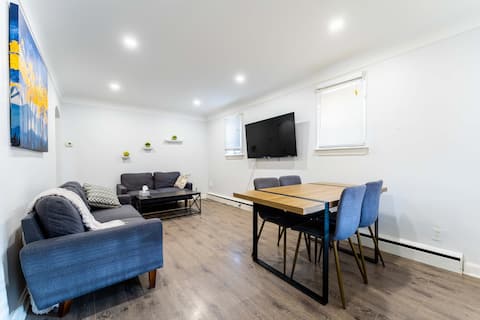
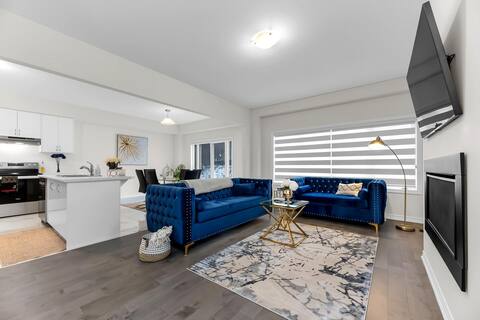
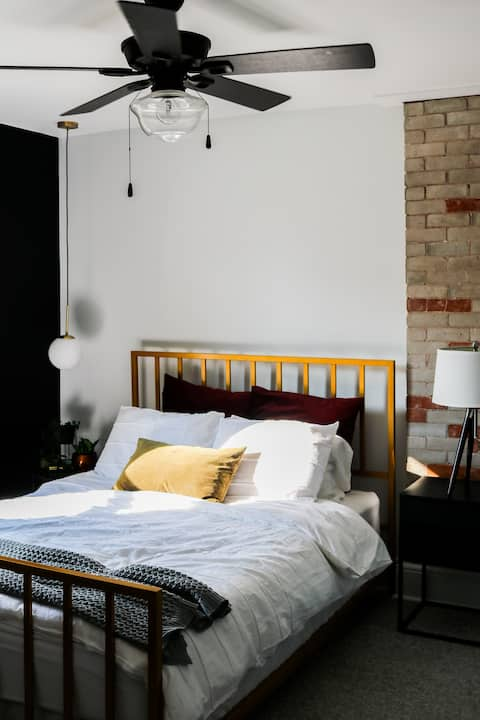
Top Performing Airbnb Properties in Brantford (2025)
Benchmark your potential! Explore examples of top-performing Airbnb properties in Brantfordbased on Trailing Twelve Month (TTM) revenue. Analyze their characteristics, revenue, occupancy rate, and ADR to understand what drives success in this market.

Cozy Winter Oasis with Jacuzzi & Indoor Sauna
Entire Place • 4 bedrooms
Luxe | 3 TV's | 2 Kitchens | Mins Frm DT | Parking
Entire Place • 4 bedrooms
Deja Blue Haven: Your Spacious Suburban Retreat
Entire Place • 3 bedrooms
2-bedroom Eclectic apartment (The Copper Flat)
Entire Place • 2 bedrooms

Langford Cottage
Entire Place • 3 bedrooms

Vacation resort without leaving the country!
Entire Place • 3 bedrooms
Note: Performance varies based on location, size, amenities, seasonality, and management quality. Data reflects the past 12 months.
Top Performing Airbnb Hosts in Brantford (2025)
Learn from the best! This table showcases top-performing Airbnb hosts in Brantford based on the number of properties managed and estimated total revenue over the past year. Analyze their scale and performance metrics.
| Host Name | Properties | Grossing Revenue | Stay Reviews | Avg Rating |
|---|---|---|---|---|
| Zari | 3 | $64,529 | 137 | 4.69/5.0 |
| Rafael | 6 | $56,619 | 129 | 4.88/5.0 |
| Frank | 2 | $56,545 | 55 | 4.95/5.0 |
| Celeste | 1 | $55,039 | 112 | 4.77/5.0 |
| Ishtiaq | 4 | $54,259 | 314 | 4.78/5.0 |
| Elizabeth | 2 | $46,968 | 113 | 4.92/5.0 |
| Harold | 2 | $38,388 | 3 | 2.33/5.0 |
| Susan | 3 | $37,187 | 203 | 4.81/5.0 |
| David And Rachel | 1 | $36,044 | 31 | 4.90/5.0 |
| Megan | 1 | $33,448 | 102 | 4.97/5.0 |
Analyzing the strategies of top hosts, such as their property selection, pricing, and guest communication, can offer valuable lessons for optimizing your own Airbnb operations in Brantford.
Dive Deeper: Advanced Brantford STR Market Data (2025)
Ready to unlock more insights? AirROI provides access to advanced metrics and comprehensive Airbnb data for Brantford. Explore detailed analytics beyond this report to refine your investment strategy, optimize pricing, and maximize your vacation rental profits.
Explore Advanced MetricsBrantford Short-Term Rental Market Composition (2025): Property & Room Types
Room Type Distribution
Property Type Distribution
Market Composition Insights for Brantford
- The Brantford Airbnb market composition is heavily skewed towards Entire Home/Apt listings, which make up 67.4% of the 86 active rentals. This indicates strong guest preference for privacy and space.
- However, a notable 32.6% share for Private Rooms suggests opportunities for budget-conscious travelers or hosts renting out spare rooms.
- Looking at the property type distribution in Brantford, House properties are the most common (58.1%), reflecting the local real estate landscape.
- Houses represent a significant 58.1% portion, catering likely to families or larger groups.
- The presence of 5.8% Hotel/Boutique listings indicates integration with traditional hospitality.
- Smaller segments like outdoor/unique (combined 1.2%) offer potential for unique stay experiences.
Brantford Airbnb Room Capacity Analysis (2025): Bedroom Distribution
Distribution of Listings by Number of Bedrooms
Room Capacity Insights for Brantford
- The dominant room capacity in Brantford is 1 bedroom listings, making up 33.7% of the market. This suggests a strong demand for properties suitable for couples or solo travelers.
- Together, 1 bedroom and 2 bedrooms properties represent 55.8% of the active Airbnb listings in Brantford, indicating a high concentration in these sizes.
- A significant 25.5% of listings offer 3+ bedrooms, catering to larger groups and families seeking more space in Brantford.
Brantford Vacation Rental Guest Capacity Trends (2025)
Distribution of Listings by Guest Capacity
Guest Capacity Insights for Brantford
- The most common guest capacity trend in Brantford vacation rentals is listings accommodating 4 guests (20.9%). This suggests the primary traveler segment is likely small families or groups.
- Properties designed for 4 guests and 2 guests dominate the Brantford STR market, accounting for 40.7% of listings.
- 25.6% of properties accommodate 6+ guests, serving the market segment for larger families or group travel in Brantford.
- On average, properties in Brantford are equipped to host 3.4 guests.
Brantford Airbnb Booking Patterns (2025): Available vs. Booked Days
Available Days Distribution
Booked Days Distribution
Booking Pattern Insights for Brantford
- The most common availability pattern in Brantford falls within the 181-270 days range, representing 39.5% of listings. This suggests many properties have significant open periods on their calendars.
- Approximately 70.9% of listings show high availability (181+ days open annually), indicating potential for increased bookings or specific owner usage patterns.
- For booked days, the 91-180 days range is most frequent in Brantford (41.9%), reflecting common guest stay durations or potential owner blocking patterns.
- A notable 29.1% of properties secure long booking periods (181+ days booked per year), highlighting successful long-term rental strategies or significant owner usage.
Brantford Airbnb Minimum Stay Requirements Analysis
Distribution of Listings by Minimum Night Requirement
1 Night
36 listings
46.2% of total
2 Nights
18 listings
23.1% of total
3 Nights
5 listings
6.4% of total
4-6 Nights
7 listings
9% of total
7-29 Nights
3 listings
3.8% of total
30+ Nights
9 listings
11.5% of total
Key Insights
- The most prevalent minimum stay requirement in Brantford is 1 Night, adopted by 46.2% of listings. This highlights the market's preference for shorter, flexible bookings.
- A strong majority (69.3%) of the Brantford Airbnb data shows acceptance of very short stays (1-2 nights), indicating a dynamic, high-turnover market.
- A significant segment (11.5%) caters to monthly stays (30+ nights) in Brantford, pointing to opportunities in the extended-stay market.
Recommendations
- Align with the market by considering a 1 Night minimum stay, as 46.2% of Brantford hosts use this setting.
- Explore offering discounts for stays of 30+ nights to attract the 11.5% of the market seeking extended stays.
- Adjust minimum nights based on seasonality – potentially shorter during low season and longer during peak demand periods in Brantford.
Brantford Airbnb Cancellation Policy Trends Analysis (2025)
Flexible
23 listings
34.8% of total
Moderate
18 listings
27.3% of total
Firm
10 listings
15.2% of total
Strict
15 listings
22.7% of total
Cancellation Policy Insights for Brantford
- The prevailing Airbnb cancellation policy trend in Brantford is Flexible, used by 34.8% of listings.
- There's a relatively balanced mix between guest-friendly (62.1%) and stricter (37.9%) policies, offering choices for different guest needs.
Recommendations for Hosts
- Consider adopting a Flexible policy to align with the 34.8% market standard in Brantford.
- Regularly review your cancellation policy against competitors and market demand shifts in Brantford.
Brantford STR Booking Lead Time Analysis (2025)
Average Booking Lead Time by Month
Booking Lead Time Insights for Brantford
- The overall average booking lead time for vacation rentals in Brantford is 29 days.
- Guests book furthest in advance for stays during July (average 56 days), likely coinciding with peak travel demand or local events.
- The shortest booking windows occur for stays in January (average 20 days), indicating more last-minute travel plans during this time.
- Seasonally, Summer (42 days avg.) sees the longest lead times, while Fall (27 days avg.) has the shortest, reflecting typical travel planning cycles.
Recommendations for Hosts
- Use the overall average lead time (29 days) as a baseline for your pricing and availability strategy in Brantford.
- For July stays, consider implementing length-of-stay discounts or slightly higher rates for bookings made less than 56 days out to capitalize on advance planning.
- Target marketing efforts for the Summer season well in advance (at least 42 days) to capture early planners.
- Monitor your own booking lead times against these Brantford averages to identify opportunities for dynamic pricing adjustments.
Popular & Essential Airbnb Amenities in Brantford (2025)
Amenity Prevalence
Amenity Insights for Brantford
- Essential amenities in Brantford that guests expect include: Smoke alarm, Wifi, Air conditioning, Heating, Hot water. Lacking these (any) could significantly impact bookings.
- Popular amenities like Carbon monoxide alarm, Essentials, TV are common but not universal. Offering these can provide a competitive edge.
Recommendations for Hosts
- Ensure your listing includes all essential amenities for Brantford: Smoke alarm, Wifi, Air conditioning, Heating, Hot water.
- Prioritize adding missing essentials: Wifi, Air conditioning, Heating, Hot water.
- Consider adding popular differentiators like Carbon monoxide alarm or Essentials to increase appeal.
- Highlight unique or less common amenities you offer (e.g., hot tub, dedicated workspace, EV charger) in your listing description and photos.
- Regularly check competitor amenities in Brantford to stay competitive.
Brantford Airbnb Guest Demographics & Profile Analysis (2025)
Guest Profile Summary for Brantford
- The typical guest profile for Airbnb in Brantford consists of primarily domestic travelers (78%), often arriving from nearby Toronto, typically belonging to the Post-2000s (Gen Z/Alpha) group (50%), primarily speaking English or French.
- Domestic travelers account for 77.9% of guests.
- Key international markets include Canada (77.9%) and United States (16.4%).
- Top languages spoken are English (66.3%) followed by French (10.8%).
- A significant demographic segment is the Post-2000s (Gen Z/Alpha) group, representing 50% of guests.
Recommendations for Hosts
- Target domestic marketing efforts towards travelers from Toronto and Brantford.
- Tailor amenities and listing descriptions to appeal to the dominant Post-2000s (Gen Z/Alpha) demographic (e.g., highlight fast WiFi, smart home features, local guides).
- Highlight unique local experiences or amenities relevant to the primary guest profile.
- Consider seasonal promotions aligned with peak travel times for key origin markets.
Nearby Short-Term Rental Market Comparison
How does the Brantford Airbnb market stack up against its neighbors? Compare key performance metrics like average monthly revenue, ADR, and occupancy rates in surrounding areas to understand the broader regional STR landscape.
| Market | Active Properties | Monthly Revenue | Daily Rate | Avg. Occupancy |
|---|---|---|---|---|
| North East Township | 34 | $3,530 | $264.33 | 48% |
| Niagara-on-the-Lake | 413 | $3,358 | $265.20 | 44% |
| Town of Stockton | 16 | $3,172 | $232.49 | 46% |
| Town of Brant | 10 | $2,928 | $274.43 | 43% |
| Severn | 154 | $2,845 | $306.35 | 39% |
| Meaford | 129 | $2,843 | $246.44 | 45% |
| Town of French Creek | 46 | $2,842 | $286.58 | 33% |
| King | 29 | $2,840 | $269.07 | 33% |
| Mulmur | 43 | $2,837 | $283.33 | 42% |
| Gravenhurst | 220 | $2,834 | $308.96 | 41% |