Bloomfield Airbnb Market Analysis 2025: Short Term Rental Data & Vacation Rental Statistics in Ontario, Canada
Is Airbnb profitable in Bloomfield in 2025? Explore comprehensive Airbnb analytics for Bloomfield, Ontario, Canada to uncover income potential. This 2025 STR market report for Bloomfield, based on AirROI data from April 2024 to March 2025, reveals key trends in the niche market of 46 active listings.
Whether you're considering an Airbnb investment in Bloomfield, optimizing your existing vacation rental, or exploring rental arbitrage opportunities, understanding the Bloomfield Airbnb data is crucial. Navigating the high regulation landscape is key to maximizing your short term rental income potential. Let's dive into the specifics.
Key Bloomfield Airbnb Performance Metrics Overview
Monthly Airbnb Revenue Variations & Income Potential in Bloomfield (2025)
Understanding the monthly revenue variations for Airbnb listings in Bloomfield is key to maximizing your short term rental income potential. Seasonality significantly impacts earnings. Our analysis, based on data from the past 12 months, shows that the peak revenue month for STRs in Bloomfield is typically August, while February often presents the lowest earnings, highlighting opportunities for strategic pricing adjustments during shoulder and low seasons. Explore the typical Airbnb income in Bloomfield across different performance tiers:
- Best-in-class properties (Top 10%) achieve $5,798+ monthly, often utilizing dynamic pricing and superior guest experiences.
- Strong performing properties (Top 25%) earn $4,033 or more, indicating effective management and desirable locations/amenities.
- Typical properties (Median) generate around $2,649 per month, representing the average market performance.
- Entry-level properties (Bottom 25%) see earnings around $1,611, often with potential for optimization.
Average Monthly Airbnb Earnings Trend in Bloomfield
Bloomfield Airbnb Occupancy Rate Trends (2025)
Maximize your bookings by understanding the Bloomfield STR occupancy trends. Seasonal demand shifts significantly influence how often properties are booked. Typically, Augustsees the highest demand (peak season occupancy), while March experiences the lowest (low season). Effective strategies, like adjusting minimum stays or offering promotions, can boost occupancy during slower periods. Here's how different property tiers perform in Bloomfield:
- Best-in-class properties (Top 10%) achieve 73%+ occupancy, indicating high desirability and potentially optimized availability.
- Strong performing properties (Top 25%) maintain 48% or higher occupancy, suggesting good market fit and guest satisfaction.
- Typical properties (Median) have an occupancy rate around 35%.
- Entry-level properties (Bottom 25%) average 22% occupancy, potentially facing higher vacancy.
Average Monthly Occupancy Rate Trend in Bloomfield
Average Daily Rate (ADR) Airbnb Trends in Bloomfield (2025)
Effective short term rental pricing strategy in Bloomfield involves understanding monthly ADR fluctuations. The Average Daily Rate (ADR) for Airbnb in Bloomfield typically peaks in July and dips lowest during March. Leveraging Airbnb dynamic pricing tools or strategies based on this seasonality can significantly boost revenue. Here's a look at the typical nightly rates achieved:
- Best-in-class properties (Top 10%) command rates of $403+ per night, often due to premium features or locations.
- Strong performing properties (Top 25%) achieve nightly rates of $282 or more.
- Typical properties (Median) charge around $226 per night.
- Entry-level properties (Bottom 25%) earn around $170 per night.
Average Daily Rate (ADR) Trend by Month in Bloomfield
Get Live Bloomfield Market Intelligence 👇

Explore Real-time Analytics
Airbnb Seasonality Analysis & Trends in Bloomfield (2025)
Peak Season (August, July, June)
- Revenue averages $5,855 per month
- Occupancy rates average 63.2%
- Daily rates average $276
Shoulder Season
- Revenue averages $2,583 per month
- Occupancy maintains around 33.8%
- Daily rates hold near $250
Low Season (January, February, March)
- Revenue drops to average $1,247 per month
- Occupancy decreases to average 21.2%
- Daily rates adjust to average $221
Seasonality Insights for Bloomfield
- The Airbnb seasonality in Bloomfield shows highly seasonal trends requiring careful strategy. While the sections above show seasonal averages, it's also insightful to look at the extremes:
- During the high season, the absolute peak month showcases Bloomfield's highest earning potential, with monthly revenues capable of climbing to $6,558, occupancy reaching a high of 73.2%, and ADRs peaking at $280.
- Conversely, the slowest single month of the year, typically falling within the low season, marks the market's lowest point. In this month, revenue might dip to $1,189, occupancy could drop to 18.3%, and ADRs may adjust down to $218.
- Understanding both the seasonal averages and these monthly peaks and troughs in revenue, occupancy, and ADR is crucial for maximizing your Airbnb profit potential in Bloomfield.
Seasonal Strategies for Maximizing Profit
- Peak Season: Maximize revenue through premium pricing and potentially longer minimum stays. Ensure high availability.
- Low Season: Offer competitive pricing, special promotions (e.g., extended stay discounts), and flexible cancellation policies. Target off-season travelers like remote workers or budget-conscious guests.
- Shoulder Seasons: Implement dynamic pricing that balances peak and low rates. Target weekend travelers or specific events. Offer slightly more flexible terms than peak season.
- Regularly analyze your own performance against these Bloomfield seasonality benchmarks and adjust your pricing and availability strategy accordingly.
Best Areas for Airbnb Investment in Bloomfield (2025)
Exploring the top neighborhoods for short-term rentals in Bloomfield? This section highlights key areas, outlining why they are attractive for hosts and guests, along with notable local attractions. Consider these locations based on your target guest profile and investment strategy.
| Neighborhood / Area | Why Host Here? (Target Guests & Appeal) | Key Attractions & Landmarks |
|---|---|---|
| Main Street | Bloomfield's central hub featuring local shops, cafes, and restaurants. Ideal for tourists seeking a quaint small-town experience with easy access to community events and amenities. | Bloomfield Farmers' Market, Local Art Galleries, Quaint Cafes, Boutique Shops, Annual Festivals |
| Sandbanks Provincial Park | A short drive from Bloomfield, this beautiful national park attracts nature lovers and outdoor enthusiasts. The beaches and hiking trails make it a prime spot for summer visitors. | Sandbanks Beach, Dunes Trails, Wine Tours, Picnic Areas, Bird Watching |
| Picton | Nearby Picton offers a vibrant arts scene and historical charm. It's a popular destination for tourists exploring Prince Edward County's wineries and dining. | Picton Harbour, The Regent Theatre, Arts on Main Gallery, Local Wineries, Historical Sites |
| Wellington | This charming village is known for its scenic waterfront and local wineries. Attracts visitors looking for a quiet retreat with access to outdoor activities. | Wellington Beach, Local Wineries, Lakeside Park, Art Galleries, Farmers' Market |
| North Beach Provincial Park | Another beautiful beach area close to Bloomfield, perfect for families and beachgoers. Noted for its sandy shores and picturesque landscape. | North Beach, Picnic Areas, Swimming, Camping, Nature Trails |
| The County Cider Company | A unique destination for cider lovers, offering tastings and events. This location takes advantage of the growing popularity of local beverage tourism. | Cider Tastings, Scenic Views, Live Music Events, Local Farm Produce, Guided Tours |
| Bloomfield Heritage Museum | Attracts history enthusiasts and families. Offers insights into the local culture and history, making it a great spot for educational visits. | Museum Exhibits, Heritage Buildings, Community Events, Local Art Displays, Guided Tours |
| Tyendinaga Mohawk Territory | A culturally rich area that provides unique experiences related to Indigenous culture. It attracts visitors interested in learning and exploring diverse traditions. | Cultural Tours, Local Artisans, Nature Walks, Historical Sites, Community Events |
Understanding Airbnb License Requirements & STR Laws in Bloomfield (2025)
Yes, Bloomfield, Ontario, Canada enforces high STR regulations. Obtaining a license and ensuring compliance is almost certainly required according to current 2025 STR laws. Always verify the latest short term rental regulations and Airbnb license requirements directly with local government authorities for Bloomfield to ensure full compliance before hosting.
(Source: AirROI data, 2025, based on 41% licensed listings)
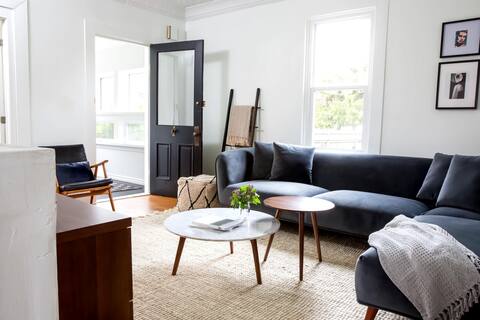
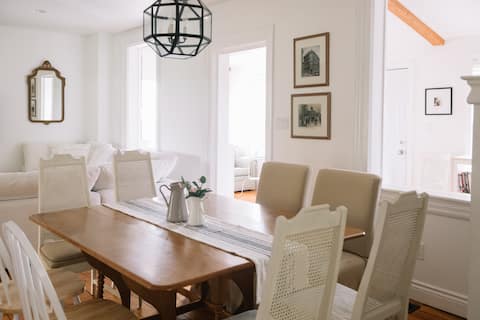
Top Performing Airbnb Properties in Bloomfield (2025)
Benchmark your potential! Explore examples of top-performing Airbnb properties in Bloomfieldbased on Trailing Twelve Month (TTM) revenue. Analyze their characteristics, revenue, occupancy rate, and ADR to understand what drives success in this market.
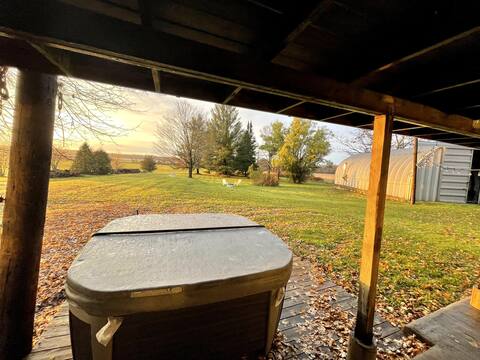
Yellow Door House with Hot Tub + Sauna
Entire Place • 5 bedrooms
The Stanley | Minutes to Sandbanks | Hot Tub
Entire Place • 3 bedrooms

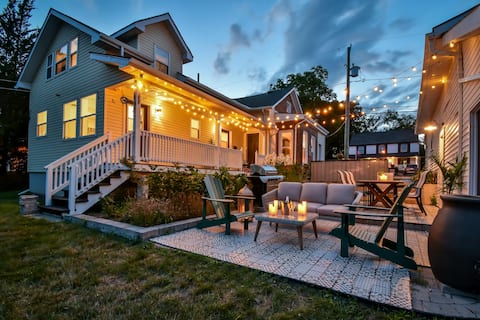
The Bloomfield- Fabulous Farmhouse Retreat
Entire Place • 4 bedrooms
The Harlow | Near Sandbanks | Hot Tub
Entire Place • 4 bedrooms
The Smith - The Heart of Bloomfield
Entire Place • 4 bedrooms

This Is County - Beautiful Renovated Home.
Entire Place • 4 bedrooms
Note: Performance varies based on location, size, amenities, seasonality, and management quality. Data reflects the past 12 months.
Top Performing Airbnb Hosts in Bloomfield (2025)
Learn from the best! This table showcases top-performing Airbnb hosts in Bloomfield based on the number of properties managed and estimated total revenue over the past year. Analyze their scale and performance metrics.
| Host Name | Properties | Grossing Revenue | Stay Reviews | Avg Rating |
|---|---|---|---|---|
| County Curated | 2 | $115,842 | 60 | 4.93/5.0 |
| Joshua | 1 | $73,565 | 164 | 4.84/5.0 |
| Alex | 3 | $65,251 | 74 | 4.99/5.0 |
| Robyn | 1 | $60,449 | 72 | 5.00/5.0 |
| Bruce | 1 | $49,668 | 111 | 4.90/5.0 |
| Jimmy | 1 | $46,822 | 330 | 4.74/5.0 |
| Host #245085387 | 2 | $46,424 | 54 | 4.70/5.0 |
| Ricardo | 1 | $46,158 | 274 | 4.88/5.0 |
| Adam | 1 | $43,496 | 91 | 4.99/5.0 |
| Trish & Chris | 1 | $43,332 | 134 | 4.92/5.0 |
Analyzing the strategies of top hosts, such as their property selection, pricing, and guest communication, can offer valuable lessons for optimizing your own Airbnb operations in Bloomfield.
Dive Deeper: Advanced Bloomfield STR Market Data (2025)
Ready to unlock more insights? AirROI provides access to advanced metrics and comprehensive Airbnb data for Bloomfield. Explore detailed analytics beyond this report to refine your investment strategy, optimize pricing, and maximize your vacation rental profits.
Explore Advanced MetricsBloomfield Short-Term Rental Market Composition (2025): Property & Room Types
Room Type Distribution
Property Type Distribution
Market Composition Insights for Bloomfield
- The Bloomfield Airbnb market composition is heavily skewed towards Entire Home/Apt listings, which make up 87% of the 46 active rentals. This indicates strong guest preference for privacy and space.
- Looking at the property type distribution in Bloomfield, House properties are the most common (65.2%), reflecting the local real estate landscape.
- Houses represent a significant 65.2% portion, catering likely to families or larger groups.
- The presence of 17.4% Hotel/Boutique listings indicates integration with traditional hospitality.
- Smaller segments like outdoor/unique (combined 2.2%) offer potential for unique stay experiences.
Bloomfield Airbnb Room Capacity Analysis (2025): Bedroom Distribution
Distribution of Listings by Number of Bedrooms
Room Capacity Insights for Bloomfield
- The dominant room capacity in Bloomfield is 2 bedrooms listings, making up 32.6% of the market. This suggests a strong demand for properties suitable for couples or solo travelers.
- Together, 2 bedrooms and 3 bedrooms properties represent 52.2% of the active Airbnb listings in Bloomfield, indicating a high concentration in these sizes.
- A significant 41.3% of listings offer 3+ bedrooms, catering to larger groups and families seeking more space in Bloomfield.
Bloomfield Vacation Rental Guest Capacity Trends (2025)
Distribution of Listings by Guest Capacity
Guest Capacity Insights for Bloomfield
- The most common guest capacity trend in Bloomfield vacation rentals is listings accommodating 4 guests (37%). This suggests the primary traveler segment is likely small families or groups.
- Properties designed for 4 guests and 6 guests dominate the Bloomfield STR market, accounting for 60.9% of listings.
- 43.5% of properties accommodate 6+ guests, serving the market segment for larger families or group travel in Bloomfield.
- On average, properties in Bloomfield are equipped to host 4.7 guests.
Bloomfield Airbnb Booking Patterns (2025): Available vs. Booked Days
Available Days Distribution
Booked Days Distribution
Booking Pattern Insights for Bloomfield
- The most common availability pattern in Bloomfield falls within the 181-270 days range, representing 54.3% of listings. This suggests many properties have significant open periods on their calendars.
- Approximately 89.1% of listings show high availability (181+ days open annually), indicating potential for increased bookings or specific owner usage patterns.
- For booked days, the 91-180 days range is most frequent in Bloomfield (54.3%), reflecting common guest stay durations or potential owner blocking patterns.
- A notable 13.0% of properties secure long booking periods (181+ days booked per year), highlighting successful long-term rental strategies or significant owner usage.
Bloomfield Airbnb Minimum Stay Requirements Analysis
Distribution of Listings by Minimum Night Requirement
1 Night
4 listings
9.5% of total
2 Nights
34 listings
81% of total
30+ Nights
4 listings
9.5% of total
Key Insights
- The most prevalent minimum stay requirement in Bloomfield is 2 Nights, adopted by 81% of listings. This highlights the market's preference for shorter, flexible bookings.
- A strong majority (90.5%) of the Bloomfield Airbnb data shows acceptance of very short stays (1-2 nights), indicating a dynamic, high-turnover market.
Recommendations
- Align with the market by considering a 2 Nights minimum stay, as 81% of Bloomfield hosts use this setting.
- If feasible, allowing 1-night stays, especially midweek or during low season, could capture last-minute bookings, as only 9.5% currently do.
- A 2-night minimum appears standard (81%). Consider this for weekends or peak periods.
- Explore offering discounts for stays of 30+ nights to attract the 9.5% of the market seeking extended stays.
- Adjust minimum nights based on seasonality – potentially shorter during low season and longer during peak demand periods in Bloomfield.
Bloomfield Airbnb Cancellation Policy Trends Analysis (2025)
Non-refundable
2 listings
4.3% of total
Super Strict 30 Days
1 listings
2.2% of total
Flexible
1 listings
2.2% of total
Moderate
15 listings
32.6% of total
Firm
16 listings
34.8% of total
Strict
11 listings
23.9% of total
Cancellation Policy Insights for Bloomfield
- The prevailing Airbnb cancellation policy trend in Bloomfield is Firm, used by 34.8% of listings.
- A majority (58.7%) of hosts in Bloomfield utilize Firm or Strict policies, indicating a market where hosts prioritize booking security.
Recommendations for Hosts
- Consider adopting a Firm policy to align with the 34.8% market standard in Bloomfield.
- Regularly review your cancellation policy against competitors and market demand shifts in Bloomfield.
Bloomfield STR Booking Lead Time Analysis (2025)
Average Booking Lead Time by Month
Booking Lead Time Insights for Bloomfield
- The overall average booking lead time for vacation rentals in Bloomfield is 60 days.
- Guests book furthest in advance for stays during July (average 97 days), likely coinciding with peak travel demand or local events.
- The shortest booking windows occur for stays in February (average 20 days), indicating more last-minute travel plans during this time.
- Seasonally, Summer (90 days avg.) sees the longest lead times, while Winter (30 days avg.) has the shortest, reflecting typical travel planning cycles.
Recommendations for Hosts
- Use the overall average lead time (60 days) as a baseline for your pricing and availability strategy in Bloomfield.
- For July stays, consider implementing length-of-stay discounts or slightly higher rates for bookings made less than 97 days out to capitalize on advance planning.
- Target marketing efforts for the Summer season well in advance (at least 90 days) to capture early planners.
- Monitor your own booking lead times against these Bloomfield averages to identify opportunities for dynamic pricing adjustments.
Popular & Essential Airbnb Amenities in Bloomfield (2025)
Amenity Prevalence
Amenity Insights for Bloomfield
- Essential amenities in Bloomfield that guests expect include: Smoke alarm, Wifi, Carbon monoxide alarm, Free parking on premises, Air conditioning, Hot water, Heating. Lacking these (any) could significantly impact bookings.
- Popular amenities like TV, Essentials, Fire extinguisher are common but not universal. Offering these can provide a competitive edge.
Recommendations for Hosts
- Ensure your listing includes all essential amenities for Bloomfield: Smoke alarm, Wifi, Carbon monoxide alarm, Free parking on premises, Air conditioning, Hot water, Heating.
- Prioritize adding missing essentials: Carbon monoxide alarm, Free parking on premises, Air conditioning, Hot water, Heating.
- Consider adding popular differentiators like TV or Essentials to increase appeal.
- Highlight unique or less common amenities you offer (e.g., hot tub, dedicated workspace, EV charger) in your listing description and photos.
- Regularly check competitor amenities in Bloomfield to stay competitive.
Bloomfield Airbnb Guest Demographics & Profile Analysis (2025)
Guest Profile Summary for Bloomfield
- The typical guest profile for Airbnb in Bloomfield consists of primarily domestic travelers (95%), often arriving from nearby Toronto, typically belonging to the Post-2000s (Gen Z/Alpha) group (50%), primarily speaking English or French.
- Domestic travelers account for 95.4% of guests.
- Key international markets include Canada (95.4%) and United States (1.5%).
- Top languages spoken are English (57%) followed by French (28%).
- A significant demographic segment is the Post-2000s (Gen Z/Alpha) group, representing 50% of guests.
Recommendations for Hosts
- Target domestic marketing efforts towards travelers from Toronto and Ottawa.
- Tailor amenities and listing descriptions to appeal to the dominant Post-2000s (Gen Z/Alpha) demographic (e.g., highlight fast WiFi, smart home features, local guides).
- Highlight unique local experiences or amenities relevant to the primary guest profile.
- Consider seasonal promotions aligned with peak travel times for key origin markets.
Nearby Short-Term Rental Market Comparison
How does the Bloomfield Airbnb market stack up against its neighbors? Compare key performance metrics like average monthly revenue, ADR, and occupancy rates in surrounding areas to understand the broader regional STR landscape.
| Market | Active Properties | Monthly Revenue | Daily Rate | Avg. Occupancy |
|---|---|---|---|---|
| Rushville | 13 | $6,613 | $489.17 | 50% |
| Naples | 21 | $6,262 | $553.45 | 47% |
| Town of Otisco | 19 | $5,936 | $404.67 | 44% |
| Town of Skaneateles | 62 | $5,047 | $476.41 | 46% |
| Town of Varick | 32 | $4,969 | $420.62 | 46% |
| Town of Canandaigua | 84 | $4,922 | $429.04 | 44% |
| Town of Torrey | 29 | $4,796 | $376.23 | 51% |
| Town of Mansfield | 58 | $4,670 | $517.93 | 32% |
| Town of Pulteney | 63 | $4,627 | $428.38 | 46% |
| Town of Niles | 34 | $4,449 | $670.82 | 41% |