Belleville Airbnb Market Analysis 2025: Short Term Rental Data & Vacation Rental Statistics in Ontario, Canada
Is Airbnb profitable in Belleville in 2025? Explore comprehensive Airbnb analytics for Belleville, Ontario, Canada to uncover income potential. This 2025 STR market report for Belleville, based on AirROI data from April 2024 to March 2025, reveals key trends in the niche market of 106 active listings.
Whether you're considering an Airbnb investment in Belleville, optimizing your existing vacation rental, or exploring rental arbitrage opportunities, understanding the Belleville Airbnb data is crucial. Leveraging the low regulation environment is key to maximizing your short term rental income potential. Let's dive into the specifics.
Key Belleville Airbnb Performance Metrics Overview
Monthly Airbnb Revenue Variations & Income Potential in Belleville (2025)
Understanding the monthly revenue variations for Airbnb listings in Belleville is key to maximizing your short term rental income potential. Seasonality significantly impacts earnings. Our analysis, based on data from the past 12 months, shows that the peak revenue month for STRs in Belleville is typically August, while March often presents the lowest earnings, highlighting opportunities for strategic pricing adjustments during shoulder and low seasons. Explore the typical Airbnb income in Belleville across different performance tiers:
- Best-in-class properties (Top 10%) achieve $4,902+ monthly, often utilizing dynamic pricing and superior guest experiences.
- Strong performing properties (Top 25%) earn $3,108 or more, indicating effective management and desirable locations/amenities.
- Typical properties (Median) generate around $1,704 per month, representing the average market performance.
- Entry-level properties (Bottom 25%) see earnings around $885, often with potential for optimization.
Average Monthly Airbnb Earnings Trend in Belleville
Belleville Airbnb Occupancy Rate Trends (2025)
Maximize your bookings by understanding the Belleville STR occupancy trends. Seasonal demand shifts significantly influence how often properties are booked. Typically, Augustsees the highest demand (peak season occupancy), while March experiences the lowest (low season). Effective strategies, like adjusting minimum stays or offering promotions, can boost occupancy during slower periods. Here's how different property tiers perform in Belleville:
- Best-in-class properties (Top 10%) achieve 80%+ occupancy, indicating high desirability and potentially optimized availability.
- Strong performing properties (Top 25%) maintain 62% or higher occupancy, suggesting good market fit and guest satisfaction.
- Typical properties (Median) have an occupancy rate around 40%.
- Entry-level properties (Bottom 25%) average 20% occupancy, potentially facing higher vacancy.
Average Monthly Occupancy Rate Trend in Belleville
Average Daily Rate (ADR) Airbnb Trends in Belleville (2025)
Effective short term rental pricing strategy in Belleville involves understanding monthly ADR fluctuations. The Average Daily Rate (ADR) for Airbnb in Belleville typically peaks in July and dips lowest during February. Leveraging Airbnb dynamic pricing tools or strategies based on this seasonality can significantly boost revenue. Here's a look at the typical nightly rates achieved:
- Best-in-class properties (Top 10%) command rates of $301+ per night, often due to premium features or locations.
- Strong performing properties (Top 25%) achieve nightly rates of $199 or more.
- Typical properties (Median) charge around $117 per night.
- Entry-level properties (Bottom 25%) earn around $80 per night.
Average Daily Rate (ADR) Trend by Month in Belleville
Get Live Belleville Market Intelligence 👇

Explore Real-time Analytics
Airbnb Seasonality Analysis & Trends in Belleville (2025)
Peak Season (August, July, June)
- Revenue averages $3,592 per month
- Occupancy rates average 55.9%
- Daily rates average $183
Shoulder Season
- Revenue averages $2,302 per month
- Occupancy maintains around 39.5%
- Daily rates hold near $174
Low Season (January, February, March)
- Revenue drops to average $1,257 per month
- Occupancy decreases to average 35.0%
- Daily rates adjust to average $159
Seasonality Insights for Belleville
- The Airbnb seasonality in Belleville shows highly seasonal trends requiring careful strategy. While the sections above show seasonal averages, it's also insightful to look at the extremes:
- During the high season, the absolute peak month showcases Belleville's highest earning potential, with monthly revenues capable of climbing to $3,744, occupancy reaching a high of 63.8%, and ADRs peaking at $184.
- Conversely, the slowest single month of the year, typically falling within the low season, marks the market's lowest point. In this month, revenue might dip to $1,045, occupancy could drop to 30.7%, and ADRs may adjust down to $157.
- Understanding both the seasonal averages and these monthly peaks and troughs in revenue, occupancy, and ADR is crucial for maximizing your Airbnb profit potential in Belleville.
Seasonal Strategies for Maximizing Profit
- Peak Season: Maximize revenue through premium pricing and potentially longer minimum stays. Ensure high availability.
- Low Season: Offer competitive pricing, special promotions (e.g., extended stay discounts), and flexible cancellation policies. Target off-season travelers like remote workers or budget-conscious guests.
- Shoulder Seasons: Implement dynamic pricing that balances peak and low rates. Target weekend travelers or specific events. Offer slightly more flexible terms than peak season.
- Regularly analyze your own performance against these Belleville seasonality benchmarks and adjust your pricing and availability strategy accordingly.
Best Areas for Airbnb Investment in Belleville (2025)
Exploring the top neighborhoods for short-term rentals in Belleville? This section highlights key areas, outlining why they are attractive for hosts and guests, along with notable local attractions. Consider these locations based on your target guest profile and investment strategy.
| Neighborhood / Area | Why Host Here? (Target Guests & Appeal) | Key Attractions & Landmarks |
|---|---|---|
| Downtown Belleville | The vibrant center of Belleville, offering a mix of shopping, dining, and cultural attractions. It's perfect for visitors who want to experience local life and enjoy easy access to the city's amenities. | Belleville Waterfront Trail, Empire Theatre, Belleville City Hall, Local coffee shops and eateries, Bayshore Park |
| East Hill | A picturesque neighborhood known for its historic homes and tree-lined streets. It attracts families and tourists looking for a quaint and quiet area close to parks and recreational activities. | Belleville Park, Jane Forrester Park, East Hill Community Centre, Local boutiques, Nearby schools and education facilities |
| Thurlow | A suburban area that offers a mix of residential and commercial spaces, ideal for families and those looking for a peaceful stay while being close to Belleville's attractions and services. | Quinte Mall, Bobolink Park, Local supermarkets and shops, Community centers, Close to major highways for easy access |
| West Zorrah | This area is known for its proximity to both the waterfront and natural parks, making it attractive for nature lovers and outdoor enthusiasts who enjoy hiking and biking paths. | Zorrah Wetlands, Cardinal Woods Park, Clyde Street Boat Launch, Nearby conservation areas, Various outdoor recreational activities |
| Belleville's Historic District | Offering a glimpse into Belleville's past with charming architecture and heritage sites. It is a draw for tourists interested in history and culture, enhancing the appeal for visitors. | Glanmore National Historic Site, Belleville Public Library, Historical walking tours, Local art galleries, Heritage themed events |
| Bay Bridge | A growing area with new developments and access to the Bay Bridge which connects to other parts of Ontario. Attractive for travelers looking for modern accommodations with great connectivity. | Bay Bridge Marketplace, Local parks, New dining options and retailers, Proximity to Lake Ontario, Convenient transit options |
| Quinte West | Just outside Belleville, this area offers natural beauty, and outdoor activities, making it appealing for tourists looking for adventures while still being near Belleville. | Stoco Lake, Trenton Greenbelt Trail, Local campgrounds, Fishing and boating activities, Nearby winery tours |
| Pine Street | An up-and-coming neighborhood that is becoming popular with younger visitors and those looking for a trendy, artsy vibe with local crafts and artisanal markets. | Local artisan shops, Farmers' market, Cafes and eateries, Cultural festivals, Community art events |
Understanding Airbnb License Requirements & STR Laws in Belleville (2025)
While Belleville, Ontario, Canada currently shows low STR regulations, specific Airbnb license requirements might still exist or change. Always verify the latest short term rental regulations and Airbnb license requirements directly with local government authorities for Belleville to ensure full compliance before hosting.
(Source: AirROI data, 2025, based on 1% licensed listings)
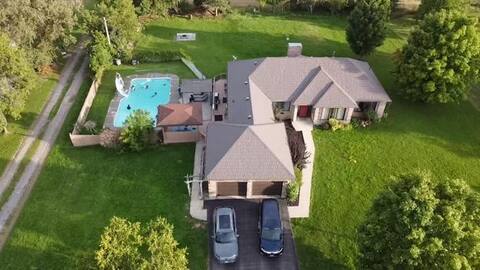
Top Performing Airbnb Properties in Belleville (2025)
Benchmark your potential! Explore examples of top-performing Airbnb properties in Bellevillebased on Trailing Twelve Month (TTM) revenue. Analyze their characteristics, revenue, occupancy rate, and ADR to understand what drives success in this market.
The Wallace House | 20 Person Accommodation
Entire Place • 9 bedrooms
The Carter House | 16 Person Luxury Accommodation
Entire Place • 8 bedrooms
Luxury Hillside Farmhouse on The Bay of Quinte
Entire Place • 5 bedrooms

Cozy & Comfortable 4BD in the Heart of Belleville
Entire Place • 4 bedrooms
The Loft on St. Paul
Entire Place • 2 bedrooms
country living House
Entire Place • 5 bedrooms
Note: Performance varies based on location, size, amenities, seasonality, and management quality. Data reflects the past 12 months.
Top Performing Airbnb Hosts in Belleville (2025)
Learn from the best! This table showcases top-performing Airbnb hosts in Belleville based on the number of properties managed and estimated total revenue over the past year. Analyze their scale and performance metrics.
| Host Name | Properties | Grossing Revenue | Stay Reviews | Avg Rating |
|---|---|---|---|---|
| Cale | 3 | $265,059 | 14 | 5.00/5.0 |
| Tim | 5 | $128,966 | 648 | 4.90/5.0 |
| Sharon | 4 | $106,119 | 233 | 4.92/5.0 |
| Ribhu | 3 | $90,194 | 88 | 4.86/5.0 |
| Kim | 2 | $74,614 | 51 | 5.00/5.0 |
| Trevor | 1 | $67,449 | 33 | 4.55/5.0 |
| Vranic | 3 | $66,853 | 312 | 4.93/5.0 |
| Jasmin | 1 | $59,539 | 110 | 4.87/5.0 |
| Andjela | 3 | $55,636 | 175 | 4.88/5.0 |
| Mehala | 1 | $50,049 | 12 | 3.83/5.0 |
Analyzing the strategies of top hosts, such as their property selection, pricing, and guest communication, can offer valuable lessons for optimizing your own Airbnb operations in Belleville.
Dive Deeper: Advanced Belleville STR Market Data (2025)
Ready to unlock more insights? AirROI provides access to advanced metrics and comprehensive Airbnb data for Belleville. Explore detailed analytics beyond this report to refine your investment strategy, optimize pricing, and maximize your vacation rental profits.
Explore Advanced MetricsBelleville Short-Term Rental Market Composition (2025): Property & Room Types
Room Type Distribution
Property Type Distribution
Market Composition Insights for Belleville
- The Belleville Airbnb market composition is heavily skewed towards Entire Home/Apt listings, which make up 84% of the 106 active rentals. This indicates strong guest preference for privacy and space.
- Looking at the property type distribution in Belleville, House properties are the most common (59.4%), reflecting the local real estate landscape.
- Houses represent a significant 59.4% portion, catering likely to families or larger groups.
- Smaller segments like hotel/boutique (combined 2.8%) offer potential for unique stay experiences.
Belleville Airbnb Room Capacity Analysis (2025): Bedroom Distribution
Distribution of Listings by Number of Bedrooms
Room Capacity Insights for Belleville
- The dominant room capacity in Belleville is 1 bedroom listings, making up 27.4% of the market. This suggests a strong demand for properties suitable for couples or solo travelers.
- Together, 1 bedroom and 2 bedrooms properties represent 51.0% of the active Airbnb listings in Belleville, indicating a high concentration in these sizes.
- A significant 32.1% of listings offer 3+ bedrooms, catering to larger groups and families seeking more space in Belleville.
Belleville Vacation Rental Guest Capacity Trends (2025)
Distribution of Listings by Guest Capacity
Guest Capacity Insights for Belleville
- The most common guest capacity trend in Belleville vacation rentals is listings accommodating 2 guests (23.6%). This suggests the primary traveler segment is likely couples or solo travelers.
- Properties designed for 2 guests and 4 guests dominate the Belleville STR market, accounting for 46.2% of listings.
- 35.9% of properties accommodate 6+ guests, serving the market segment for larger families or group travel in Belleville.
- On average, properties in Belleville are equipped to host 4.0 guests.
Belleville Airbnb Booking Patterns (2025): Available vs. Booked Days
Available Days Distribution
Booked Days Distribution
Booking Pattern Insights for Belleville
- The most common availability pattern in Belleville falls within the 181-270 days range, representing 38.7% of listings. This suggests many properties have significant open periods on their calendars.
- Approximately 75.5% of listings show high availability (181+ days open annually), indicating potential for increased bookings or specific owner usage patterns.
- For booked days, the 91-180 days range is most frequent in Belleville (37.7%), reflecting common guest stay durations or potential owner blocking patterns.
- A notable 28.3% of properties secure long booking periods (181+ days booked per year), highlighting successful long-term rental strategies or significant owner usage.
Belleville Airbnb Minimum Stay Requirements Analysis
Distribution of Listings by Minimum Night Requirement
1 Night
34 listings
37% of total
2 Nights
42 listings
45.7% of total
3 Nights
3 listings
3.3% of total
4-6 Nights
2 listings
2.2% of total
7-29 Nights
4 listings
4.3% of total
30+ Nights
7 listings
7.6% of total
Key Insights
- The most prevalent minimum stay requirement in Belleville is 2 Nights, adopted by 45.7% of listings. This highlights the market's preference for shorter, flexible bookings.
- A strong majority (82.7%) of the Belleville Airbnb data shows acceptance of very short stays (1-2 nights), indicating a dynamic, high-turnover market.
Recommendations
- Align with the market by considering a 2 Nights minimum stay, as 45.7% of Belleville hosts use this setting.
- Explore offering discounts for stays of 30+ nights to attract the 7.6% of the market seeking extended stays.
- Adjust minimum nights based on seasonality – potentially shorter during low season and longer during peak demand periods in Belleville.
Belleville Airbnb Cancellation Policy Trends Analysis (2025)
Super Strict 30 Days
1 listings
1.1% of total
Flexible
17 listings
18.3% of total
Moderate
35 listings
37.6% of total
Firm
18 listings
19.4% of total
Strict
22 listings
23.7% of total
Cancellation Policy Insights for Belleville
- The prevailing Airbnb cancellation policy trend in Belleville is Moderate, used by 37.6% of listings.
- There's a relatively balanced mix between guest-friendly (55.9%) and stricter (43.1%) policies, offering choices for different guest needs.
Recommendations for Hosts
- Consider adopting a Moderate policy to align with the 37.6% market standard in Belleville.
- Regularly review your cancellation policy against competitors and market demand shifts in Belleville.
Belleville STR Booking Lead Time Analysis (2025)
Average Booking Lead Time by Month
Booking Lead Time Insights for Belleville
- The overall average booking lead time for vacation rentals in Belleville is 45 days.
- Guests book furthest in advance for stays during July (average 67 days), likely coinciding with peak travel demand or local events.
- The shortest booking windows occur for stays in March (average 17 days), indicating more last-minute travel plans during this time.
- Seasonally, Summer (62 days avg.) sees the longest lead times, while Winter (29 days avg.) has the shortest, reflecting typical travel planning cycles.
Recommendations for Hosts
- Use the overall average lead time (45 days) as a baseline for your pricing and availability strategy in Belleville.
- For July stays, consider implementing length-of-stay discounts or slightly higher rates for bookings made less than 67 days out to capitalize on advance planning.
- Target marketing efforts for the Summer season well in advance (at least 62 days) to capture early planners.
- Monitor your own booking lead times against these Belleville averages to identify opportunities for dynamic pricing adjustments.
Popular & Essential Airbnb Amenities in Belleville (2025)
Amenity Prevalence
Amenity Insights for Belleville
- Essential amenities in Belleville that guests expect include: Free parking on premises, Air conditioning, Carbon monoxide alarm, Wifi, Heating, Smoke alarm. Lacking these (any) could significantly impact bookings.
- Popular amenities like Essentials, Hot water, TV are common but not universal. Offering these can provide a competitive edge.
Recommendations for Hosts
- Ensure your listing includes all essential amenities for Belleville: Free parking on premises, Air conditioning, Carbon monoxide alarm, Wifi, Heating, Smoke alarm.
- Prioritize adding missing essentials: Air conditioning, Carbon monoxide alarm, Wifi, Heating, Smoke alarm.
- Consider adding popular differentiators like Essentials or Hot water to increase appeal.
- Highlight unique or less common amenities you offer (e.g., hot tub, dedicated workspace, EV charger) in your listing description and photos.
- Regularly check competitor amenities in Belleville to stay competitive.
Belleville Airbnb Guest Demographics & Profile Analysis (2025)
Guest Profile Summary for Belleville
- The typical guest profile for Airbnb in Belleville consists of primarily domestic travelers (89%), often arriving from nearby Toronto, typically belonging to the Post-2000s (Gen Z/Alpha) group (50%), primarily speaking English or French.
- Domestic travelers account for 88.5% of guests.
- Key international markets include Canada (88.5%) and United States (3.9%).
- Top languages spoken are English (57.3%) followed by French (20.6%).
- A significant demographic segment is the Post-2000s (Gen Z/Alpha) group, representing 50% of guests.
Recommendations for Hosts
- Target domestic marketing efforts towards travelers from Toronto and Montreal.
- Tailor amenities and listing descriptions to appeal to the dominant Post-2000s (Gen Z/Alpha) demographic (e.g., highlight fast WiFi, smart home features, local guides).
- Highlight unique local experiences or amenities relevant to the primary guest profile.
- Consider seasonal promotions aligned with peak travel times for key origin markets.
Nearby Short-Term Rental Market Comparison
How does the Belleville Airbnb market stack up against its neighbors? Compare key performance metrics like average monthly revenue, ADR, and occupancy rates in surrounding areas to understand the broader regional STR landscape.
| Market | Active Properties | Monthly Revenue | Daily Rate | Avg. Occupancy |
|---|---|---|---|---|
| Town of Porter | 25 | $4,243 | $300.26 | 55% |
| Carrying Place | 20 | $3,737 | $315.96 | 48% |
| Town of Pittsford | 53 | $3,628 | $410.81 | 43% |
| Town of Cicero | 33 | $3,611 | $238.12 | 54% |
| Rossmore | 10 | $3,345 | $268.20 | 56% |
| Town of Wilson | 27 | $3,195 | $257.32 | 48% |
| Town of Lyme | 29 | $3,140 | $268.25 | 46% |
| Consecon | 26 | $3,124 | $299.57 | 43% |
| Village of Fairport | 25 | $3,068 | $216.06 | 54% |
| Dysart et al | 264 | $3,046 | $310.03 | 42% |