Amherstburg Airbnb Market Analysis 2025: Short Term Rental Data & Vacation Rental Statistics in Ontario, Canada
Is Airbnb profitable in Amherstburg in 2025? Explore comprehensive Airbnb analytics for Amherstburg, Ontario, Canada to uncover income potential. This 2025 STR market report for Amherstburg, based on AirROI data from April 2024 to March 2025, reveals key trends in the niche market of 58 active listings.
Whether you're considering an Airbnb investment in Amherstburg, optimizing your existing vacation rental, or exploring rental arbitrage opportunities, understanding the Amherstburg Airbnb data is crucial. Leveraging the low regulation environment is key to maximizing your short term rental income potential. Let's dive into the specifics.
Key Amherstburg Airbnb Performance Metrics Overview
Monthly Airbnb Revenue Variations & Income Potential in Amherstburg (2025)
Understanding the monthly revenue variations for Airbnb listings in Amherstburg is key to maximizing your short term rental income potential. Seasonality significantly impacts earnings. Our analysis, based on data from the past 12 months, shows that the peak revenue month for STRs in Amherstburg is typically July, while February often presents the lowest earnings, highlighting opportunities for strategic pricing adjustments during shoulder and low seasons. Explore the typical Airbnb income in Amherstburg across different performance tiers:
- Best-in-class properties (Top 10%) achieve $5,418+ monthly, often utilizing dynamic pricing and superior guest experiences.
- Strong performing properties (Top 25%) earn $3,987 or more, indicating effective management and desirable locations/amenities.
- Typical properties (Median) generate around $2,317 per month, representing the average market performance.
- Entry-level properties (Bottom 25%) see earnings around $945, often with potential for optimization.
Average Monthly Airbnb Earnings Trend in Amherstburg
Amherstburg Airbnb Occupancy Rate Trends (2025)
Maximize your bookings by understanding the Amherstburg STR occupancy trends. Seasonal demand shifts significantly influence how often properties are booked. Typically, Julysees the highest demand (peak season occupancy), while January experiences the lowest (low season). Effective strategies, like adjusting minimum stays or offering promotions, can boost occupancy during slower periods. Here's how different property tiers perform in Amherstburg:
- Best-in-class properties (Top 10%) achieve 78%+ occupancy, indicating high desirability and potentially optimized availability.
- Strong performing properties (Top 25%) maintain 65% or higher occupancy, suggesting good market fit and guest satisfaction.
- Typical properties (Median) have an occupancy rate around 40%.
- Entry-level properties (Bottom 25%) average 18% occupancy, potentially facing higher vacancy.
Average Monthly Occupancy Rate Trend in Amherstburg
Average Daily Rate (ADR) Airbnb Trends in Amherstburg (2025)
Effective short term rental pricing strategy in Amherstburg involves understanding monthly ADR fluctuations. The Average Daily Rate (ADR) for Airbnb in Amherstburg typically peaks in July and dips lowest during March. Leveraging Airbnb dynamic pricing tools or strategies based on this seasonality can significantly boost revenue. Here's a look at the typical nightly rates achieved:
- Best-in-class properties (Top 10%) command rates of $264+ per night, often due to premium features or locations.
- Strong performing properties (Top 25%) achieve nightly rates of $226 or more.
- Typical properties (Median) charge around $158 per night.
- Entry-level properties (Bottom 25%) earn around $120 per night.
Average Daily Rate (ADR) Trend by Month in Amherstburg
Get Live Amherstburg Market Intelligence 👇

Explore Real-time Analytics
Airbnb Seasonality Analysis & Trends in Amherstburg (2025)
Peak Season (July, August, June)
- Revenue averages $3,945 per month
- Occupancy rates average 54.7%
- Daily rates average $180
Shoulder Season
- Revenue averages $2,689 per month
- Occupancy maintains around 41.3%
- Daily rates hold near $174
Low Season (January, February, March)
- Revenue drops to average $1,605 per month
- Occupancy decreases to average 32.3%
- Daily rates adjust to average $166
Seasonality Insights for Amherstburg
- The Airbnb seasonality in Amherstburg shows highly seasonal trends requiring careful strategy. While the sections above show seasonal averages, it's also insightful to look at the extremes:
- During the high season, the absolute peak month showcases Amherstburg's highest earning potential, with monthly revenues capable of climbing to $4,116, occupancy reaching a high of 61.4%, and ADRs peaking at $180.
- Conversely, the slowest single month of the year, typically falling within the low season, marks the market's lowest point. In this month, revenue might dip to $1,541, occupancy could drop to 29.7%, and ADRs may adjust down to $164.
- Understanding both the seasonal averages and these monthly peaks and troughs in revenue, occupancy, and ADR is crucial for maximizing your Airbnb profit potential in Amherstburg.
Seasonal Strategies for Maximizing Profit
- Peak Season: Maximize revenue through premium pricing and potentially longer minimum stays. Ensure high availability.
- Low Season: Offer competitive pricing, special promotions (e.g., extended stay discounts), and flexible cancellation policies. Target off-season travelers like remote workers or budget-conscious guests.
- Shoulder Seasons: Implement dynamic pricing that balances peak and low rates. Target weekend travelers or specific events. Offer slightly more flexible terms than peak season.
- Regularly analyze your own performance against these Amherstburg seasonality benchmarks and adjust your pricing and availability strategy accordingly.
Best Areas for Airbnb Investment in Amherstburg (2025)
Exploring the top neighborhoods for short-term rentals in Amherstburg? This section highlights key areas, outlining why they are attractive for hosts and guests, along with notable local attractions. Consider these locations based on your target guest profile and investment strategy.
| Neighborhood / Area | Why Host Here? (Target Guests & Appeal) | Key Attractions & Landmarks |
|---|---|---|
| Amherstburg Downtown | Historic downtown area with charming shops, restaurants, and waterfront views. It's a popular destination for tourists looking for a quaint, picturesque experience by the Detroit River. | Fort Malden National Historic Site, Amherstburg Navy Yard National Historic Site, Kings Navy Yard Park, local boutiques, riverfront walking trails |
| Belle Vue Park | A scenic park with beautiful views of the Detroit River, perfect for outdoor enthusiasts and families. Provides easy access to nature and community events throughout the year. | Belle Vue Park, waterfront trails, picnic areas, outdoor sports facilities |
| Holiday Beach | Known for its beach and natural beauty, this area attracts visitors looking for outdoor activities such as swimming, sunbathing, and bird watching, making it a popular summer destination. | Holiday Beach Conservation Area, swimming, nature trails, bird watching |
| Gibbard's Garden | A serene residential area known for its beautiful gardens and proximity to the waterways. Ideal for visitors seeking a quiet retreat and nature experience while still being close to the town. | private gardens, river access, walking paths |
| Point Pelee National Park (nearby) | While a bit outside Amherstburg, this national park is renowned for its biodiversity and attracts nature lovers and tourists. It's the perfect day trip for those staying in Amherstburg. | Point Pelee beaches, hiking trails, bird migrations, boating opportunities |
| Historic Fort Malden | A key historical site that attracts history buffs and tourists interested in Canadian military history, making it a great cultural attraction. | Fort Malden Museum, historical reenactments, guided tours, educational programs |
| Riverfront Park | A beautiful park along the Detroit River providing recreational activities and scenic views. A safe and family-friendly area for visitors of all ages. | walking and biking trails, playgrounds, picnic areas, community events |
| Wine Country (nearby) | Amherstburg is close to Ontario's wine country, attracting wine tourism and events. A great location for visitors to experience local vineyards and wine tastings. | local wineries, wine tours, culinary experiences, vineyard events |
Understanding Airbnb License Requirements & STR Laws in Amherstburg (2025)
While Amherstburg, Ontario, Canada currently shows low STR regulations, specific Airbnb license requirements might still exist or change. Always verify the latest short term rental regulations and Airbnb license requirements directly with local government authorities for Amherstburg to ensure full compliance before hosting.
(Source: AirROI data, 2025, finding no licensed listings among those analyzed)
Top Performing Airbnb Properties in Amherstburg (2025)
Benchmark your potential! Explore examples of top-performing Airbnb properties in Amherstburgbased on Trailing Twelve Month (TTM) revenue. Analyze their characteristics, revenue, occupancy rate, and ADR to understand what drives success in this market.
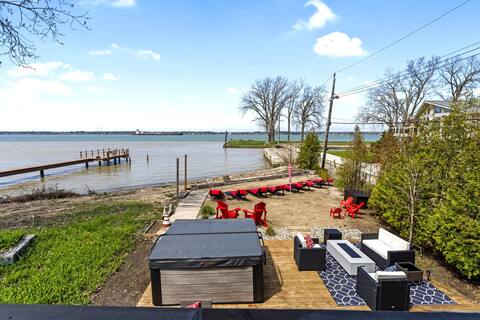
Year Round Hot Tub, The Beach House
Entire Place • 4 bedrooms

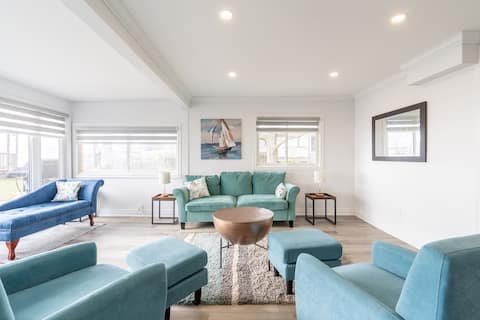
Erie View Lakehouse - Serene and Spacious
Entire Place • 4 bedrooms
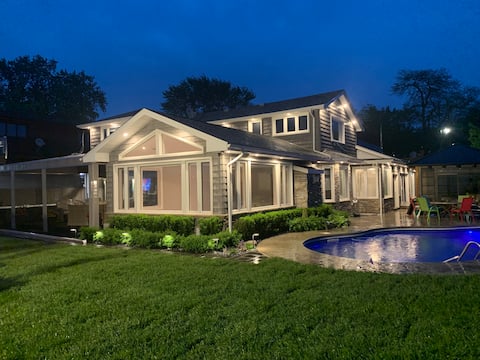
Spectacular Lakefront Cottage: 80ft Private Beach
Entire Place • 3 bedrooms
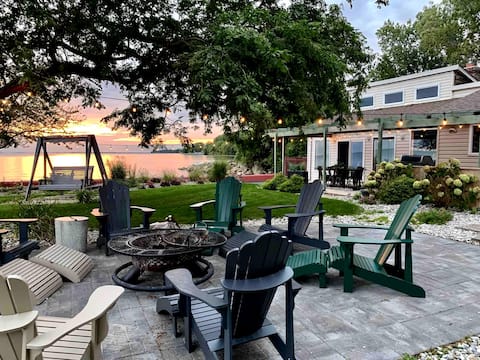
Little heaven
Entire Place • 4 bedrooms
The Lake House Ontario
Entire Place • 2 bedrooms
Luxurious stay near Windsor
Entire Place • 5 bedrooms
Note: Performance varies based on location, size, amenities, seasonality, and management quality. Data reflects the past 12 months.
Top Performing Airbnb Hosts in Amherstburg (2025)
Learn from the best! This table showcases top-performing Airbnb hosts in Amherstburg based on the number of properties managed and estimated total revenue over the past year. Analyze their scale and performance metrics.
| Host Name | Properties | Grossing Revenue | Stay Reviews | Avg Rating |
|---|---|---|---|---|
| Stanley | 1 | $84,271 | 208 | 4.99/5.0 |
| Sonia&Paul | 1 | $77,905 | 76 | 4.96/5.0 |
| Jason | 2 | $57,521 | 209 | 5.00/5.0 |
| Saquib | 1 | $57,477 | 50 | 4.68/5.0 |
| Sam | 1 | $55,755 | 26 | 4.88/5.0 |
| Joan | 1 | $54,646 | 108 | 4.96/5.0 |
| Navneet | 1 | $54,608 | 68 | 4.85/5.0 |
| Katrina | 1 | $54,261 | 57 | 4.93/5.0 |
| Luminita | 1 | $51,086 | 143 | 4.99/5.0 |
| Austin | 1 | $49,249 | 43 | 4.86/5.0 |
Analyzing the strategies of top hosts, such as their property selection, pricing, and guest communication, can offer valuable lessons for optimizing your own Airbnb operations in Amherstburg.
Dive Deeper: Advanced Amherstburg STR Market Data (2025)
Ready to unlock more insights? AirROI provides access to advanced metrics and comprehensive Airbnb data for Amherstburg. Explore detailed analytics beyond this report to refine your investment strategy, optimize pricing, and maximize your vacation rental profits.
Explore Advanced MetricsAmherstburg Short-Term Rental Market Composition (2025): Property & Room Types
Room Type Distribution
Property Type Distribution
Market Composition Insights for Amherstburg
- The Amherstburg Airbnb market composition is heavily skewed towards Entire Home/Apt listings, which make up 84.5% of the 58 active rentals. This indicates strong guest preference for privacy and space.
- Looking at the property type distribution in Amherstburg, House properties are the most common (69%), reflecting the local real estate landscape.
- Houses represent a significant 69% portion, catering likely to families or larger groups.
- The presence of 15.5% Hotel/Boutique listings indicates integration with traditional hospitality.
- Smaller segments like others (combined 3.4%) offer potential for unique stay experiences.
Amherstburg Airbnb Room Capacity Analysis (2025): Bedroom Distribution
Distribution of Listings by Number of Bedrooms
Room Capacity Insights for Amherstburg
- The dominant room capacity in Amherstburg is 1 bedroom listings, making up 29.3% of the market. This suggests a strong demand for properties suitable for couples or solo travelers.
- Together, 1 bedroom and 3 bedrooms properties represent 58.6% of the active Airbnb listings in Amherstburg, indicating a high concentration in these sizes.
- A significant 44.8% of listings offer 3+ bedrooms, catering to larger groups and families seeking more space in Amherstburg.
Amherstburg Vacation Rental Guest Capacity Trends (2025)
Distribution of Listings by Guest Capacity
Guest Capacity Insights for Amherstburg
- The most common guest capacity trend in Amherstburg vacation rentals is listings accommodating 6 guests (25.9%). This suggests the primary traveler segment is likely larger groups.
- Properties designed for 6 guests and 8+ guests dominate the Amherstburg STR market, accounting for 50.0% of listings.
- 53.4% of properties accommodate 6+ guests, serving the market segment for larger families or group travel in Amherstburg.
- On average, properties in Amherstburg are equipped to host 5.3 guests.
Amherstburg Airbnb Booking Patterns (2025): Available vs. Booked Days
Available Days Distribution
Booked Days Distribution
Booking Pattern Insights for Amherstburg
- The most common availability pattern in Amherstburg falls within the 181-270 days range, representing 37.9% of listings. This suggests many properties have significant open periods on their calendars.
- Approximately 70.7% of listings show high availability (181+ days open annually), indicating potential for increased bookings or specific owner usage patterns.
- For booked days, the 91-180 days range is most frequent in Amherstburg (36.2%), reflecting common guest stay durations or potential owner blocking patterns.
- A notable 32.7% of properties secure long booking periods (181+ days booked per year), highlighting successful long-term rental strategies or significant owner usage.
Amherstburg Airbnb Minimum Stay Requirements Analysis
Distribution of Listings by Minimum Night Requirement
1 Night
18 listings
33.3% of total
2 Nights
27 listings
50% of total
3 Nights
4 listings
7.4% of total
4-6 Nights
1 listings
1.9% of total
7-29 Nights
1 listings
1.9% of total
30+ Nights
3 listings
5.6% of total
Key Insights
- The most prevalent minimum stay requirement in Amherstburg is 2 Nights, adopted by 50% of listings. This highlights the market's preference for shorter, flexible bookings.
- A strong majority (83.3%) of the Amherstburg Airbnb data shows acceptance of very short stays (1-2 nights), indicating a dynamic, high-turnover market.
Recommendations
- Align with the market by considering a 2 Nights minimum stay, as 50% of Amherstburg hosts use this setting.
- Explore offering discounts for stays of 30+ nights to attract the 5.6% of the market seeking extended stays.
- Adjust minimum nights based on seasonality – potentially shorter during low season and longer during peak demand periods in Amherstburg.
Amherstburg Airbnb Cancellation Policy Trends Analysis (2025)
Flexible
10 listings
18.5% of total
Moderate
12 listings
22.2% of total
Firm
10 listings
18.5% of total
Strict
22 listings
40.7% of total
Cancellation Policy Insights for Amherstburg
- The prevailing Airbnb cancellation policy trend in Amherstburg is Strict, used by 40.7% of listings.
- A majority (59.2%) of hosts in Amherstburg utilize Firm or Strict policies, indicating a market where hosts prioritize booking security.
Recommendations for Hosts
- Consider adopting a Strict policy to align with the 40.7% market standard in Amherstburg.
- With 40.7% using Strict terms, this is a viable option in Amherstburg, particularly for high-value properties or during peak demand periods.
- Regularly review your cancellation policy against competitors and market demand shifts in Amherstburg.
Amherstburg STR Booking Lead Time Analysis (2025)
Average Booking Lead Time by Month
Booking Lead Time Insights for Amherstburg
- The overall average booking lead time for vacation rentals in Amherstburg is 51 days.
- Guests book furthest in advance for stays during June (average 83 days), likely coinciding with peak travel demand or local events.
- The shortest booking windows occur for stays in March (average 16 days), indicating more last-minute travel plans during this time.
- Seasonally, Summer (76 days avg.) sees the longest lead times, while Winter (41 days avg.) has the shortest, reflecting typical travel planning cycles.
Recommendations for Hosts
- Use the overall average lead time (51 days) as a baseline for your pricing and availability strategy in Amherstburg.
- For June stays, consider implementing length-of-stay discounts or slightly higher rates for bookings made less than 83 days out to capitalize on advance planning.
- Target marketing efforts for the Summer season well in advance (at least 76 days) to capture early planners.
- Monitor your own booking lead times against these Amherstburg averages to identify opportunities for dynamic pricing adjustments.
Popular & Essential Airbnb Amenities in Amherstburg (2025)
Amenity Prevalence
Amenity Insights for Amherstburg
- Essential amenities in Amherstburg that guests expect include: Air conditioning, TV, Smoke alarm, Carbon monoxide alarm, Wifi, Heating, Hot water. Lacking these (any) could significantly impact bookings.
- Popular amenities like Free parking on premises, Coffee maker, Hangers are common but not universal. Offering these can provide a competitive edge.
Recommendations for Hosts
- Ensure your listing includes all essential amenities for Amherstburg: Air conditioning, TV, Smoke alarm, Carbon monoxide alarm, Wifi, Heating, Hot water.
- Prioritize adding missing essentials: Heating, Hot water.
- Consider adding popular differentiators like Free parking on premises or Coffee maker to increase appeal.
- Highlight unique or less common amenities you offer (e.g., hot tub, dedicated workspace, EV charger) in your listing description and photos.
- Regularly check competitor amenities in Amherstburg to stay competitive.
Amherstburg Airbnb Guest Demographics & Profile Analysis (2025)
Guest Profile Summary for Amherstburg
- The typical guest profile for Airbnb in Amherstburg consists of a mix of domestic (62%) and international guests, often arriving from nearby Toronto, typically belonging to the Post-2000s (Gen Z/Alpha) group (50%), primarily speaking English or French.
- Domestic travelers account for 61.5% of guests.
- Key international markets include Canada (61.5%) and United States (36.5%).
- Top languages spoken are English (74.3%) followed by French (5.5%).
- A significant demographic segment is the Post-2000s (Gen Z/Alpha) group, representing 50% of guests.
Recommendations for Hosts
- Target domestic marketing efforts towards travelers from Toronto and Windsor.
- Tailor amenities and listing descriptions to appeal to the dominant Post-2000s (Gen Z/Alpha) demographic (e.g., highlight fast WiFi, smart home features, local guides).
- Highlight unique local experiences or amenities relevant to the primary guest profile.
- Consider seasonal promotions aligned with peak travel times for key origin markets.
Nearby Short-Term Rental Market Comparison
How does the Amherstburg Airbnb market stack up against its neighbors? Compare key performance metrics like average monthly revenue, ADR, and occupancy rates in surrounding areas to understand the broader regional STR landscape.
| Market | Active Properties | Monthly Revenue | Daily Rate | Avg. Occupancy |
|---|---|---|---|---|
| Huron Township | 16 | $5,955 | $423.08 | 44% |
| Forester | 11 | $5,685 | $390.48 | 43% |
| City of Frankenmuth | 29 | $5,143 | $304.06 | 54% |
| Ann Arbor | 487 | $4,539 | $424.08 | 48% |
| Hamburg Township | 36 | $4,279 | $397.92 | 44% |
| Grass Lake Charter Township | 16 | $4,168 | $321.84 | 45% |
| White Lake Charter Township | 27 | $4,025 | $328.99 | 46% |
| Erie Township | 10 | $3,907 | $209.82 | 56% |
| Huron | 122 | $3,867 | $338.59 | 41% |
| Pittsfield Charter Township | 39 | $3,862 | $332.88 | 45% |