(Old) Ottawa Airbnb Market Analysis 2025: Short Term Rental Data & Vacation Rental Statistics in Ontario, Canada
Is Airbnb profitable in (Old) Ottawa in 2025? Explore comprehensive Airbnb analytics for (Old) Ottawa, Ontario, Canada to uncover income potential. This 2025 STR market report for (Old) Ottawa, based on AirROI data from April 2024 to March 2025, reveals key trends in the niche market of 90 active listings.
Whether you're considering an Airbnb investment in (Old) Ottawa, optimizing your existing vacation rental, or exploring rental arbitrage opportunities, understanding the (Old) Ottawa Airbnb data is crucial. Navigating the high regulation landscape is key to maximizing your short term rental income potential. Let's dive into the specifics.
Key (Old) Ottawa Airbnb Performance Metrics Overview
Monthly Airbnb Revenue Variations & Income Potential in (Old) Ottawa (2025)
Understanding the monthly revenue variations for Airbnb listings in (Old) Ottawa is key to maximizing your short term rental income potential. Seasonality significantly impacts earnings. Our analysis, based on data from the past 12 months, shows that the peak revenue month for STRs in (Old) Ottawa is typically May, while January often presents the lowest earnings, highlighting opportunities for strategic pricing adjustments during shoulder and low seasons. Explore the typical Airbnb income in (Old) Ottawa across different performance tiers:
- Best-in-class properties (Top 10%) achieve $4,214+ monthly, often utilizing dynamic pricing and superior guest experiences.
- Strong performing properties (Top 25%) earn $2,416 or more, indicating effective management and desirable locations/amenities.
- Typical properties (Median) generate around $1,421 per month, representing the average market performance.
- Entry-level properties (Bottom 25%) see earnings around $662, often with potential for optimization.
Average Monthly Airbnb Earnings Trend in (Old) Ottawa
(Old) Ottawa Airbnb Occupancy Rate Trends (2025)
Maximize your bookings by understanding the (Old) Ottawa STR occupancy trends. Seasonal demand shifts significantly influence how often properties are booked. Typically, Septembersees the highest demand (peak season occupancy), while April experiences the lowest (low season). Effective strategies, like adjusting minimum stays or offering promotions, can boost occupancy during slower periods. Here's how different property tiers perform in (Old) Ottawa:
- Best-in-class properties (Top 10%) achieve 78%+ occupancy, indicating high desirability and potentially optimized availability.
- Strong performing properties (Top 25%) maintain 58% or higher occupancy, suggesting good market fit and guest satisfaction.
- Typical properties (Median) have an occupancy rate around 36%.
- Entry-level properties (Bottom 25%) average 17% occupancy, potentially facing higher vacancy.
Average Monthly Occupancy Rate Trend in (Old) Ottawa
Average Daily Rate (ADR) Airbnb Trends in (Old) Ottawa (2025)
Effective short term rental pricing strategy in (Old) Ottawa involves understanding monthly ADR fluctuations. The Average Daily Rate (ADR) for Airbnb in (Old) Ottawa typically peaks in June and dips lowest during January. Leveraging Airbnb dynamic pricing tools or strategies based on this seasonality can significantly boost revenue. Here's a look at the typical nightly rates achieved:
- Best-in-class properties (Top 10%) command rates of $203+ per night, often due to premium features or locations.
- Strong performing properties (Top 25%) achieve nightly rates of $153 or more.
- Typical properties (Median) charge around $108 per night.
- Entry-level properties (Bottom 25%) earn around $76 per night.
Average Daily Rate (ADR) Trend by Month in (Old) Ottawa
Get Live (Old) Ottawa Market Intelligence 👇
 Ottawa.png)
Explore Real-time Analytics
Airbnb Seasonality Analysis & Trends in (Old) Ottawa (2025)
Peak Season (May, June, April)
- Revenue averages $2,476 per month
- Occupancy rates average 37.4%
- Daily rates average $135
Shoulder Season
- Revenue averages $1,847 per month
- Occupancy maintains around 43.4%
- Daily rates hold near $130
Low Season (January, February, March)
- Revenue drops to average $1,318 per month
- Occupancy decreases to average 33.4%
- Daily rates adjust to average $115
Seasonality Insights for (Old) Ottawa
- The Airbnb seasonality in (Old) Ottawa shows highly seasonal trends requiring careful strategy. While the sections above show seasonal averages, it's also insightful to look at the extremes:
- During the high season, the absolute peak month showcases (Old) Ottawa's highest earning potential, with monthly revenues capable of climbing to $2,712, occupancy reaching a high of 49.0%, and ADRs peaking at $138.
- Conversely, the slowest single month of the year, typically falling within the low season, marks the market's lowest point. In this month, revenue might dip to $1,289, occupancy could drop to 29.8%, and ADRs may adjust down to $114.
- Understanding both the seasonal averages and these monthly peaks and troughs in revenue, occupancy, and ADR is crucial for maximizing your Airbnb profit potential in (Old) Ottawa.
Seasonal Strategies for Maximizing Profit
- Peak Season: Maximize revenue through premium pricing and potentially longer minimum stays. Ensure high availability.
- Low Season: Offer competitive pricing, special promotions (e.g., extended stay discounts), and flexible cancellation policies. Target off-season travelers like remote workers or budget-conscious guests.
- Shoulder Seasons: Implement dynamic pricing that balances peak and low rates. Target weekend travelers or specific events. Offer slightly more flexible terms than peak season.
- Regularly analyze your own performance against these (Old) Ottawa seasonality benchmarks and adjust your pricing and availability strategy accordingly.
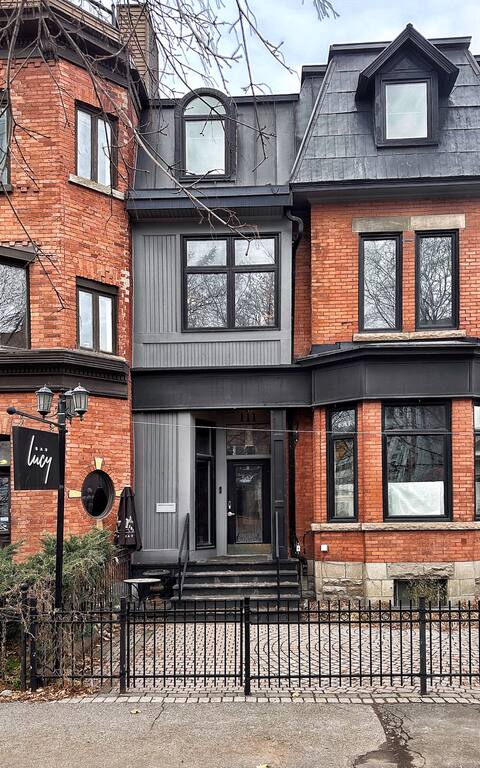
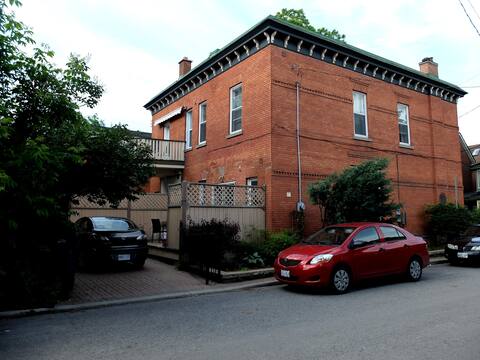
Best Areas for Airbnb Investment in (Old) Ottawa (2025)
Exploring the top neighborhoods for short-term rentals in (Old) Ottawa? This section highlights key areas, outlining why they are attractive for hosts and guests, along with notable local attractions. Consider these locations based on your target guest profile and investment strategy.
| Neighborhood / Area | Why Host Here? (Target Guests & Appeal) | Key Attractions & Landmarks |
|---|---|---|
| ByWard Market | A vibrant historic neighborhood known for its farmers' market, boutiques, and dining options. Popular with tourists and locals alike, making it a prime location for short-term rentals. | ByWard Market Square, National Gallery of Canada, Rideau Centre, Sparks Street, Canadian Museum of History |
| Downtown Ottawa | The heart of the city, featuring a mix of business and leisure activities. Close to many attractions, government buildings, and cultural institutions, appealing to both tourists and professionals. | Parliament Hill, Canadian War Museum, National Arts Centre, Confederation Park, Rideau Canal |
| The Glebe | A charming residential neighborhood with a rich history and a variety of local shops, restaurants, and parks. Attracts families and visitors looking for a more laid-back atmosphere close to downtown. | Lansdowne Park, Glebe Farmers' Market, Bank Street shops, Central Park, Carleton University |
| Hintonburg | An up-and-coming artsy enclave known for its unique cafes, galleries, and community vibe. Appeals to younger travelers and those looking for a hip, local experience. | Hintonburg Community Centre, Art galleries, Local coffee shops, Fairs and festivals, Wellington Street shops |
| Orleans | A suburban area with a family-friendly atmosphere offering access to parks and recreational facilities. Good for longer stays and families visiting Ottawa. | Place d'Orleans, Petrie Island, Orleans Arts Centre, Local parks, Gatineau Park nearby |
| Centretown | A diverse and dynamic neighborhood that combines residential living with commercial amenities. Close to downtown and many attractions, ideal for urban explorers. | Raonui Park, City Hall, Shaw Centre, Local restaurants and cafes, Ottawa Art Gallery |
| Westboro | A trendy neighborhood featuring boutiques, cafes, and close proximity to the Ottawa River. Attracts outdoor enthusiasts and those seeking a local feel while still being near the city. | Westboro Beach, Ottawa River Pathway, Local shops and eateries, Westboro Village, Parks |
| Kanata | A suburban area known for its family-oriented neighborhood, technology companies, and recreational spaces. Popular among business travelers and families. | Kanata Centrum, Canadian Tire Centre, Local parks, Gatineau Park, Shopping amenities |
Understanding Airbnb License Requirements & STR Laws in (Old) Ottawa (2025)
Yes, (Old) Ottawa, Ontario, Canada enforces high STR regulations. Obtaining a license and ensuring compliance is almost certainly required according to current 2025 STR laws. Always verify the latest short term rental regulations and Airbnb license requirements directly with local government authorities for (Old) Ottawa to ensure full compliance before hosting.
(Source: AirROI data, 2025, based on 62% licensed listings)
Top Performing Airbnb Properties in (Old) Ottawa (2025)
Benchmark your potential! Explore examples of top-performing Airbnb properties in (Old) Ottawabased on Trailing Twelve Month (TTM) revenue. Analyze their characteristics, revenue, occupancy rate, and ADR to understand what drives success in this market.

Sonder Rideau | Superior Two-Bedroom Apartment
Private Room • 2 bedrooms
Heritage Loft In The Heart of Downtown Ottawa
Entire Place • 3 bedrooms

Sonder Arlo | Spacious One-Bedroom Apartment
Entire Place • 1 bedroom
Prestige Meets Luxury In 3B Heritage Gold Triangle
Entire Place • 3 bedrooms

Sonder Rideau | Spacious One-Bedroom Apartment
Entire Place • 1 bedroom

Sonder Arlo | One-Bedroom Apartment
Entire Place • 1 bedroom
Note: Performance varies based on location, size, amenities, seasonality, and management quality. Data reflects the past 12 months.
Top Performing Airbnb Hosts in (Old) Ottawa (2025)
Learn from the best! This table showcases top-performing Airbnb hosts in (Old) Ottawa based on the number of properties managed and estimated total revenue over the past year. Analyze their scale and performance metrics.
| Host Name | Properties | Grossing Revenue | Stay Reviews | Avg Rating |
|---|---|---|---|---|
| Sonder | 18 | $528,106 | 3467 | 4.74/5.0 |
| Jenny | 4 | $127,690 | 856 | 4.91/5.0 |
| Ernesto | 7 | $91,971 | 830 | 4.72/5.0 |
| Sam | 11 | $82,045 | 264 | 3.35/5.0 |
| ReStays | 4 | $57,291 | 101 | 4.85/5.0 |
| Host #257766547 | 3 | $49,059 | 224 | 4.35/5.0 |
| Margaret | 1 | $48,158 | 85 | 4.78/5.0 |
| Wendy | 1 | $39,190 | 9 | 5.00/5.0 |
| Vincent | 1 | $38,067 | 26 | 5.00/5.0 |
| Nancy | 1 | $36,587 | 16 | 4.94/5.0 |
Analyzing the strategies of top hosts, such as their property selection, pricing, and guest communication, can offer valuable lessons for optimizing your own Airbnb operations in (Old) Ottawa.
Dive Deeper: Advanced (Old) Ottawa STR Market Data (2025)
Ready to unlock more insights? AirROI provides access to advanced metrics and comprehensive Airbnb data for (Old) Ottawa. Explore detailed analytics beyond this report to refine your investment strategy, optimize pricing, and maximize your vacation rental profits.
Explore Advanced Metrics(Old) Ottawa Short-Term Rental Market Composition (2025): Property & Room Types
Room Type Distribution
Property Type Distribution
Market Composition Insights for (Old) Ottawa
- The (Old) Ottawa Airbnb market composition is heavily skewed towards Entire Home/Apt listings, which make up 64.4% of the 90 active rentals. This indicates strong guest preference for privacy and space.
- However, a notable 32.2% share for Private Rooms suggests opportunities for budget-conscious travelers or hosts renting out spare rooms.
- Looking at the property type distribution in (Old) Ottawa, Apartment/Condo properties are the most common (63.3%), reflecting the local real estate landscape.
- The presence of 26.7% Hotel/Boutique listings indicates integration with traditional hospitality.
(Old) Ottawa Airbnb Room Capacity Analysis (2025): Bedroom Distribution
Distribution of Listings by Number of Bedrooms
Room Capacity Insights for (Old) Ottawa
- The dominant room capacity in (Old) Ottawa is 1 bedroom listings, making up 67.8% of the market. This suggests a strong demand for properties suitable for couples or solo travelers.
- Together, 1 bedroom and 2 bedrooms properties represent 77.8% of the active Airbnb listings in (Old) Ottawa, indicating a high concentration in these sizes.
- With over half the market (67.8%) consisting of studios or 1-bedroom units, (Old) Ottawa is particularly well-suited for individuals or couples.
- Listings with 3+ bedrooms (4.4%) represent a smaller niche, potentially indicating an underserved market for larger group accommodations in (Old) Ottawa.
(Old) Ottawa Vacation Rental Guest Capacity Trends (2025)
Distribution of Listings by Guest Capacity
Guest Capacity Insights for (Old) Ottawa
- The most common guest capacity trend in (Old) Ottawa vacation rentals is listings accommodating 2 guests (51.1%). This suggests the primary traveler segment is likely couples or solo travelers.
- Properties designed for 2 guests and 4 guests dominate the (Old) Ottawa STR market, accounting for 77.8% of listings.
- A significant 58.9% of listings cater specifically to 1-2 guests, highlighting strong demand from couples and solo travelers in (Old) Ottawa.
- On average, properties in (Old) Ottawa are equipped to host 2.7 guests.
(Old) Ottawa Airbnb Booking Patterns (2025): Available vs. Booked Days
Available Days Distribution
Booked Days Distribution
Booking Pattern Insights for (Old) Ottawa
- The most common availability pattern in (Old) Ottawa falls within the 271-366 days range, representing 42.2% of listings. This suggests many properties have significant open periods on their calendars.
- Approximately 81.1% of listings show high availability (181+ days open annually), indicating potential for increased bookings or specific owner usage patterns.
- For booked days, the 91-180 days range is most frequent in (Old) Ottawa (35.6%), reflecting common guest stay durations or potential owner blocking patterns.
- A notable 22.2% of properties secure long booking periods (181+ days booked per year), highlighting successful long-term rental strategies or significant owner usage.
(Old) Ottawa Airbnb Minimum Stay Requirements Analysis
Distribution of Listings by Minimum Night Requirement
1 Night
41 listings
56.2% of total
2 Nights
2 listings
2.7% of total
3 Nights
1 listings
1.4% of total
4-6 Nights
2 listings
2.7% of total
7-29 Nights
3 listings
4.1% of total
30+ Nights
24 listings
32.9% of total
Key Insights
- The most prevalent minimum stay requirement in (Old) Ottawa is 1 Night, adopted by 56.2% of listings. This highlights the market's preference for shorter, flexible bookings.
- A significant segment (32.9%) caters to monthly stays (30+ nights) in (Old) Ottawa, pointing to opportunities in the extended-stay market.
Recommendations
- Align with the market by considering a 1 Night minimum stay, as 56.2% of (Old) Ottawa hosts use this setting.
- Explore offering discounts for stays of 30+ nights to attract the 32.9% of the market seeking extended stays.
- Adjust minimum nights based on seasonality – potentially shorter during low season and longer during peak demand periods in (Old) Ottawa.
(Old) Ottawa Airbnb Cancellation Policy Trends Analysis (2025)
Flexible
19 listings
26.8% of total
Moderate
30 listings
42.3% of total
Firm
7 listings
9.9% of total
Strict
15 listings
21.1% of total
Cancellation Policy Insights for (Old) Ottawa
- The prevailing Airbnb cancellation policy trend in (Old) Ottawa is Moderate, used by 42.3% of listings.
- There's a relatively balanced mix between guest-friendly (69.1%) and stricter (31.0%) policies, offering choices for different guest needs.
Recommendations for Hosts
- Consider adopting a Moderate policy to align with the 42.3% market standard in (Old) Ottawa.
- Regularly review your cancellation policy against competitors and market demand shifts in (Old) Ottawa.
(Old) Ottawa STR Booking Lead Time Analysis (2025)
Average Booking Lead Time by Month
Booking Lead Time Insights for (Old) Ottawa
- The overall average booking lead time for vacation rentals in (Old) Ottawa is 34 days.
- Guests book furthest in advance for stays during October (average 44 days), likely coinciding with peak travel demand or local events.
- The shortest booking windows occur for stays in January (average 27 days), indicating more last-minute travel plans during this time.
- Seasonally, Spring (41 days avg.) sees the longest lead times, while Winter (30 days avg.) has the shortest, reflecting typical travel planning cycles.
Recommendations for Hosts
- Use the overall average lead time (34 days) as a baseline for your pricing and availability strategy in (Old) Ottawa.
- Target marketing efforts for the Spring season well in advance (at least 41 days) to capture early planners.
- Monitor your own booking lead times against these (Old) Ottawa averages to identify opportunities for dynamic pricing adjustments.
Popular & Essential Airbnb Amenities in (Old) Ottawa (2025)
Amenity Prevalence
Amenity Insights for (Old) Ottawa
- Essential amenities in (Old) Ottawa that guests expect include: Smoke alarm, Wifi, Air conditioning, Heating, TV. Lacking these (any) could significantly impact bookings.
- Popular amenities like Hot water, Essentials, Carbon monoxide alarm are common but not universal. Offering these can provide a competitive edge.
Recommendations for Hosts
- Ensure your listing includes all essential amenities for (Old) Ottawa: Smoke alarm, Wifi, Air conditioning, Heating, TV.
- Prioritize adding missing essentials: Air conditioning, Heating, TV.
- Consider adding popular differentiators like Hot water or Essentials to increase appeal.
- Highlight unique or less common amenities you offer (e.g., hot tub, dedicated workspace, EV charger) in your listing description and photos.
- Regularly check competitor amenities in (Old) Ottawa to stay competitive.
(Old) Ottawa Airbnb Guest Demographics & Profile Analysis (2025)
Guest Profile Summary for (Old) Ottawa
- The typical guest profile for Airbnb in (Old) Ottawa consists of primarily domestic travelers (68%), often arriving from nearby Toronto, typically belonging to the Post-2000s (Gen Z/Alpha) group (50%), primarily speaking English or French.
- Domestic travelers account for 68.2% of guests.
- Key international markets include Canada (68.2%) and United States (12.5%).
- Top languages spoken are English (51.9%) followed by French (18.4%).
- A significant demographic segment is the Post-2000s (Gen Z/Alpha) group, representing 50% of guests.
Recommendations for Hosts
- Target domestic marketing efforts towards travelers from Toronto and Montreal.
- Tailor amenities and listing descriptions to appeal to the dominant Post-2000s (Gen Z/Alpha) demographic (e.g., highlight fast WiFi, smart home features, local guides).
- Highlight unique local experiences or amenities relevant to the primary guest profile.
- Consider seasonal promotions aligned with peak travel times for key origin markets.
Nearby Short-Term Rental Market Comparison
How does the (Old) Ottawa Airbnb market stack up against its neighbors? Compare key performance metrics like average monthly revenue, ADR, and occupancy rates in surrounding areas to understand the broader regional STR landscape.
| Market | Active Properties | Monthly Revenue | Daily Rate | Avg. Occupancy |
|---|---|---|---|---|
| Mille-Isles | 93 | $5,049 | $415.08 | 41% |
| Grenville-sur-la-Rouge | 32 | $4,226 | $362.40 | 41% |
| La Conception | 172 | $3,846 | $290.12 | 42% |
| Town of North Elba | 249 | $3,765 | $395.96 | 41% |
| Cantley | 22 | $3,741 | $242.96 | 50% |
| Town of Tupper Lake | 64 | $3,412 | $323.13 | 45% |
| Town of Lyme | 29 | $3,140 | $268.25 | 46% |
| Tupper Lake | 15 | $3,083 | $346.58 | 41% |
| Sainte-Marguerite-du-Lac-Masson | 33 | $3,077 | $282.02 | 39% |
| Sainte-Anne-des-Lacs | 40 | $3,011 | $257.51 | 42% |