Wentworth Airbnb Market Analysis 2025: Short Term Rental Data & Vacation Rental Statistics in Nova Scotia, Canada
Is Airbnb profitable in Wentworth in 2025? Explore comprehensive Airbnb analytics for Wentworth, Nova Scotia, Canada to uncover income potential. This 2025 STR market report for Wentworth, based on AirROI data from April 2024 to March 2025, reveals key trends in the niche market of 23 active listings.
Whether you're considering an Airbnb investment in Wentworth, optimizing your existing vacation rental, or exploring rental arbitrage opportunities, understanding the Wentworth Airbnb data is crucial. Navigating the high regulation landscape is key to maximizing your short term rental income potential. Let's dive into the specifics.
Key Wentworth Airbnb Performance Metrics Overview
Monthly Airbnb Revenue Variations & Income Potential in Wentworth (2025)
Understanding the monthly revenue variations for Airbnb listings in Wentworth is key to maximizing your short term rental income potential. Seasonality significantly impacts earnings. Our analysis, based on data from the past 12 months, shows that the peak revenue month for STRs in Wentworth is typically February, while December often presents the lowest earnings, highlighting opportunities for strategic pricing adjustments during shoulder and low seasons. Explore the typical Airbnb income in Wentworth across different performance tiers:
- Best-in-class properties (Top 10%) achieve $6,750+ monthly, often utilizing dynamic pricing and superior guest experiences.
- Strong performing properties (Top 25%) earn $4,855 or more, indicating effective management and desirable locations/amenities.
- Typical properties (Median) generate around $3,319 per month, representing the average market performance.
- Entry-level properties (Bottom 25%) see earnings around $2,105, often with potential for optimization.
Average Monthly Airbnb Earnings Trend in Wentworth
Wentworth Airbnb Occupancy Rate Trends (2025)
Maximize your bookings by understanding the Wentworth STR occupancy trends. Seasonal demand shifts significantly influence how often properties are booked. Typically, Februarysees the highest demand (peak season occupancy), while April experiences the lowest (low season). Effective strategies, like adjusting minimum stays or offering promotions, can boost occupancy during slower periods. Here's how different property tiers perform in Wentworth:
- Best-in-class properties (Top 10%) achieve 79%+ occupancy, indicating high desirability and potentially optimized availability.
- Strong performing properties (Top 25%) maintain 68% or higher occupancy, suggesting good market fit and guest satisfaction.
- Typical properties (Median) have an occupancy rate around 48%.
- Entry-level properties (Bottom 25%) average 28% occupancy, potentially facing higher vacancy.
Average Monthly Occupancy Rate Trend in Wentworth
Average Daily Rate (ADR) Airbnb Trends in Wentworth (2025)
Effective short term rental pricing strategy in Wentworth involves understanding monthly ADR fluctuations. The Average Daily Rate (ADR) for Airbnb in Wentworth typically peaks in January and dips lowest during April. Leveraging Airbnb dynamic pricing tools or strategies based on this seasonality can significantly boost revenue. Here's a look at the typical nightly rates achieved:
- Best-in-class properties (Top 10%) command rates of $314+ per night, often due to premium features or locations.
- Strong performing properties (Top 25%) achieve nightly rates of $230 or more.
- Typical properties (Median) charge around $178 per night.
- Entry-level properties (Bottom 25%) earn around $141 per night.
Average Daily Rate (ADR) Trend by Month in Wentworth
Get Live Wentworth Market Intelligence 👇

Explore Real-time Analytics
Airbnb Seasonality Analysis & Trends in Wentworth (2025)
Peak Season (February, January, August)
- Revenue averages $4,877 per month
- Occupancy rates average 59.3%
- Daily rates average $220
Shoulder Season
- Revenue averages $3,883 per month
- Occupancy maintains around 46.7%
- Daily rates hold near $203
Low Season (September, November, December)
- Revenue drops to average $2,929 per month
- Occupancy decreases to average 40.5%
- Daily rates adjust to average $215
Seasonality Insights for Wentworth
- The Airbnb seasonality in Wentworth shows moderate seasonality with distinct peak and low periods. While the sections above show seasonal averages, it's also insightful to look at the extremes:
- During the high season, the absolute peak month showcases Wentworth's highest earning potential, with monthly revenues capable of climbing to $5,068, occupancy reaching a high of 63.2%, and ADRs peaking at $230.
- Conversely, the slowest single month of the year, typically falling within the low season, marks the market's lowest point. In this month, revenue might dip to $2,770, occupancy could drop to 29.2%, and ADRs may adjust down to $195.
- Understanding both the seasonal averages and these monthly peaks and troughs in revenue, occupancy, and ADR is crucial for maximizing your Airbnb profit potential in Wentworth.
Seasonal Strategies for Maximizing Profit
- Peak Season: Maximize revenue through premium pricing and potentially longer minimum stays. Ensure high availability.
- Low Season: Offer competitive pricing, special promotions (e.g., extended stay discounts), and flexible cancellation policies. Target off-season travelers like remote workers or budget-conscious guests.
- Shoulder Seasons: Implement dynamic pricing that balances peak and low rates. Target weekend travelers or specific events. Offer slightly more flexible terms than peak season.
- Regularly analyze your own performance against these Wentworth seasonality benchmarks and adjust your pricing and availability strategy accordingly.
Best Areas for Airbnb Investment in Wentworth (2025)
Exploring the top neighborhoods for short-term rentals in Wentworth? This section highlights key areas, outlining why they are attractive for hosts and guests, along with notable local attractions. Consider these locations based on your target guest profile and investment strategy.
| Neighborhood / Area | Why Host Here? (Target Guests & Appeal) | Key Attractions & Landmarks |
|---|---|---|
| Wolfville | Charming university town known for its vineyards and cultural festivals. Attracts visitors throughout the year including students, families, and wine enthusiasts. | Acadia University, Barnacle Blue, Wolfville Farmers' Market, Gaspereau Vineyards, Domaine de Grand Pré, K.C. Irving Environmental Science Centre |
| Lunenburg | UNESCO World Heritage site with stunning architecture and a rich maritime history. Popular with tourists for its picturesque waterfront and local culture. | Lunenburg Harbour, Fisheries Museum of the Atlantic, Old Town Lunenburg, Bluenose II, Ironworks Distillery, St. John's Anglican Church |
| Annapolis Royal | Historic town known for its history and beautiful gardens. A great spot for historical tourism and outdoor enthusiasts. | Fort Anne National Historic Site, Annapolis Royal Historic Gardens, The Port-Royal National Historic Site, Annapolis River, Old Town Market, Annapolis Royal Golf Club |
| Mahone Bay | Picturesque fishing village known for stunning views and charming shops. Ideal for travelers seeking a quaint seaside experience. | Mahone Bay Museum, The Three Churches, Mahone Bay Waterfront, Canadian Craft Distilleries, Bayswater Beach Provincial Park, Fisherman's Memorial |
| Cape Breton Island | Known for its breathtaking landscapes and the Cabot Trail. A prime location for nature lovers and adventure seekers. | Cape Breton Highlands National Park, Cabot Trail, Glenora Distillery, Baddeck, Louisbourg National Historic Site, Margaree River |
| Peggy's Cove | Famous for its iconic lighthouse and rugged coastal scenery. A must-see destination for tourists exploring Nova Scotia's coast. | Peggy's Cove Lighthouse, The Swissair Flight 111 Memorial, Peggy's Cove village, Coastal hiking trails, Scenic views, Art galleries |
| Chester | Lovely seaside resort town with an artistic community. Attracts visitors looking for a relaxing getaway and cultural experiences. | Chester Golf Club, Chester Playhouse, Bayswater Beach, Theatre Arts Guild, Local artisan shops, Chester Marina |
| Halifax Waterfront | Vibrant urban center known for its waterfront and historic sites. Attracts tourists and business travelers alike, being the capital city of Nova Scotia. | Halifax Citadel National Historic Site, The Canadian Museum of Immigration at Pier 21, Halifax Seaport Farmers' Market, Maritime Museum of the Atlantic, Ferry to Dartmouth, Public Gardens |
Understanding Airbnb License Requirements & STR Laws in Wentworth (2025)
Yes, Wentworth, Nova Scotia, Canada enforces high STR regulations. Obtaining a license and ensuring compliance is almost certainly required according to current 2025 STR laws. Always verify the latest short term rental regulations and Airbnb license requirements directly with local government authorities for Wentworth to ensure full compliance before hosting.
(Source: AirROI data, 2025, based on 91% licensed listings)
Top Performing Airbnb Properties in Wentworth (2025)
Benchmark your potential! Explore examples of top-performing Airbnb properties in Wentworthbased on Trailing Twelve Month (TTM) revenue. Analyze their characteristics, revenue, occupancy rate, and ADR to understand what drives success in this market.
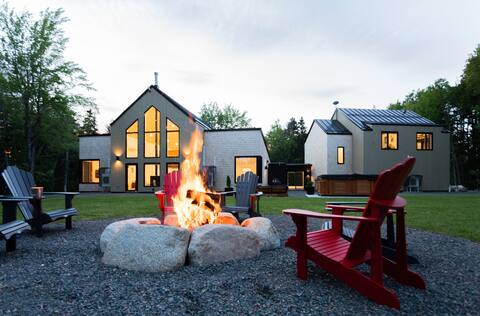
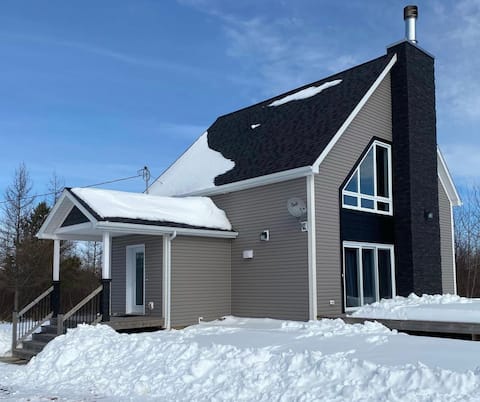
Modern Chalet nestled in Wentworth Valley.
Entire Place • 4 bedrooms
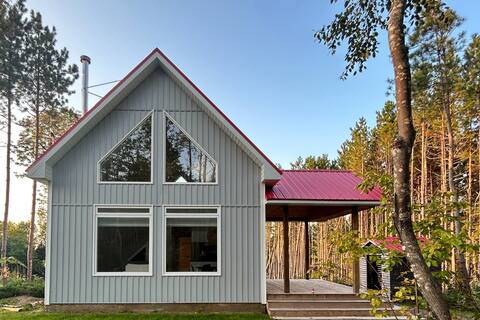
The Hill's End-Wentworth Valley
Entire Place • 3 bedrooms
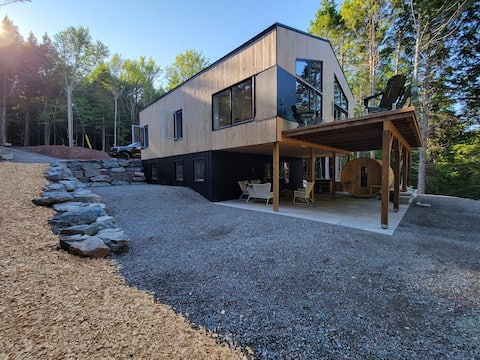
Wentworth Spa & Retreat
Entire Place • 3 bedrooms

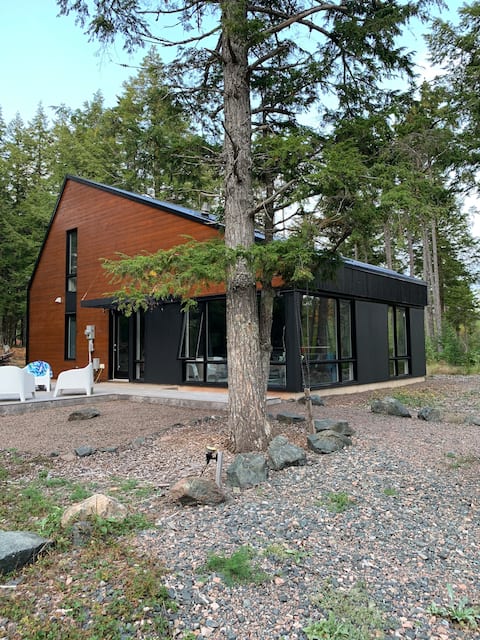
Hemlock Hideaway - newly built chalet with hot-tub
Entire Place • 2 bedrooms
Wentworth Scandi Chalet
Entire Place • 3 bedrooms
Le Chalet Après
Entire Place • 3 bedrooms
Note: Performance varies based on location, size, amenities, seasonality, and management quality. Data reflects the past 12 months.
Top Performing Airbnb Hosts in Wentworth (2025)
Learn from the best! This table showcases top-performing Airbnb hosts in Wentworth based on the number of properties managed and estimated total revenue over the past year. Analyze their scale and performance metrics.
| Host Name | Properties | Grossing Revenue | Stay Reviews | Avg Rating |
|---|---|---|---|---|
| George | 1 | $142,790 | 53 | 4.98/5.0 |
| Jeff | 1 | $72,552 | 20 | 4.95/5.0 |
| Tim | 2 | $57,087 | 85 | 4.87/5.0 |
| Tim | 1 | $54,296 | 71 | 4.80/5.0 |
| Kirsti | 1 | $52,519 | 110 | 4.95/5.0 |
| Rebecca | 1 | $43,111 | 9 | 5.00/5.0 |
| Susanne | 1 | $36,430 | 23 | 5.00/5.0 |
| Jessy | 1 | $35,297 | 237 | 4.81/5.0 |
| Ryan | 1 | $33,546 | 26 | 4.96/5.0 |
| Pj | 1 | $31,968 | 39 | 4.87/5.0 |
Analyzing the strategies of top hosts, such as their property selection, pricing, and guest communication, can offer valuable lessons for optimizing your own Airbnb operations in Wentworth.
Dive Deeper: Advanced Wentworth STR Market Data (2025)
Ready to unlock more insights? AirROI provides access to advanced metrics and comprehensive Airbnb data for Wentworth. Explore detailed analytics beyond this report to refine your investment strategy, optimize pricing, and maximize your vacation rental profits.
Explore Advanced MetricsWentworth Short-Term Rental Market Composition (2025): Property & Room Types
Room Type Distribution
Property Type Distribution
Market Composition Insights for Wentworth
- The Wentworth Airbnb market composition is heavily skewed towards Entire Home/Apt listings, which make up 100% of the 23 active rentals. This indicates strong guest preference for privacy and space.
- Looking at the property type distribution in Wentworth, House properties are the most common (78.3%), reflecting the local real estate landscape.
- Houses represent a significant 78.3% portion, catering likely to families or larger groups.
- Smaller segments like apartment/condo (combined 4.3%) offer potential for unique stay experiences.
Wentworth Airbnb Room Capacity Analysis (2025): Bedroom Distribution
Distribution of Listings by Number of Bedrooms
Room Capacity Insights for Wentworth
- The dominant room capacity in Wentworth is 3 bedrooms listings, making up 56.5% of the market. This suggests a strong demand for properties suitable for families or small groups.
- Together, 3 bedrooms and 2 bedrooms properties represent 86.9% of the active Airbnb listings in Wentworth, indicating a high concentration in these sizes.
- A significant 65.2% of listings offer 3+ bedrooms, catering to larger groups and families seeking more space in Wentworth.
Wentworth Vacation Rental Guest Capacity Trends (2025)
Distribution of Listings by Guest Capacity
Guest Capacity Insights for Wentworth
- The most common guest capacity trend in Wentworth vacation rentals is listings accommodating 8+ guests (47.8%). This suggests the primary traveler segment is likely larger groups.
- Properties designed for 8+ guests and 6 guests dominate the Wentworth STR market, accounting for 69.5% of listings.
- 69.5% of properties accommodate 6+ guests, serving the market segment for larger families or group travel in Wentworth.
- On average, properties in Wentworth are equipped to host 6.5 guests.
Wentworth Airbnb Booking Patterns (2025): Available vs. Booked Days
Available Days Distribution
Booked Days Distribution
Booking Pattern Insights for Wentworth
- The most common availability pattern in Wentworth falls within the 271-366 days range, representing 34.8% of listings. This suggests many properties have significant open periods on their calendars.
- Approximately 65.2% of listings show high availability (181+ days open annually), indicating potential for increased bookings or specific owner usage patterns.
- For booked days, the 91-180 days range is most frequent in Wentworth (30.4%), reflecting common guest stay durations or potential owner blocking patterns.
- A notable 34.7% of properties secure long booking periods (181+ days booked per year), highlighting successful long-term rental strategies or significant owner usage.
Wentworth Airbnb Minimum Stay Requirements Analysis
Distribution of Listings by Minimum Night Requirement
1 Night
3 listings
13.6% of total
2 Nights
13 listings
59.1% of total
3 Nights
2 listings
9.1% of total
4-6 Nights
1 listings
4.5% of total
7-29 Nights
1 listings
4.5% of total
30+ Nights
2 listings
9.1% of total
Key Insights
- The most prevalent minimum stay requirement in Wentworth is 2 Nights, adopted by 59.1% of listings. This highlights the market's preference for shorter, flexible bookings.
- A strong majority (72.7%) of the Wentworth Airbnb data shows acceptance of very short stays (1-2 nights), indicating a dynamic, high-turnover market.
Recommendations
- Align with the market by considering a 2 Nights minimum stay, as 59.1% of Wentworth hosts use this setting.
- If feasible, allowing 1-night stays, especially midweek or during low season, could capture last-minute bookings, as only 13.6% currently do.
- A 2-night minimum appears standard (59.1%). Consider this for weekends or peak periods.
- Explore offering discounts for stays of 30+ nights to attract the 9.1% of the market seeking extended stays.
- Adjust minimum nights based on seasonality – potentially shorter during low season and longer during peak demand periods in Wentworth.
Wentworth Airbnb Cancellation Policy Trends Analysis (2025)
Flexible
5 listings
21.7% of total
Moderate
9 listings
39.1% of total
Firm
5 listings
21.7% of total
Strict
4 listings
17.4% of total
Cancellation Policy Insights for Wentworth
- The prevailing Airbnb cancellation policy trend in Wentworth is Moderate, used by 39.1% of listings.
- There's a relatively balanced mix between guest-friendly (60.8%) and stricter (39.1%) policies, offering choices for different guest needs.
Recommendations for Hosts
- Consider adopting a Moderate policy to align with the 39.1% market standard in Wentworth.
- Regularly review your cancellation policy against competitors and market demand shifts in Wentworth.
Wentworth STR Booking Lead Time Analysis (2025)
Average Booking Lead Time by Month
Booking Lead Time Insights for Wentworth
- The overall average booking lead time for vacation rentals in Wentworth is 58 days.
- Guests book furthest in advance for stays during February (average 117 days), likely coinciding with peak travel demand or local events.
- The shortest booking windows occur for stays in October (average 39 days), indicating more last-minute travel plans during this time.
- Seasonally, Winter (100 days avg.) sees the longest lead times, while Fall (39 days avg.) has the shortest, reflecting typical travel planning cycles.
Recommendations for Hosts
- Use the overall average lead time (58 days) as a baseline for your pricing and availability strategy in Wentworth.
- For February stays, consider implementing length-of-stay discounts or slightly higher rates for bookings made less than 117 days out to capitalize on advance planning.
- Target marketing efforts for the Winter season well in advance (at least 100 days) to capture early planners.
- Monitor your own booking lead times against these Wentworth averages to identify opportunities for dynamic pricing adjustments.
Popular & Essential Airbnb Amenities in Wentworth (2025)
Amenity Prevalence
Amenity Insights for Wentworth
- Essential amenities in Wentworth that guests expect include: Heating, Refrigerator, Coffee maker, Dishes and silverware, Kitchen, Smoke alarm, Wifi, Microwave, Hot water, Free parking on premises. Lacking these (any) could significantly impact bookings.
Recommendations for Hosts
- Ensure your listing includes all essential amenities for Wentworth: Heating, Refrigerator, Coffee maker, Dishes and silverware, Kitchen, Smoke alarm, Wifi, Microwave, Hot water, Free parking on premises.
- Prioritize adding missing essentials: Smoke alarm, Wifi, Microwave, Hot water, Free parking on premises.
- Highlight unique or less common amenities you offer (e.g., hot tub, dedicated workspace, EV charger) in your listing description and photos.
- Regularly check competitor amenities in Wentworth to stay competitive.
Wentworth Airbnb Guest Demographics & Profile Analysis (2025)
Guest Profile Summary for Wentworth
- The typical guest profile for Airbnb in Wentworth consists of primarily domestic travelers (95%), often arriving from nearby Halifax, typically belonging to the Post-2000s (Gen Z/Alpha) group (50%), primarily speaking English or French.
- Domestic travelers account for 95.3% of guests.
- Key international markets include Canada (95.3%) and United States (3.4%).
- Top languages spoken are English (72.3%) followed by French (21.5%).
- A significant demographic segment is the Post-2000s (Gen Z/Alpha) group, representing 50% of guests.
Recommendations for Hosts
- Target domestic marketing efforts towards travelers from Halifax and Dartmouth.
- Tailor amenities and listing descriptions to appeal to the dominant Post-2000s (Gen Z/Alpha) demographic (e.g., highlight fast WiFi, smart home features, local guides).
- Highlight unique local experiences or amenities relevant to the primary guest profile.
- Consider seasonal promotions aligned with peak travel times for key origin markets.
Nearby Short-Term Rental Market Comparison
How does the Wentworth Airbnb market stack up against its neighbors? Compare key performance metrics like average monthly revenue, ADR, and occupancy rates in surrounding areas to understand the broader regional STR landscape.
| Market | Active Properties | Monthly Revenue | Daily Rate | Avg. Occupancy |
|---|---|---|---|---|
| Boutiliers Point | 12 | $4,123 | $220.91 | 59% |
| Lakelands | 11 | $3,923 | $273.47 | 48% |
| Queensland | 14 | $3,355 | $264.87 | 55% |
| Hammonds Plains | 11 | $2,732 | $176.50 | 58% |
| Chester Grant | 11 | $2,529 | $205.70 | 50% |
| Long River | 17 | $2,500 | $236.42 | 52% |
| Granville | 10 | $2,491 | $276.93 | 56% |
| Feltzen South | 21 | $2,483 | $190.43 | 42% |
| Port Williams | 16 | $2,478 | $245.95 | 52% |
| Vaughan | 38 | $2,332 | $183.45 | 47% |