Vaughan Airbnb Market Analysis 2025: Short Term Rental Data & Vacation Rental Statistics in Nova Scotia, Canada
Is Airbnb profitable in Vaughan in 2025? Explore comprehensive Airbnb analytics for Vaughan, Nova Scotia, Canada to uncover income potential. This 2025 STR market report for Vaughan, based on AirROI data from April 2024 to March 2025, reveals key trends in the niche market of 38 active listings.
Whether you're considering an Airbnb investment in Vaughan, optimizing your existing vacation rental, or exploring rental arbitrage opportunities, understanding the Vaughan Airbnb data is crucial. Navigating the high regulation landscape is key to maximizing your short term rental income potential. Let's dive into the specifics.
Key Vaughan Airbnb Performance Metrics Overview
Monthly Airbnb Revenue Variations & Income Potential in Vaughan (2025)
Understanding the monthly revenue variations for Airbnb listings in Vaughan is key to maximizing your short term rental income potential. Seasonality significantly impacts earnings. Our analysis, based on data from the past 12 months, shows that the peak revenue month for STRs in Vaughan is typically August, while February often presents the lowest earnings, highlighting opportunities for strategic pricing adjustments during shoulder and low seasons. Explore the typical Airbnb income in Vaughan across different performance tiers:
- Best-in-class properties (Top 10%) achieve $5,451+ monthly, often utilizing dynamic pricing and superior guest experiences.
- Strong performing properties (Top 25%) earn $3,841 or more, indicating effective management and desirable locations/amenities.
- Typical properties (Median) generate around $2,463 per month, representing the average market performance.
- Entry-level properties (Bottom 25%) see earnings around $1,558, often with potential for optimization.
Average Monthly Airbnb Earnings Trend in Vaughan
Vaughan Airbnb Occupancy Rate Trends (2025)
Maximize your bookings by understanding the Vaughan STR occupancy trends. Seasonal demand shifts significantly influence how often properties are booked. Typically, Augustsees the highest demand (peak season occupancy), while April experiences the lowest (low season). Effective strategies, like adjusting minimum stays or offering promotions, can boost occupancy during slower periods. Here's how different property tiers perform in Vaughan:
- Best-in-class properties (Top 10%) achieve 74%+ occupancy, indicating high desirability and potentially optimized availability.
- Strong performing properties (Top 25%) maintain 60% or higher occupancy, suggesting good market fit and guest satisfaction.
- Typical properties (Median) have an occupancy rate around 45%.
- Entry-level properties (Bottom 25%) average 29% occupancy, potentially facing higher vacancy.
Average Monthly Occupancy Rate Trend in Vaughan
Average Daily Rate (ADR) Airbnb Trends in Vaughan (2025)
Effective short term rental pricing strategy in Vaughan involves understanding monthly ADR fluctuations. The Average Daily Rate (ADR) for Airbnb in Vaughan typically peaks in July and dips lowest during January. Leveraging Airbnb dynamic pricing tools or strategies based on this seasonality can significantly boost revenue. Here's a look at the typical nightly rates achieved:
- Best-in-class properties (Top 10%) command rates of $268+ per night, often due to premium features or locations.
- Strong performing properties (Top 25%) achieve nightly rates of $214 or more.
- Typical properties (Median) charge around $171 per night.
- Entry-level properties (Bottom 25%) earn around $136 per night.
Average Daily Rate (ADR) Trend by Month in Vaughan
Get Live Vaughan Market Intelligence 👇

Explore Real-time Analytics
Airbnb Seasonality Analysis & Trends in Vaughan (2025)
Peak Season (August, July, June)
- Revenue averages $4,430 per month
- Occupancy rates average 62.5%
- Daily rates average $201
Shoulder Season
- Revenue averages $2,596 per month
- Occupancy maintains around 40.2%
- Daily rates hold near $180
Low Season (January, February, March)
- Revenue drops to average $1,698 per month
- Occupancy decreases to average 37.0%
- Daily rates adjust to average $167
Seasonality Insights for Vaughan
- The Airbnb seasonality in Vaughan shows highly seasonal trends requiring careful strategy. While the sections above show seasonal averages, it's also insightful to look at the extremes:
- During the high season, the absolute peak month showcases Vaughan's highest earning potential, with monthly revenues capable of climbing to $5,097, occupancy reaching a high of 74.5%, and ADRs peaking at $203.
- Conversely, the slowest single month of the year, typically falling within the low season, marks the market's lowest point. In this month, revenue might dip to $1,684, occupancy could drop to 35.1%, and ADRs may adjust down to $165.
- Understanding both the seasonal averages and these monthly peaks and troughs in revenue, occupancy, and ADR is crucial for maximizing your Airbnb profit potential in Vaughan.
Seasonal Strategies for Maximizing Profit
- Peak Season: Maximize revenue through premium pricing and potentially longer minimum stays. Ensure high availability.
- Low Season: Offer competitive pricing, special promotions (e.g., extended stay discounts), and flexible cancellation policies. Target off-season travelers like remote workers or budget-conscious guests.
- Shoulder Seasons: Implement dynamic pricing that balances peak and low rates. Target weekend travelers or specific events. Offer slightly more flexible terms than peak season.
- Regularly analyze your own performance against these Vaughan seasonality benchmarks and adjust your pricing and availability strategy accordingly.
Best Areas for Airbnb Investment in Vaughan (2025)
Exploring the top neighborhoods for short-term rentals in Vaughan? This section highlights key areas, outlining why they are attractive for hosts and guests, along with notable local attractions. Consider these locations based on your target guest profile and investment strategy.
| Neighborhood / Area | Why Host Here? (Target Guests & Appeal) | Key Attractions & Landmarks |
|---|---|---|
| Vaughan Mills | Located near one of Canada’s largest shopping centres, Vaughan Mills attracts tourists who are looking for shopping, entertainment, and dining options. It’s ideal for those wanting a convenient and lively atmosphere. | Vaughan Mills Shopping Centre, Legoland Discovery Centre, Planet Play, Reptilia Vaughan, iFLY Toronto |
| Copeland Park | This area offers scenic parks and recreational facilities, making it popular for families and nature lovers. Proximity to the city’s amenities adds to its appeal for guests looking for a peaceful stay. | Booth Park, Vaughan Grove Trail, Vaughan Public Libraries - Vaughan Woodbridge, Locale Park, Kleinburg Village |
| Woodbridge | Woodbridge is known for its Italian heritage, cuisine, and cultural events, making it a charming area for guests interested in experiencing local culture and dining. | Market Lane, Woodbridge Memorial Arena, Vaughan Civic Centre, Vaughan Grove Park, Village of Kleinburg |
| Maple | A family-friendly community with a range of parks, good schools, and easy access to public transport. Ideal for those traveling with families seeking comfort and amenities. | North Maple Regional Park, Maple Community Centre, Mother Teresa Catholic Secondary School, Maple Art Centre, Gus Harris Park |
| Kleinburg | A picturesque village known for its historical significance, beautiful architecture, and artistic vibe. Attracts visitors who appreciate history and culture, especially art lovers. | McMichael Canadian Art Collection, Kleinburg Village, Copper Creek Golf Club, Doctor’s House, Eagle’s Nest Golf Club |
| Woodstream | A residential area that boasts a suburban charm, ideal for guests looking for comfort and local amenities while still being close to city attractions. | Woodstream Park, Woodspring Park, Vaughan Mills Outlet, Cortellucci Vaughan Hospital, Nearby plazas with shops and restaurants |
| Pine Valley | This area is known for its luxurious homes and green spaces, attracting those who seek a tranquil environment combined with upscale experiences. | Pine Valley Golf Club, Vaughan Golf & Country Club, Cityview Park, Running Trails, Nearby fine dining options |
| Islington Woods | A tranquil and affluent neighborhood known for its parks and scenic beauty, appealing to visitors looking to immerse themselves in nature. | Islington Woods Park, Dufferin Clark Library, Woodbridge Skate Park, Nineteenth Avenue Park, Natural areas and walking trails |
Understanding Airbnb License Requirements & STR Laws in Vaughan (2025)
Yes, Vaughan, Nova Scotia, Canada enforces high STR regulations. Obtaining a license and ensuring compliance is almost certainly required according to current 2025 STR laws. Always verify the latest short term rental regulations and Airbnb license requirements directly with local government authorities for Vaughan to ensure full compliance before hosting.
(Source: AirROI data, 2025, based on 87% licensed listings)
Top Performing Airbnb Properties in Vaughan (2025)
Benchmark your potential! Explore examples of top-performing Airbnb properties in Vaughanbased on Trailing Twelve Month (TTM) revenue. Analyze their characteristics, revenue, occupancy rate, and ADR to understand what drives success in this market.
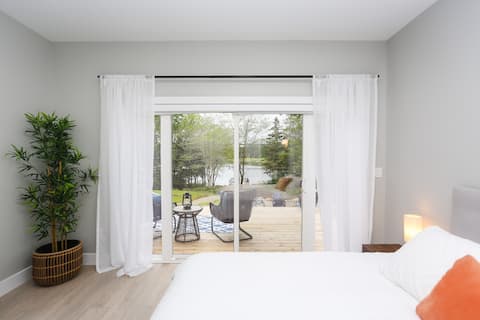
Stunning Lakehouse 10 mins from Ski Martock
Entire Place • 3 bedrooms
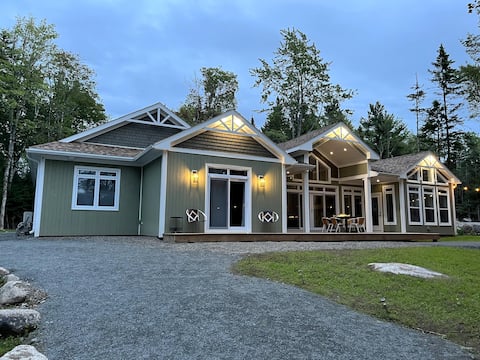
Hot tub! Sunnyside Lake House, Falls Lake
Entire Place • 3 bedrooms

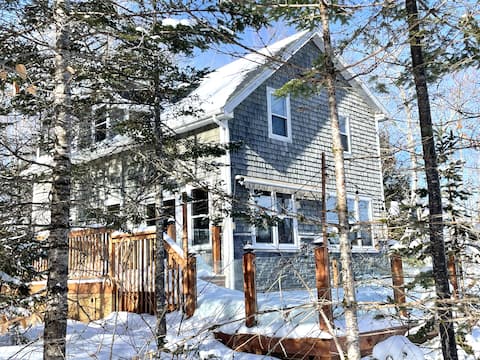
Lakeside Retreat with Hot Tub
Entire Place • 3 bedrooms
Luxury Lake Home on Falls Lake with woodstove
Entire Place • 3 bedrooms

Birchwood on the Lake (with Hot Tub)
Entire Place • 3 bedrooms

Pinecone Cottage Hot Tub & Projector at Falls Lake
Entire Place • 2 bedrooms
Note: Performance varies based on location, size, amenities, seasonality, and management quality. Data reflects the past 12 months.
Top Performing Airbnb Hosts in Vaughan (2025)
Learn from the best! This table showcases top-performing Airbnb hosts in Vaughan based on the number of properties managed and estimated total revenue over the past year. Analyze their scale and performance metrics.
| Host Name | Properties | Grossing Revenue | Stay Reviews | Avg Rating |
|---|---|---|---|---|
| Sara | 2 | $89,371 | 426 | 4.92/5.0 |
| Brendan | 2 | $87,409 | 374 | 4.93/5.0 |
| Christina | 1 | $75,547 | 21 | 5.00/5.0 |
| Patricia | 1 | $67,153 | 60 | 4.98/5.0 |
| David | 1 | $52,595 | 153 | 4.99/5.0 |
| Mark | 1 | $49,185 | 135 | 4.99/5.0 |
| Nadya | 1 | $42,646 | 23 | 4.91/5.0 |
| Scott | 1 | $41,164 | 105 | 4.99/5.0 |
| Dean | 1 | $33,675 | 27 | 4.96/5.0 |
| Justin | 1 | $32,996 | 32 | 4.88/5.0 |
Analyzing the strategies of top hosts, such as their property selection, pricing, and guest communication, can offer valuable lessons for optimizing your own Airbnb operations in Vaughan.
Dive Deeper: Advanced Vaughan STR Market Data (2025)
Ready to unlock more insights? AirROI provides access to advanced metrics and comprehensive Airbnb data for Vaughan. Explore detailed analytics beyond this report to refine your investment strategy, optimize pricing, and maximize your vacation rental profits.
Explore Advanced MetricsVaughan Short-Term Rental Market Composition (2025): Property & Room Types
Room Type Distribution
Property Type Distribution
Market Composition Insights for Vaughan
- The Vaughan Airbnb market composition is heavily skewed towards Entire Home/Apt listings, which make up 100% of the 38 active rentals. This indicates strong guest preference for privacy and space.
- Looking at the property type distribution in Vaughan, House properties are the most common (89.5%), reflecting the local real estate landscape.
- Houses represent a significant 89.5% portion, catering likely to families or larger groups.
Vaughan Airbnb Room Capacity Analysis (2025): Bedroom Distribution
Distribution of Listings by Number of Bedrooms
Room Capacity Insights for Vaughan
- The dominant room capacity in Vaughan is 3 bedrooms listings, making up 55.3% of the market. This suggests a strong demand for properties suitable for families or small groups.
- Together, 3 bedrooms and 2 bedrooms properties represent 89.5% of the active Airbnb listings in Vaughan, indicating a high concentration in these sizes.
- A significant 57.9% of listings offer 3+ bedrooms, catering to larger groups and families seeking more space in Vaughan.
Vaughan Vacation Rental Guest Capacity Trends (2025)
Distribution of Listings by Guest Capacity
Guest Capacity Insights for Vaughan
- The most common guest capacity trend in Vaughan vacation rentals is listings accommodating 6 guests (39.5%). This suggests the primary traveler segment is likely larger groups.
- Properties designed for 6 guests and 8+ guests dominate the Vaughan STR market, accounting for 65.8% of listings.
- 65.8% of properties accommodate 6+ guests, serving the market segment for larger families or group travel in Vaughan.
- On average, properties in Vaughan are equipped to host 6.0 guests.
Vaughan Airbnb Booking Patterns (2025): Available vs. Booked Days
Available Days Distribution
Booked Days Distribution
Booking Pattern Insights for Vaughan
- The most common availability pattern in Vaughan falls within the 181-270 days range, representing 47.4% of listings. This suggests many properties have significant open periods on their calendars.
- Approximately 73.7% of listings show high availability (181+ days open annually), indicating potential for increased bookings or specific owner usage patterns.
- For booked days, the 91-180 days range is most frequent in Vaughan (44.7%), reflecting common guest stay durations or potential owner blocking patterns.
- A notable 29.0% of properties secure long booking periods (181+ days booked per year), highlighting successful long-term rental strategies or significant owner usage.
Vaughan Airbnb Minimum Stay Requirements Analysis
Distribution of Listings by Minimum Night Requirement
1 Night
3 listings
9.1% of total
2 Nights
20 listings
60.6% of total
3 Nights
2 listings
6.1% of total
4-6 Nights
3 listings
9.1% of total
7-29 Nights
3 listings
9.1% of total
30+ Nights
2 listings
6.1% of total
Key Insights
- The most prevalent minimum stay requirement in Vaughan is 2 Nights, adopted by 60.6% of listings. This highlights the market's preference for shorter, flexible bookings.
- A strong majority (69.7%) of the Vaughan Airbnb data shows acceptance of very short stays (1-2 nights), indicating a dynamic, high-turnover market.
Recommendations
- Align with the market by considering a 2 Nights minimum stay, as 60.6% of Vaughan hosts use this setting.
- If feasible, allowing 1-night stays, especially midweek or during low season, could capture last-minute bookings, as only 9.1% currently do.
- A 2-night minimum appears standard (60.6%). Consider this for weekends or peak periods.
- Explore offering discounts for stays of 30+ nights to attract the 6.1% of the market seeking extended stays.
- Adjust minimum nights based on seasonality – potentially shorter during low season and longer during peak demand periods in Vaughan.
Vaughan Airbnb Cancellation Policy Trends Analysis (2025)
Flexible
5 listings
15.2% of total
Moderate
14 listings
42.4% of total
Firm
10 listings
30.3% of total
Strict
4 listings
12.1% of total
Cancellation Policy Insights for Vaughan
- The prevailing Airbnb cancellation policy trend in Vaughan is Moderate, used by 42.4% of listings.
- There's a relatively balanced mix between guest-friendly (57.6%) and stricter (42.4%) policies, offering choices for different guest needs.
Recommendations for Hosts
- Consider adopting a Moderate policy to align with the 42.4% market standard in Vaughan.
- Using a Strict policy might deter some guests, as only 12.1% of listings use it. Evaluate if potential revenue protection outweighs possible lower booking rates.
- Regularly review your cancellation policy against competitors and market demand shifts in Vaughan.
Vaughan STR Booking Lead Time Analysis (2025)
Average Booking Lead Time by Month
Booking Lead Time Insights for Vaughan
- The overall average booking lead time for vacation rentals in Vaughan is 40 days.
- Guests book furthest in advance for stays during July (average 106 days), likely coinciding with peak travel demand or local events.
- The shortest booking windows occur for stays in November (average 26 days), indicating more last-minute travel plans during this time.
- Seasonally, Summer (84 days avg.) sees the longest lead times, while Spring (34 days avg.) has the shortest, reflecting typical travel planning cycles.
Recommendations for Hosts
- Use the overall average lead time (40 days) as a baseline for your pricing and availability strategy in Vaughan.
- For July stays, consider implementing length-of-stay discounts or slightly higher rates for bookings made less than 106 days out to capitalize on advance planning.
- Target marketing efforts for the Summer season well in advance (at least 84 days) to capture early planners.
- Monitor your own booking lead times against these Vaughan averages to identify opportunities for dynamic pricing adjustments.
Popular & Essential Airbnb Amenities in Vaughan (2025)
Amenity Prevalence
Amenity Insights for Vaughan
- Essential amenities in Vaughan that guests expect include: BBQ grill, Dishes and silverware, Heating, Free parking on premises, Smoke alarm, Stove, Hot water, Cooking basics, Microwave, Wifi. Lacking these (any) could significantly impact bookings.
Recommendations for Hosts
- Ensure your listing includes all essential amenities for Vaughan: BBQ grill, Dishes and silverware, Heating, Free parking on premises, Smoke alarm, Stove, Hot water, Cooking basics, Microwave, Wifi.
- Prioritize adding missing essentials: Stove, Hot water, Cooking basics, Microwave, Wifi.
- Highlight unique or less common amenities you offer (e.g., hot tub, dedicated workspace, EV charger) in your listing description and photos.
- Regularly check competitor amenities in Vaughan to stay competitive.
Vaughan Airbnb Guest Demographics & Profile Analysis (2025)
Guest Profile Summary for Vaughan
- The typical guest profile for Airbnb in Vaughan consists of primarily domestic travelers (92%), often arriving from nearby Halifax, typically belonging to the Post-2000s (Gen Z/Alpha) group (50%), primarily speaking English or French.
- Domestic travelers account for 91.5% of guests.
- Key international markets include Canada (91.5%) and United States (5%).
- Top languages spoken are English (72.9%) followed by French (16.9%).
- A significant demographic segment is the Post-2000s (Gen Z/Alpha) group, representing 50% of guests.
Recommendations for Hosts
- Target domestic marketing efforts towards travelers from Halifax and Dartmouth.
- Tailor amenities and listing descriptions to appeal to the dominant Post-2000s (Gen Z/Alpha) demographic (e.g., highlight fast WiFi, smart home features, local guides).
- Highlight unique local experiences or amenities relevant to the primary guest profile.
- Consider seasonal promotions aligned with peak travel times for key origin markets.
Nearby Short-Term Rental Market Comparison
How does the Vaughan Airbnb market stack up against its neighbors? Compare key performance metrics like average monthly revenue, ADR, and occupancy rates in surrounding areas to understand the broader regional STR landscape.
| Market | Active Properties | Monthly Revenue | Daily Rate | Avg. Occupancy |
|---|---|---|---|---|
| Boutiliers Point | 12 | $4,123 | $220.91 | 59% |
| Lakelands | 11 | $3,923 | $273.47 | 48% |
| Hunts Point | 14 | $3,820 | $277.48 | 43% |
| Chittenden | 17 | $3,517 | $287.26 | 42% |
| Queensland | 14 | $3,355 | $264.87 | 55% |
| Kings County | 10 | $3,052 | $171.62 | 63% |
| Hammonds Plains | 11 | $2,732 | $176.50 | 58% |
| Wentworth | 23 | $2,556 | $225.30 | 44% |
| Chester Grant | 11 | $2,529 | $205.70 | 50% |
| Feltzen South | 21 | $2,483 | $190.43 | 42% |