Porters Lake Airbnb Market Analysis 2025: Short Term Rental Data & Vacation Rental Statistics in Nova Scotia, Canada
Is Airbnb profitable in Porters Lake in 2025? Explore comprehensive Airbnb analytics for Porters Lake, Nova Scotia, Canada to uncover income potential. This 2025 STR market report for Porters Lake, based on AirROI data from April 2024 to March 2025, reveals key trends in the niche market of 25 active listings.
Whether you're considering an Airbnb investment in Porters Lake, optimizing your existing vacation rental, or exploring rental arbitrage opportunities, understanding the Porters Lake Airbnb data is crucial. Navigating the high regulation landscape is key to maximizing your short term rental income potential. Let's dive into the specifics.
Key Porters Lake Airbnb Performance Metrics Overview
Monthly Airbnb Revenue Variations & Income Potential in Porters Lake (2025)
Understanding the monthly revenue variations for Airbnb listings in Porters Lake is key to maximizing your short term rental income potential. Seasonality significantly impacts earnings. Our analysis, based on data from the past 12 months, shows that the peak revenue month for STRs in Porters Lake is typically August, while November often presents the lowest earnings, highlighting opportunities for strategic pricing adjustments during shoulder and low seasons. Explore the typical Airbnb income in Porters Lake across different performance tiers:
- Best-in-class properties (Top 10%) achieve $6,731+ monthly, often utilizing dynamic pricing and superior guest experiences.
- Strong performing properties (Top 25%) earn $4,125 or more, indicating effective management and desirable locations/amenities.
- Typical properties (Median) generate around $2,371 per month, representing the average market performance.
- Entry-level properties (Bottom 25%) see earnings around $1,115, often with potential for optimization.
Average Monthly Airbnb Earnings Trend in Porters Lake
Porters Lake Airbnb Occupancy Rate Trends (2025)
Maximize your bookings by understanding the Porters Lake STR occupancy trends. Seasonal demand shifts significantly influence how often properties are booked. Typically, Augustsees the highest demand (peak season occupancy), while January experiences the lowest (low season). Effective strategies, like adjusting minimum stays or offering promotions, can boost occupancy during slower periods. Here's how different property tiers perform in Porters Lake:
- Best-in-class properties (Top 10%) achieve 78%+ occupancy, indicating high desirability and potentially optimized availability.
- Strong performing properties (Top 25%) maintain 60% or higher occupancy, suggesting good market fit and guest satisfaction.
- Typical properties (Median) have an occupancy rate around 41%.
- Entry-level properties (Bottom 25%) average 22% occupancy, potentially facing higher vacancy.
Average Monthly Occupancy Rate Trend in Porters Lake
Average Daily Rate (ADR) Airbnb Trends in Porters Lake (2025)
Effective short term rental pricing strategy in Porters Lake involves understanding monthly ADR fluctuations. The Average Daily Rate (ADR) for Airbnb in Porters Lake typically peaks in July and dips lowest during February. Leveraging Airbnb dynamic pricing tools or strategies based on this seasonality can significantly boost revenue. Here's a look at the typical nightly rates achieved:
- Best-in-class properties (Top 10%) command rates of $322+ per night, often due to premium features or locations.
- Strong performing properties (Top 25%) achieve nightly rates of $255 or more.
- Typical properties (Median) charge around $136 per night.
- Entry-level properties (Bottom 25%) earn around $86 per night.
Average Daily Rate (ADR) Trend by Month in Porters Lake
Get Live Porters Lake Market Intelligence 👇

Explore Real-time Analytics
Airbnb Seasonality Analysis & Trends in Porters Lake (2025)
Peak Season (August, May, April)
- Revenue averages $4,276 per month
- Occupancy rates average 51.7%
- Daily rates average $181
Shoulder Season
- Revenue averages $3,080 per month
- Occupancy maintains around 46.1%
- Daily rates hold near $167
Low Season (January, September, November)
- Revenue drops to average $1,901 per month
- Occupancy decreases to average 32.2%
- Daily rates adjust to average $162
Seasonality Insights for Porters Lake
- The Airbnb seasonality in Porters Lake shows highly seasonal trends requiring careful strategy. While the sections above show seasonal averages, it's also insightful to look at the extremes:
- During the high season, the absolute peak month showcases Porters Lake's highest earning potential, with monthly revenues capable of climbing to $4,400, occupancy reaching a high of 76.2%, and ADRs peaking at $188.
- Conversely, the slowest single month of the year, typically falling within the low season, marks the market's lowest point. In this month, revenue might dip to $1,707, occupancy could drop to 29.0%, and ADRs may adjust down to $145.
- Understanding both the seasonal averages and these monthly peaks and troughs in revenue, occupancy, and ADR is crucial for maximizing your Airbnb profit potential in Porters Lake.
Seasonal Strategies for Maximizing Profit
- Peak Season: Maximize revenue through premium pricing and potentially longer minimum stays. Ensure high availability.
- Low Season: Offer competitive pricing, special promotions (e.g., extended stay discounts), and flexible cancellation policies. Target off-season travelers like remote workers or budget-conscious guests.
- Shoulder Seasons: Implement dynamic pricing that balances peak and low rates. Target weekend travelers or specific events. Offer slightly more flexible terms than peak season.
- Regularly analyze your own performance against these Porters Lake seasonality benchmarks and adjust your pricing and availability strategy accordingly.
Best Areas for Airbnb Investment in Porters Lake (2025)
Exploring the top neighborhoods for short-term rentals in Porters Lake? This section highlights key areas, outlining why they are attractive for hosts and guests, along with notable local attractions. Consider these locations based on your target guest profile and investment strategy.
| Neighborhood / Area | Why Host Here? (Target Guests & Appeal) | Key Attractions & Landmarks |
|---|---|---|
| Porters Lake Village | A charming and picturesque village with easy access to the lake and outdoor activities. Ideal for families and travelers seeking a peaceful getaway close to nature. | Porters Lake Provincial Park, Shops and cafes in the village, Scenic waterfront views, Local art galleries |
| Porters Lake Provincial Park | A beautiful natural area perfect for outdoor enthusiasts, with hiking, swimming, and camping opportunities. Popular with those looking to escape the city and enjoy nature. | Hiking trails, Picnic areas, Swimming spots, Wildlife watching, Kayaking opportunities |
| Moser River | A tranquil and scenic spot along the Eastern Shore known for its nature and outdoor activities. Great for guests who love outdoor adventures and exploring the coastline. | Moser River hiking trails, Fishing spots, Coastal views, Local wildlife |
| Eastern Shore | A region known for its beautiful coastline and seaside charm. Offers guests a chance to experience the maritime culture and scenic views. | Beaches, Lighthouses, Fishing villages, Seafood restaurants |
| Lawrencetown Beach | Home to one of the best surf spots in Nova Scotia, Lawrencetown attracts surfers and beachgoers. Exciting nightlife and food options available. | Surfing, Beachfront cafes, Walking trails, Community events |
| Lake Echo | A serene community with beautiful lake views, perfect for guests looking for a relaxing retreat not far from Halifax. | Fishing and boating, Nature trails, Community parks |
| Cole Harbour | Close to major amenities in Halifax but still offers a suburban feel. Attractive to families and urban visitors seeking a quieter base. | Cole Harbour Place, Shakespeare-by-the-Sea, Local parks and recreation areas |
| Cherry Brook | A welcoming community with cultural diversity and local charm. It serves as a gateway to various outdoor activities in the nearby provincial parks. | Cultural festivals, Parks and trails, Communal spaces for events |
Understanding Airbnb License Requirements & STR Laws in Porters Lake (2025)
Yes, Porters Lake, Nova Scotia, Canada enforces high STR regulations. Obtaining a license and ensuring compliance is almost certainly required according to current 2025 STR laws. Always verify the latest short term rental regulations and Airbnb license requirements directly with local government authorities for Porters Lake to ensure full compliance before hosting.
(Source: AirROI data, 2025, based on 96% licensed listings)
Top Performing Airbnb Properties in Porters Lake (2025)
Benchmark your potential! Explore examples of top-performing Airbnb properties in Porters Lakebased on Trailing Twelve Month (TTM) revenue. Analyze their characteristics, revenue, occupancy rate, and ADR to understand what drives success in this market.
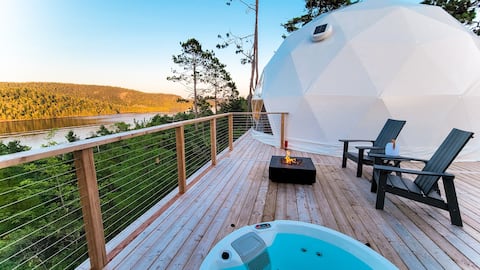
Luxury Glamping Dome 2 - Nalu Retreat & Nordic Spa
Entire Place • 1 bedroom
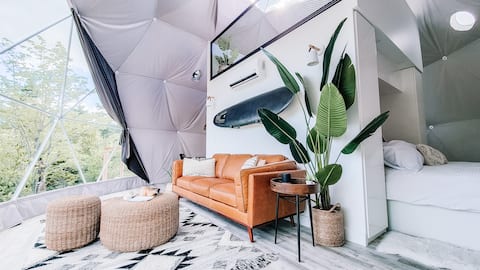
Luxury Glamping Dome 3 - Nalu Nordic Spa
Entire Place • 1 bedroom

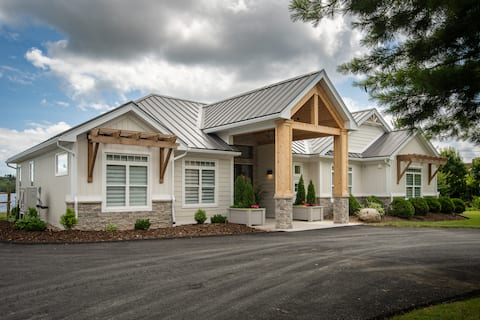
The Porters Lake House
Entire Place • 2 bedrooms
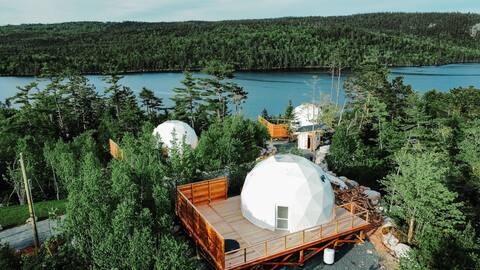
Luxury Glamping Dome 1 - Nalu Nordic Spa
Entire Place • 1 bedroom
Lake front Home on Porters Lake
Entire Place • 3 bedrooms
Mega Dome
Entire Place • 1 bedroom
Note: Performance varies based on location, size, amenities, seasonality, and management quality. Data reflects the past 12 months.
Top Performing Airbnb Hosts in Porters Lake (2025)
Learn from the best! This table showcases top-performing Airbnb hosts in Porters Lake based on the number of properties managed and estimated total revenue over the past year. Analyze their scale and performance metrics.
| Host Name | Properties | Grossing Revenue | Stay Reviews | Avg Rating |
|---|---|---|---|---|
| Nalu | 3 | $224,595 | 64 | 5.00/5.0 |
| Porters | 9 | $135,773 | 342 | 4.67/5.0 |
| Vicky | 1 | $68,544 | 36 | 5.00/5.0 |
| Gillian | 2 | $48,773 | 83 | 4.99/5.0 |
| Host #87530164 | 1 | $35,752 | 4 | 4.75/5.0 |
| Kelly | 1 | $31,670 | 47 | 4.81/5.0 |
| Lisa | 1 | $21,864 | 8 | 4.75/5.0 |
| Rob And Kate | 1 | $17,256 | 41 | 5.00/5.0 |
| Safia | 1 | $16,584 | 21 | 4.43/5.0 |
| Crystal | 1 | $16,524 | 31 | 5.00/5.0 |
Analyzing the strategies of top hosts, such as their property selection, pricing, and guest communication, can offer valuable lessons for optimizing your own Airbnb operations in Porters Lake.
Dive Deeper: Advanced Porters Lake STR Market Data (2025)
Ready to unlock more insights? AirROI provides access to advanced metrics and comprehensive Airbnb data for Porters Lake. Explore detailed analytics beyond this report to refine your investment strategy, optimize pricing, and maximize your vacation rental profits.
Explore Advanced MetricsPorters Lake Short-Term Rental Market Composition (2025): Property & Room Types
Room Type Distribution
Property Type Distribution
Market Composition Insights for Porters Lake
- The Porters Lake Airbnb market composition is heavily skewed towards Entire Home/Apt listings, which make up 96% of the 25 active rentals. This indicates strong guest preference for privacy and space.
- Looking at the property type distribution in Porters Lake, Outdoor/Unique properties are the most common (36%), reflecting the local real estate landscape.
- Houses represent a significant 20% portion, catering likely to families or larger groups.
- The presence of 8% Hotel/Boutique listings indicates integration with traditional hospitality.
- Smaller segments like others (combined 4.0%) offer potential for unique stay experiences.
Porters Lake Airbnb Room Capacity Analysis (2025): Bedroom Distribution
Distribution of Listings by Number of Bedrooms
Room Capacity Insights for Porters Lake
- The dominant room capacity in Porters Lake is 1 bedroom listings, making up 56% of the market. This suggests a strong demand for properties suitable for couples or solo travelers.
- Together, 1 bedroom and 2 bedrooms properties represent 80.0% of the active Airbnb listings in Porters Lake, indicating a high concentration in these sizes.
- With over half the market (56%) consisting of studios or 1-bedroom units, Porters Lake is particularly well-suited for individuals or couples.
Porters Lake Vacation Rental Guest Capacity Trends (2025)
Distribution of Listings by Guest Capacity
Guest Capacity Insights for Porters Lake
- The most common guest capacity trend in Porters Lake vacation rentals is listings accommodating 4 guests (40%). This suggests the primary traveler segment is likely small families or groups.
- Properties designed for 4 guests and 2 guests dominate the Porters Lake STR market, accounting for 80.0% of listings.
- 16.0% of properties accommodate 6+ guests, serving the market segment for larger families or group travel in Porters Lake.
- On average, properties in Porters Lake are equipped to host 3.4 guests.
Porters Lake Airbnb Booking Patterns (2025): Available vs. Booked Days
Available Days Distribution
Booked Days Distribution
Booking Pattern Insights for Porters Lake
- The most common availability pattern in Porters Lake falls within the 181-270 days range, representing 64% of listings. This suggests many properties have significant open periods on their calendars.
- Approximately 80.0% of listings show high availability (181+ days open annually), indicating potential for increased bookings or specific owner usage patterns.
- For booked days, the 91-180 days range is most frequent in Porters Lake (64%), reflecting common guest stay durations or potential owner blocking patterns.
- A notable 20.0% of properties secure long booking periods (181+ days booked per year), highlighting successful long-term rental strategies or significant owner usage.
Porters Lake Airbnb Minimum Stay Requirements Analysis
Distribution of Listings by Minimum Night Requirement
1 Night
15 listings
60% of total
2 Nights
3 listings
12% of total
3 Nights
1 listings
4% of total
4-6 Nights
4 listings
16% of total
7-29 Nights
1 listings
4% of total
30+ Nights
1 listings
4% of total
Key Insights
- The most prevalent minimum stay requirement in Porters Lake is 1 Night, adopted by 60% of listings. This highlights the market's preference for shorter, flexible bookings.
- A strong majority (72.0%) of the Porters Lake Airbnb data shows acceptance of very short stays (1-2 nights), indicating a dynamic, high-turnover market.
Recommendations
- Align with the market by considering a 1 Night minimum stay, as 60% of Porters Lake hosts use this setting.
- Adjust minimum nights based on seasonality – potentially shorter during low season and longer during peak demand periods in Porters Lake.
Porters Lake Airbnb Cancellation Policy Trends Analysis (2025)
Flexible
11 listings
45.8% of total
Moderate
5 listings
20.8% of total
Strict
8 listings
33.3% of total
Cancellation Policy Insights for Porters Lake
- The prevailing Airbnb cancellation policy trend in Porters Lake is Flexible, used by 45.8% of listings.
- There's a relatively balanced mix between guest-friendly (66.6%) and stricter (33.3%) policies, offering choices for different guest needs.
Recommendations for Hosts
- Consider adopting a Flexible policy to align with the 45.8% market standard in Porters Lake.
- With 33.3% using Strict terms, this is a viable option in Porters Lake, particularly for high-value properties or during peak demand periods.
- Regularly review your cancellation policy against competitors and market demand shifts in Porters Lake.
Porters Lake STR Booking Lead Time Analysis (2025)
Average Booking Lead Time by Month
Booking Lead Time Insights for Porters Lake
- The overall average booking lead time for vacation rentals in Porters Lake is 41 days.
- Guests book furthest in advance for stays during August (average 82 days), likely coinciding with peak travel demand or local events.
- The shortest booking windows occur for stays in March (average 11 days), indicating more last-minute travel plans during this time.
- Seasonally, Summer (78 days avg.) sees the longest lead times, while Winter (14 days avg.) has the shortest, reflecting typical travel planning cycles.
Recommendations for Hosts
- Use the overall average lead time (41 days) as a baseline for your pricing and availability strategy in Porters Lake.
- For August stays, consider implementing length-of-stay discounts or slightly higher rates for bookings made less than 82 days out to capitalize on advance planning.
- During March, focus on last-minute booking availability and promotions, as guests book with very short notice (11 days avg.).
- Target marketing efforts for the Summer season well in advance (at least 78 days) to capture early planners.
- Monitor your own booking lead times against these Porters Lake averages to identify opportunities for dynamic pricing adjustments.
Popular & Essential Airbnb Amenities in Porters Lake (2025)
Amenity Prevalence
Amenity Insights for Porters Lake
- Essential amenities in Porters Lake that guests expect include: Free parking on premises, Coffee maker, Dishes and silverware, Essentials, Fire pit, Cooking basics, Smoke alarm, Kitchen. Lacking these (any) could significantly impact bookings.
- Popular amenities like Heating, Fire extinguisher are common but not universal. Offering these can provide a competitive edge.
Recommendations for Hosts
- Ensure your listing includes all essential amenities for Porters Lake: Free parking on premises, Coffee maker, Dishes and silverware, Essentials, Fire pit, Cooking basics, Smoke alarm, Kitchen.
- Prioritize adding missing essentials: Essentials, Fire pit, Cooking basics, Smoke alarm, Kitchen.
- Consider adding popular differentiators like Heating or Fire extinguisher to increase appeal.
- Highlight unique or less common amenities you offer (e.g., hot tub, dedicated workspace, EV charger) in your listing description and photos.
- Regularly check competitor amenities in Porters Lake to stay competitive.
Porters Lake Airbnb Guest Demographics & Profile Analysis (2025)
Guest Profile Summary for Porters Lake
- The typical guest profile for Airbnb in Porters Lake consists of primarily domestic travelers (86%), often arriving from nearby Halifax, typically belonging to the Post-2000s (Gen Z/Alpha) group (50%), primarily speaking English or French.
- Domestic travelers account for 85.5% of guests.
- Key international markets include Canada (85.5%) and United States (8.2%).
- Top languages spoken are English (65.6%) followed by French (18.9%).
- A significant demographic segment is the Post-2000s (Gen Z/Alpha) group, representing 50% of guests.
Recommendations for Hosts
- Target domestic marketing efforts towards travelers from Halifax and Dartmouth.
- Tailor amenities and listing descriptions to appeal to the dominant Post-2000s (Gen Z/Alpha) demographic (e.g., highlight fast WiFi, smart home features, local guides).
- Highlight unique local experiences or amenities relevant to the primary guest profile.
- Consider seasonal promotions aligned with peak travel times for key origin markets.
Nearby Short-Term Rental Market Comparison
How does the Porters Lake Airbnb market stack up against its neighbors? Compare key performance metrics like average monthly revenue, ADR, and occupancy rates in surrounding areas to understand the broader regional STR landscape.
| Market | Active Properties | Monthly Revenue | Daily Rate | Avg. Occupancy |
|---|---|---|---|---|
| Boutiliers Point | 12 | $4,123 | $220.91 | 59% |
| Lakelands | 11 | $3,923 | $273.47 | 48% |
| Hunts Point | 14 | $3,820 | $277.48 | 43% |
| Chittenden | 17 | $3,517 | $287.26 | 42% |
| Queensland | 14 | $3,355 | $264.87 | 55% |
| Hammonds Plains | 11 | $2,732 | $176.50 | 58% |
| Wentworth | 23 | $2,556 | $225.30 | 44% |
| Chester Grant | 11 | $2,529 | $205.70 | 50% |
| Feltzen South | 21 | $2,483 | $190.43 | 42% |
| Port Williams | 16 | $2,478 | $245.95 | 52% |