Feltzen South Airbnb Market Analysis 2025: Short Term Rental Data & Vacation Rental Statistics in Nova Scotia, Canada
Is Airbnb profitable in Feltzen South in 2025? Explore comprehensive Airbnb analytics for Feltzen South, Nova Scotia, Canada to uncover income potential. This 2025 STR market report for Feltzen South, based on AirROI data from April 2024 to March 2025, reveals key trends in the niche market of 21 active listings.
Whether you're considering an Airbnb investment in Feltzen South, optimizing your existing vacation rental, or exploring rental arbitrage opportunities, understanding the Feltzen South Airbnb data is crucial. Navigating the high regulation landscape is key to maximizing your short term rental income potential. Let's dive into the specifics.
Key Feltzen South Airbnb Performance Metrics Overview
Monthly Airbnb Revenue Variations & Income Potential in Feltzen South (2025)
Understanding the monthly revenue variations for Airbnb listings in Feltzen South is key to maximizing your short term rental income potential. Seasonality significantly impacts earnings. Our analysis, based on data from the past 12 months, shows that the peak revenue month for STRs in Feltzen South is typically August, while November often presents the lowest earnings, highlighting opportunities for strategic pricing adjustments during shoulder and low seasons. Explore the typical Airbnb income in Feltzen South across different performance tiers:
- Best-in-class properties (Top 10%) achieve $5,848+ monthly, often utilizing dynamic pricing and superior guest experiences.
- Strong performing properties (Top 25%) earn $4,514 or more, indicating effective management and desirable locations/amenities.
- Typical properties (Median) generate around $2,529 per month, representing the average market performance.
- Entry-level properties (Bottom 25%) see earnings around $1,083, often with potential for optimization.
Average Monthly Airbnb Earnings Trend in Feltzen South
Feltzen South Airbnb Occupancy Rate Trends (2025)
Maximize your bookings by understanding the Feltzen South STR occupancy trends. Seasonal demand shifts significantly influence how often properties are booked. Typically, Augustsees the highest demand (peak season occupancy), while November experiences the lowest (low season). Effective strategies, like adjusting minimum stays or offering promotions, can boost occupancy during slower periods. Here's how different property tiers perform in Feltzen South:
- Best-in-class properties (Top 10%) achieve 73%+ occupancy, indicating high desirability and potentially optimized availability.
- Strong performing properties (Top 25%) maintain 63% or higher occupancy, suggesting good market fit and guest satisfaction.
- Typical properties (Median) have an occupancy rate around 39%.
- Entry-level properties (Bottom 25%) average 18% occupancy, potentially facing higher vacancy.
Average Monthly Occupancy Rate Trend in Feltzen South
Average Daily Rate (ADR) Airbnb Trends in Feltzen South (2025)
Effective short term rental pricing strategy in Feltzen South involves understanding monthly ADR fluctuations. The Average Daily Rate (ADR) for Airbnb in Feltzen South typically peaks in August and dips lowest during February. Leveraging Airbnb dynamic pricing tools or strategies based on this seasonality can significantly boost revenue. Here's a look at the typical nightly rates achieved:
- Best-in-class properties (Top 10%) command rates of $296+ per night, often due to premium features or locations.
- Strong performing properties (Top 25%) achieve nightly rates of $216 or more.
- Typical properties (Median) charge around $129 per night.
- Entry-level properties (Bottom 25%) earn around $68 per night.
Average Daily Rate (ADR) Trend by Month in Feltzen South
Get Live Feltzen South Market Intelligence 👇

Explore Real-time Analytics
Airbnb Seasonality Analysis & Trends in Feltzen South (2025)
Peak Season (August, July, May)
- Revenue averages $4,867 per month
- Occupancy rates average 56.0%
- Daily rates average $163
Shoulder Season
- Revenue averages $2,935 per month
- Occupancy maintains around 39.6%
- Daily rates hold near $153
Low Season (February, March, November)
- Revenue drops to average $1,439 per month
- Occupancy decreases to average 32.8%
- Daily rates adjust to average $147
Seasonality Insights for Feltzen South
- The Airbnb seasonality in Feltzen South shows highly seasonal trends requiring careful strategy. While the sections above show seasonal averages, it's also insightful to look at the extremes:
- During the high season, the absolute peak month showcases Feltzen South's highest earning potential, with monthly revenues capable of climbing to $5,743, occupancy reaching a high of 70.5%, and ADRs peaking at $172.
- Conversely, the slowest single month of the year, typically falling within the low season, marks the market's lowest point. In this month, revenue might dip to $1,239, occupancy could drop to 21.8%, and ADRs may adjust down to $138.
- Understanding both the seasonal averages and these monthly peaks and troughs in revenue, occupancy, and ADR is crucial for maximizing your Airbnb profit potential in Feltzen South.
Seasonal Strategies for Maximizing Profit
- Peak Season: Maximize revenue through premium pricing and potentially longer minimum stays. Ensure high availability.
- Low Season: Offer competitive pricing, special promotions (e.g., extended stay discounts), and flexible cancellation policies. Target off-season travelers like remote workers or budget-conscious guests.
- Shoulder Seasons: Implement dynamic pricing that balances peak and low rates. Target weekend travelers or specific events. Offer slightly more flexible terms than peak season.
- Regularly analyze your own performance against these Feltzen South seasonality benchmarks and adjust your pricing and availability strategy accordingly.
Best Areas for Airbnb Investment in Feltzen South (2025)
Exploring the top neighborhoods for short-term rentals in Feltzen South? This section highlights key areas, outlining why they are attractive for hosts and guests, along with notable local attractions. Consider these locations based on your target guest profile and investment strategy.
| Neighborhood / Area | Why Host Here? (Target Guests & Appeal) | Key Attractions & Landmarks |
|---|---|---|
| Lunenburg | A UNESCO World Heritage Site known for its well-preserved historic buildings and vibrant arts scene. Attracts tourists interested in culture and history, offering unique architecture and waterfront views. | Lunenburg Waterfront, Fisheries Museum of the Atlantic, Bluenose II, Ironworks Distillery, St. John's Anglican Church |
| Mahone Bay | Known for its picturesque harbor and charming shops, Mahone Bay offers a quaint atmosphere that appeals to tourists looking for relaxation and local crafts. Perfect for those seeking scenic views and cozy accommodations. | Mahone Bay Marina, Mahone Bay Museum, St. James' United Church, shops and galleries, Lighthouse Route |
| Chester | A charming coastal village with a strong arts community and beautiful scenery. Chester is popular with families and those looking for outdoor activities, making it a great summer destination. | Chester Golf Club, Chester Playhouse, Chester Marina, biking trails, local shops and cafes |
| Bridgewater | The largest town in the area, Bridgewater serves as a commercial hub, providing amenities and attractions for visitors. It's ideal for travelers looking for convenience and local culture. | Bridgewater Mall, Kinsmen Beach, Blockhouse Hill Park, local dining options, LaHave River |
| Greenwood | A popular destination for outdoor enthusiasts, Greenwood offers activities such as hiking, biking, and water sports. It's perfect for those looking for adventure and nature-centric experiences. | Greenwood Military Aviation Museum, local parks, hiking trails, Lake Rossignol, water sports opportunities |
| Liverpool | Known for its maritime history and cultural events, Liverpool attracts visitors interested in local history and festivals. The town offers a mix of natural beauty and cultural experiences. | Queens County Museum, Liverpool Heritage Museum, local art galleries, Kejimkujik National Park, White Point Beach |
| Caledonia | A quiet village surrounded by nature, Caledonia is perfect for those seeking a peaceful retreat away from the hustle and bustle of city life. Great for nature lovers and relaxation. | local parks, hiking trails, fishing spots, Caledonia Railway Trail, natural scenery |
| Shelburne | Known for its rich shipbuilding history and quaint waterfront, Shelburne attracts tourists with a love for history and scenic coastlines. The town hosts various arts and culture festivals. | Shelburne County Museum, The Dory Shop, Shelburne Harbour, local dining options, Summer Festivals |
Understanding Airbnb License Requirements & STR Laws in Feltzen South (2025)
Yes, Feltzen South, Nova Scotia, Canada enforces high STR regulations. Obtaining a license and ensuring compliance is almost certainly required according to current 2025 STR laws. Always verify the latest short term rental regulations and Airbnb license requirements directly with local government authorities for Feltzen South to ensure full compliance before hosting.
(Source: AirROI data, 2025, based on 90% licensed listings)
Top Performing Airbnb Properties in Feltzen South (2025)
Benchmark your potential! Explore examples of top-performing Airbnb properties in Feltzen Southbased on Trailing Twelve Month (TTM) revenue. Analyze their characteristics, revenue, occupancy rate, and ADR to understand what drives success in this market.

Ocean View Villa with Hot Tub and Movie Theatre
Entire Place • 4 bedrooms
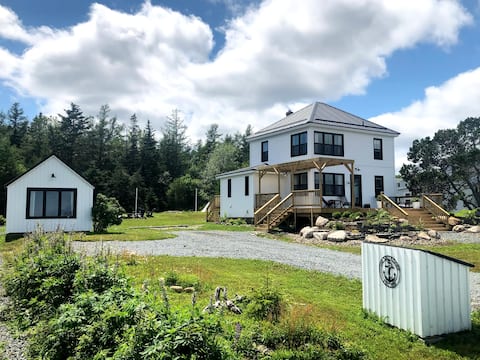
Luxury Oceanfront Cottage-Rose Bay, Lunenburg-#1/2
Entire Place • 2 bedrooms

Luxury Oceanfront Cottage-Rose Bay, Lunenburg-#2/2
Entire Place • 2 bedrooms
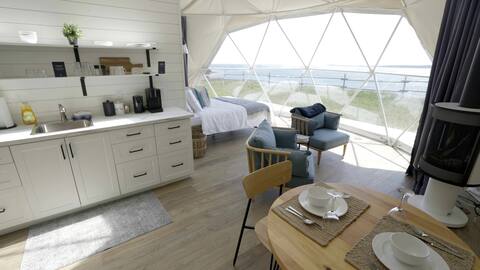
Glamping Domes near Lunenburg: DriftWood (#3 of 4)
Entire Place • 1 bedroom

Glamping Domes near Lunenburg: StarGazer (#2 of 4)
Entire Place • 1 bedroom
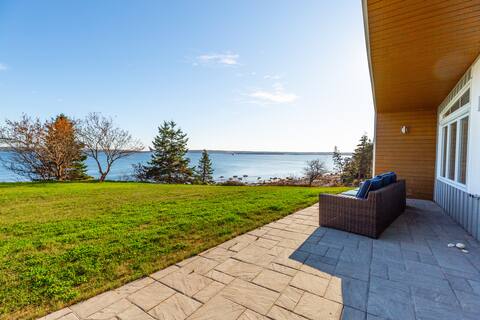
Professionally designed holiday home on the beach
Entire Place • 3 bedrooms
Note: Performance varies based on location, size, amenities, seasonality, and management quality. Data reflects the past 12 months.
Top Performing Airbnb Hosts in Feltzen South (2025)
Learn from the best! This table showcases top-performing Airbnb hosts in Feltzen South based on the number of properties managed and estimated total revenue over the past year. Analyze their scale and performance metrics.
| Host Name | Properties | Grossing Revenue | Stay Reviews | Avg Rating |
|---|---|---|---|---|
| Mark | 6 | $285,533 | 363 | 4.89/5.0 |
| Nadia | 3 | $102,606 | 92 | 4.89/5.0 |
| Jordan | 1 | $97,932 | 73 | 4.86/5.0 |
| Brad And Jaclyn | 1 | $29,430 | 107 | 4.89/5.0 |
| Michael | 1 | $29,360 | 9 | 4.89/5.0 |
| Jeanne | 1 | $22,449 | 6 | 4.67/5.0 |
| Christopher | 1 | $20,829 | 146 | 4.99/5.0 |
| Holly | 1 | $18,447 | 39 | 5.00/5.0 |
| Devin | 2 | $9,172 | 106 | 4.76/5.0 |
| Katie | 3 | $7,935 | 27 | 3.20/5.0 |
Analyzing the strategies of top hosts, such as their property selection, pricing, and guest communication, can offer valuable lessons for optimizing your own Airbnb operations in Feltzen South.
Dive Deeper: Advanced Feltzen South STR Market Data (2025)
Ready to unlock more insights? AirROI provides access to advanced metrics and comprehensive Airbnb data for Feltzen South. Explore detailed analytics beyond this report to refine your investment strategy, optimize pricing, and maximize your vacation rental profits.
Explore Advanced MetricsFeltzen South Short-Term Rental Market Composition (2025): Property & Room Types
Room Type Distribution
Property Type Distribution
Market Composition Insights for Feltzen South
- The Feltzen South Airbnb market composition is heavily skewed towards Entire Home/Apt listings, which make up 95.2% of the 21 active rentals. This indicates strong guest preference for privacy and space.
- Looking at the property type distribution in Feltzen South, House properties are the most common (57.1%), reflecting the local real estate landscape.
- Houses represent a significant 57.1% portion, catering likely to families or larger groups.
Feltzen South Airbnb Room Capacity Analysis (2025): Bedroom Distribution
Distribution of Listings by Number of Bedrooms
Room Capacity Insights for Feltzen South
- The dominant room capacity in Feltzen South is 1 bedroom listings, making up 42.9% of the market. This suggests a strong demand for properties suitable for couples or solo travelers.
- Together, 1 bedroom and 3 bedrooms properties represent 71.5% of the active Airbnb listings in Feltzen South, indicating a high concentration in these sizes.
- A significant 33.4% of listings offer 3+ bedrooms, catering to larger groups and families seeking more space in Feltzen South.
Feltzen South Vacation Rental Guest Capacity Trends (2025)
Distribution of Listings by Guest Capacity
Guest Capacity Insights for Feltzen South
- The most common guest capacity trend in Feltzen South vacation rentals is listings accommodating 4 guests (38.1%). This suggests the primary traveler segment is likely small families or groups.
- Properties designed for 4 guests and 6 guests dominate the Feltzen South STR market, accounting for 66.7% of listings.
- 33.4% of properties accommodate 6+ guests, serving the market segment for larger families or group travel in Feltzen South.
- On average, properties in Feltzen South are equipped to host 4.3 guests.
Feltzen South Airbnb Booking Patterns (2025): Available vs. Booked Days
Available Days Distribution
Booked Days Distribution
Booking Pattern Insights for Feltzen South
- The most common availability pattern in Feltzen South falls within the 271-366 days range, representing 38.1% of listings. This suggests many properties have significant open periods on their calendars.
- Approximately 61.9% of listings show high availability (181+ days open annually), indicating potential for increased bookings or specific owner usage patterns.
- For booked days, the 181-270 days range is most frequent in Feltzen South (38.1%), reflecting common guest stay durations or potential owner blocking patterns.
- A notable 38.1% of properties secure long booking periods (181+ days booked per year), highlighting successful long-term rental strategies or significant owner usage.
Feltzen South Airbnb Minimum Stay Requirements Analysis
Distribution of Listings by Minimum Night Requirement
1 Night
7 listings
35% of total
2 Nights
9 listings
45% of total
3 Nights
1 listings
5% of total
4-6 Nights
1 listings
5% of total
7-29 Nights
1 listings
5% of total
30+ Nights
1 listings
5% of total
Key Insights
- The most prevalent minimum stay requirement in Feltzen South is 2 Nights, adopted by 45% of listings. This highlights the market's preference for shorter, flexible bookings.
- A strong majority (80.0%) of the Feltzen South Airbnb data shows acceptance of very short stays (1-2 nights), indicating a dynamic, high-turnover market.
Recommendations
- Align with the market by considering a 2 Nights minimum stay, as 45% of Feltzen South hosts use this setting.
- Adjust minimum nights based on seasonality – potentially shorter during low season and longer during peak demand periods in Feltzen South.
Feltzen South Airbnb Cancellation Policy Trends Analysis (2025)
Super Strict 30 Days
1 listings
5% of total
Flexible
2 listings
10% of total
Moderate
13 listings
65% of total
Firm
4 listings
20% of total
Cancellation Policy Insights for Feltzen South
- The prevailing Airbnb cancellation policy trend in Feltzen South is Moderate, used by 65% of listings.
- The market strongly favors guest-friendly terms, with 75.0% of listings offering Flexible or Moderate policies. This suggests guests in Feltzen South may expect booking flexibility.
Recommendations for Hosts
- Consider adopting a Moderate policy to align with the 65% market standard in Feltzen South.
- Regularly review your cancellation policy against competitors and market demand shifts in Feltzen South.
Feltzen South STR Booking Lead Time Analysis (2025)
Average Booking Lead Time by Month
Booking Lead Time Insights for Feltzen South
- The overall average booking lead time for vacation rentals in Feltzen South is 68 days.
- Guests book furthest in advance for stays during September (average 115 days), likely coinciding with peak travel demand or local events.
- The shortest booking windows occur for stays in March (average 23 days), indicating more last-minute travel plans during this time.
- Seasonally, Summer (100 days avg.) sees the longest lead times, while Winter (40 days avg.) has the shortest, reflecting typical travel planning cycles.
Recommendations for Hosts
- Use the overall average lead time (68 days) as a baseline for your pricing and availability strategy in Feltzen South.
- For September stays, consider implementing length-of-stay discounts or slightly higher rates for bookings made less than 115 days out to capitalize on advance planning.
- Target marketing efforts for the Summer season well in advance (at least 100 days) to capture early planners.
- Monitor your own booking lead times against these Feltzen South averages to identify opportunities for dynamic pricing adjustments.
Popular & Essential Airbnb Amenities in Feltzen South (2025)
Amenity Prevalence
Amenity Insights for Feltzen South
- Essential amenities in Feltzen South that guests expect include: Wifi, Heating, Kitchen, Smoke alarm, Free parking on premises, Cooking basics, Essentials. Lacking these (any) could significantly impact bookings.
- Popular amenities like Hot water, Coffee maker, Fire extinguisher are common but not universal. Offering these can provide a competitive edge.
Recommendations for Hosts
- Ensure your listing includes all essential amenities for Feltzen South: Wifi, Heating, Kitchen, Smoke alarm, Free parking on premises, Cooking basics, Essentials.
- Prioritize adding missing essentials: Free parking on premises, Cooking basics, Essentials.
- Consider adding popular differentiators like Hot water or Coffee maker to increase appeal.
- Highlight unique or less common amenities you offer (e.g., hot tub, dedicated workspace, EV charger) in your listing description and photos.
- Regularly check competitor amenities in Feltzen South to stay competitive.
Feltzen South Airbnb Guest Demographics & Profile Analysis (2025)
Guest Profile Summary for Feltzen South
- The typical guest profile for Airbnb in Feltzen South consists of primarily domestic travelers (74%), often arriving from nearby Halifax, typically belonging to the Post-2000s (Gen Z/Alpha) group (50%), primarily speaking English or French.
- Domestic travelers account for 74.3% of guests.
- Key international markets include Canada (74.3%) and United States (20.4%).
- Top languages spoken are English (67.4%) followed by French (18.9%).
- A significant demographic segment is the Post-2000s (Gen Z/Alpha) group, representing 50% of guests.
Recommendations for Hosts
- Target domestic marketing efforts towards travelers from Halifax and Toronto.
- Tailor amenities and listing descriptions to appeal to the dominant Post-2000s (Gen Z/Alpha) demographic (e.g., highlight fast WiFi, smart home features, local guides).
- Highlight unique local experiences or amenities relevant to the primary guest profile.
- Consider seasonal promotions aligned with peak travel times for key origin markets.
Nearby Short-Term Rental Market Comparison
How does the Feltzen South Airbnb market stack up against its neighbors? Compare key performance metrics like average monthly revenue, ADR, and occupancy rates in surrounding areas to understand the broader regional STR landscape.
| Market | Active Properties | Monthly Revenue | Daily Rate | Avg. Occupancy |
|---|---|---|---|---|
| Boutiliers Point | 12 | $4,123 | $220.91 | 59% |
| Lakelands | 11 | $3,923 | $273.47 | 48% |
| Hunts Point | 14 | $3,820 | $277.48 | 43% |
| Chittenden | 17 | $3,517 | $287.26 | 42% |
| Queensland | 14 | $3,355 | $264.87 | 55% |
| Kings County | 10 | $3,052 | $171.62 | 63% |
| Hammonds Plains | 11 | $2,732 | $176.50 | 58% |
| Wentworth | 23 | $2,556 | $225.30 | 44% |
| Chester Grant | 11 | $2,529 | $205.70 | 50% |
| Port Williams | 16 | $2,478 | $245.95 | 52% |