Woody Point Airbnb Market Analysis 2025: Short Term Rental Data & Vacation Rental Statistics in Newfoundland and Labrador, Canada
Is Airbnb profitable in Woody Point in 2025? Explore comprehensive Airbnb analytics for Woody Point, Newfoundland and Labrador, Canada to uncover income potential. This 2025 STR market report for Woody Point, based on AirROI data from April 2024 to March 2025, reveals key trends in the niche market of 31 active listings.
Whether you're considering an Airbnb investment in Woody Point, optimizing your existing vacation rental, or exploring rental arbitrage opportunities, understanding the Woody Point Airbnb data is crucial. Navigating the high regulation landscape is key to maximizing your short term rental income potential. Let's dive into the specifics.
Key Woody Point Airbnb Performance Metrics Overview
Monthly Airbnb Revenue Variations & Income Potential in Woody Point (2025)
Understanding the monthly revenue variations for Airbnb listings in Woody Point is key to maximizing your short term rental income potential. Seasonality significantly impacts earnings. Our analysis, based on data from the past 12 months, shows that the peak revenue month for STRs in Woody Point is typically July, while January often presents the lowest earnings, highlighting opportunities for strategic pricing adjustments during shoulder and low seasons. Explore the typical Airbnb income in Woody Point across different performance tiers:
- Best-in-class properties (Top 10%) achieve $4,885+ monthly, often utilizing dynamic pricing and superior guest experiences.
- Strong performing properties (Top 25%) earn $2,734 or more, indicating effective management and desirable locations/amenities.
- Typical properties (Median) generate around $1,609 per month, representing the average market performance.
- Entry-level properties (Bottom 25%) see earnings around $803, often with potential for optimization.
Average Monthly Airbnb Earnings Trend in Woody Point
Woody Point Airbnb Occupancy Rate Trends (2025)
Maximize your bookings by understanding the Woody Point STR occupancy trends. Seasonal demand shifts significantly influence how often properties are booked. Typically, Julysees the highest demand (peak season occupancy), while January experiences the lowest (low season). Effective strategies, like adjusting minimum stays or offering promotions, can boost occupancy during slower periods. Here's how different property tiers perform in Woody Point:
- Best-in-class properties (Top 10%) achieve 66%+ occupancy, indicating high desirability and potentially optimized availability.
- Strong performing properties (Top 25%) maintain 46% or higher occupancy, suggesting good market fit and guest satisfaction.
- Typical properties (Median) have an occupancy rate around 31%.
- Entry-level properties (Bottom 25%) average 13% occupancy, potentially facing higher vacancy.
Average Monthly Occupancy Rate Trend in Woody Point
Average Daily Rate (ADR) Airbnb Trends in Woody Point (2025)
Effective short term rental pricing strategy in Woody Point involves understanding monthly ADR fluctuations. The Average Daily Rate (ADR) for Airbnb in Woody Point typically peaks in November and dips lowest during September. Leveraging Airbnb dynamic pricing tools or strategies based on this seasonality can significantly boost revenue. Here's a look at the typical nightly rates achieved:
- Best-in-class properties (Top 10%) command rates of $375+ per night, often due to premium features or locations.
- Strong performing properties (Top 25%) achieve nightly rates of $246 or more.
- Typical properties (Median) charge around $163 per night.
- Entry-level properties (Bottom 25%) earn around $129 per night.
Average Daily Rate (ADR) Trend by Month in Woody Point
Get Live Woody Point Market Intelligence 👇

Explore Real-time Analytics
Airbnb Seasonality Analysis & Trends in Woody Point (2025)
Peak Season (July, August, June)
- Revenue averages $3,188 per month
- Occupancy rates average 45.3%
- Daily rates average $212
Shoulder Season
- Revenue averages $1,963 per month
- Occupancy maintains around 31.1%
- Daily rates hold near $211
Low Season (January, February, November)
- Revenue drops to average $1,172 per month
- Occupancy decreases to average 23.6%
- Daily rates adjust to average $214
Seasonality Insights for Woody Point
- The Airbnb seasonality in Woody Point shows highly seasonal trends requiring careful strategy. While the sections above show seasonal averages, it's also insightful to look at the extremes:
- During the high season, the absolute peak month showcases Woody Point's highest earning potential, with monthly revenues capable of climbing to $3,481, occupancy reaching a high of 51.3%, and ADRs peaking at $218.
- Conversely, the slowest single month of the year, typically falling within the low season, marks the market's lowest point. In this month, revenue might dip to $1,006, occupancy could drop to 19.3%, and ADRs may adjust down to $208.
- Understanding both the seasonal averages and these monthly peaks and troughs in revenue, occupancy, and ADR is crucial for maximizing your Airbnb profit potential in Woody Point.
Seasonal Strategies for Maximizing Profit
- Peak Season: Maximize revenue through premium pricing and potentially longer minimum stays. Ensure high availability.
- Low Season: Offer competitive pricing, special promotions (e.g., extended stay discounts), and flexible cancellation policies. Target off-season travelers like remote workers or budget-conscious guests.
- Shoulder Seasons: Implement dynamic pricing that balances peak and low rates. Target weekend travelers or specific events. Offer slightly more flexible terms than peak season.
- Regularly analyze your own performance against these Woody Point seasonality benchmarks and adjust your pricing and availability strategy accordingly.
Best Areas for Airbnb Investment in Woody Point (2025)
Exploring the top neighborhoods for short-term rentals in Woody Point? This section highlights key areas, outlining why they are attractive for hosts and guests, along with notable local attractions. Consider these locations based on your target guest profile and investment strategy.
| Neighborhood / Area | Why Host Here? (Target Guests & Appeal) | Key Attractions & Landmarks |
|---|---|---|
| Summerside | A charming community with scenic views and a beautiful coastline, perfect for tourists looking to experience the natural beauty of Newfoundland. Ideal for all-season outdoor activities like hiking and snow sports. | Bonavista Peninsula, Dancing Moose Cafe, Skerwink Trail, Rugged Beauty Scenic Drive, Bays of Islands |
| Trinity | A historic town known for its preserved colonial architecture and rich history. Popular for visitors interested in heritage and culture, with numerous festivals throughout the year. | Trinity Historical Sites, Trinity Pageant, Two Rivers Eco-Adventure, The Rising Tide Theatre, The Government House |
| Cape Bonavista | Famous for its stunning coastal cliffs and historic lighthouse, this area attracts nature lovers and photographers. Great for whale watching and exploring the natural landscape. | Cape Bonavista Lighthouse, Bonavista Historic Town, Dungeon Provincial Park, Pearl's Restaurant, Cape Shore Trails |
| Fogo Island | Known for its unique cultural heritage and breathtaking scenery, Fogo Island is a popular destination for tourists seeking an authentic Newfoundland experience, with distinctive architecture and communities. | Fogo Island Inn, The Doctor’s House, Brimstone Head, Fogo Island Arts, Change Islands |
| Bonavista | A picturesque coastal town with rich history and beautiful landscapes, appealing to tourists interested in exploring the rugged Newfoundland coastline and cultural heritage. | Bonavista Lighthouse, Newfoundland's east coast, Ryan's and Co. Restaurant, Bonavista Museum, The Discovery Trail |
| St. John's | As the capital city of Newfoundland and Labrador, St. John's offers vibrant nightlife, historical sites, and a bustling downtown atmosphere. It’s the heart of the province's culture and activity. | Signal Hill, Cape Spear, The Rooms, George Street, Quidi Vidi Village |
| Gander | A former military base turned tourist destination, Gander is ideal for history buffs and those wanting to experience Newfoundland's hospitality. Lots of outdoor activities year-round. | Silent Witness Memorial, Little Harbour Marina, Thomas Howe Demonstration Forest, Gander Heritage Memorial Park, North Atlantic Aviation Museum |
| Explorers Coast | A stunning location offering unparalleled ocean views and opportunities for adventure tourism, ideal for those looking to host visitors eager to explore Newfoundland's wilderness. | Terra Nova National Park, Wildlife Watching, Whale Watching Tours, Hiking Trails, Kayaking Adventures |
Understanding Airbnb License Requirements & STR Laws in Woody Point (2025)
Yes, Woody Point, Newfoundland and Labrador, Canada enforces high STR regulations. Obtaining a license and ensuring compliance is almost certainly required according to current 2025 STR laws. Always verify the latest short term rental regulations and Airbnb license requirements directly with local government authorities for Woody Point to ensure full compliance before hosting.
(Source: AirROI data, 2025, based on 55% licensed listings)
Top Performing Airbnb Properties in Woody Point (2025)
Benchmark your potential! Explore examples of top-performing Airbnb properties in Woody Pointbased on Trailing Twelve Month (TTM) revenue. Analyze their characteristics, revenue, occupancy rate, and ADR to understand what drives success in this market.
Ravensbrook Chalet
Entire Place • 4 bedrooms
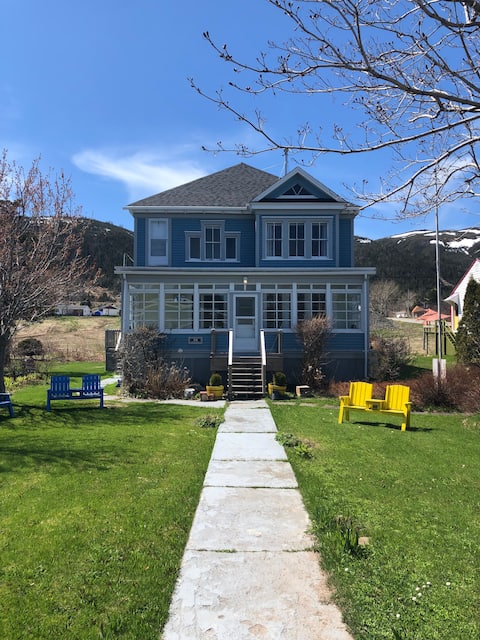
The Robert’s House
Entire Place • 4 bedrooms
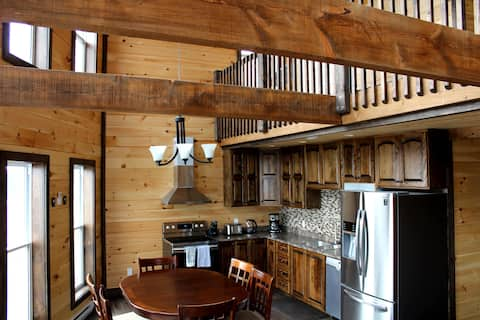
Perfectly located home in the heart of Gros Morne
Entire Place • 3 bedrooms

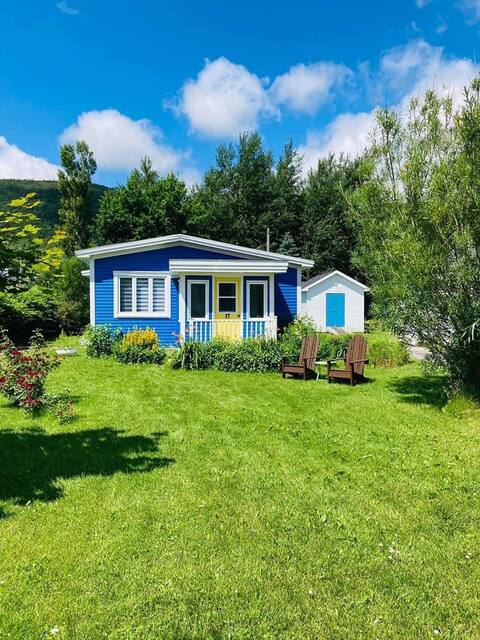
Gros Morne Bayview Home
Entire Place • 6 bedrooms
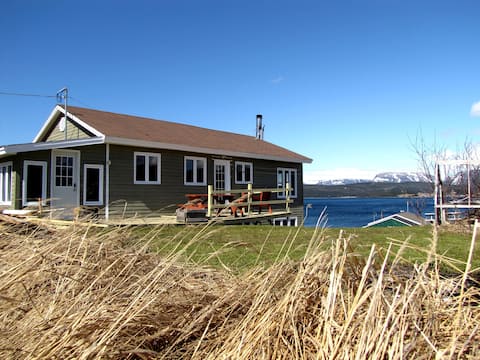
Fisherman's Lookout - Woody Point
Entire Place • 3 bedrooms
Woody Point Bay View Cottage National Park
Entire Place • 3 bedrooms
Note: Performance varies based on location, size, amenities, seasonality, and management quality. Data reflects the past 12 months.
Top Performing Airbnb Hosts in Woody Point (2025)
Learn from the best! This table showcases top-performing Airbnb hosts in Woody Point based on the number of properties managed and estimated total revenue over the past year. Analyze their scale and performance metrics.
| Host Name | Properties | Grossing Revenue | Stay Reviews | Avg Rating |
|---|---|---|---|---|
| Denise & Todd | 14 | $122,037 | 151 | 2.78/5.0 |
| Stacey | 3 | $58,425 | 161 | 4.78/5.0 |
| Paula | 1 | $37,602 | 33 | 4.94/5.0 |
| Lexie | 2 | $35,276 | 286 | 4.87/5.0 |
| Kristen | 1 | $32,576 | 33 | 4.61/5.0 |
| Jennifer | 4 | $31,708 | 161 | 4.80/5.0 |
| Paula | 1 | $23,634 | 6 | 5.00/5.0 |
| Host #36567396 | 1 | $17,804 | 1 | 0.00/5.0 |
| Alison | 1 | $16,795 | 191 | 4.84/5.0 |
| Alicia | 1 | $14,312 | 55 | 4.73/5.0 |
Analyzing the strategies of top hosts, such as their property selection, pricing, and guest communication, can offer valuable lessons for optimizing your own Airbnb operations in Woody Point.
Dive Deeper: Advanced Woody Point STR Market Data (2025)
Ready to unlock more insights? AirROI provides access to advanced metrics and comprehensive Airbnb data for Woody Point. Explore detailed analytics beyond this report to refine your investment strategy, optimize pricing, and maximize your vacation rental profits.
Explore Advanced MetricsWoody Point Short-Term Rental Market Composition (2025): Property & Room Types
Room Type Distribution
Property Type Distribution
Market Composition Insights for Woody Point
- The Woody Point Airbnb market composition is heavily skewed towards Entire Home/Apt listings, which make up 67.7% of the 31 active rentals. This indicates strong guest preference for privacy and space.
- However, a notable 32.3% share for Private Rooms suggests opportunities for budget-conscious travelers or hosts renting out spare rooms.
- Looking at the property type distribution in Woody Point, House properties are the most common (74.2%), reflecting the local real estate landscape.
- Houses represent a significant 74.2% portion, catering likely to families or larger groups.
- Smaller segments like hotel/boutique (combined 3.2%) offer potential for unique stay experiences.
Woody Point Airbnb Room Capacity Analysis (2025): Bedroom Distribution
Distribution of Listings by Number of Bedrooms
Room Capacity Insights for Woody Point
- The dominant room capacity in Woody Point is 1 bedroom listings, making up 29% of the market. This suggests a strong demand for properties suitable for couples or solo travelers.
- Together, 1 bedroom and 3 bedrooms properties represent 51.6% of the active Airbnb listings in Woody Point, indicating a high concentration in these sizes.
- A significant 51.7% of listings offer 3+ bedrooms, catering to larger groups and families seeking more space in Woody Point.
Woody Point Vacation Rental Guest Capacity Trends (2025)
Distribution of Listings by Guest Capacity
Guest Capacity Insights for Woody Point
- The most common guest capacity trend in Woody Point vacation rentals is listings accommodating 2 guests (25.8%). This suggests the primary traveler segment is likely couples or solo travelers.
- Properties designed for 2 guests and 8+ guests dominate the Woody Point STR market, accounting for 51.6% of listings.
- 45.2% of properties accommodate 6+ guests, serving the market segment for larger families or group travel in Woody Point.
- On average, properties in Woody Point are equipped to host 4.6 guests.
Woody Point Airbnb Booking Patterns (2025): Available vs. Booked Days
Available Days Distribution
Booked Days Distribution
Booking Pattern Insights for Woody Point
- The most common availability pattern in Woody Point falls within the 271-366 days range, representing 74.2% of listings. This suggests many properties have significant open periods on their calendars.
- Approximately 96.8% of listings show high availability (181+ days open annually), indicating potential for increased bookings or specific owner usage patterns.
- For booked days, the 31-90 days range is most frequent in Woody Point (38.7%), reflecting common guest stay durations or potential owner blocking patterns.
- A notable 3.2% of properties secure long booking periods (181+ days booked per year), highlighting successful long-term rental strategies or significant owner usage.
Woody Point Airbnb Minimum Stay Requirements Analysis
Distribution of Listings by Minimum Night Requirement
1 Night
5 listings
19.2% of total
2 Nights
7 listings
26.9% of total
3 Nights
9 listings
34.6% of total
4-6 Nights
3 listings
11.5% of total
30+ Nights
2 listings
7.7% of total
Key Insights
- The most prevalent minimum stay requirement in Woody Point is 3 Nights, adopted by 34.6% of listings. This highlights the market's preference for longer commitments.
Recommendations
- Align with the market by considering a 3 Nights minimum stay, as 34.6% of Woody Point hosts use this setting.
- If feasible, allowing 1-night stays, especially midweek or during low season, could capture last-minute bookings, as only 19.2% currently do.
- Explore offering discounts for stays of 30+ nights to attract the 7.7% of the market seeking extended stays.
- Adjust minimum nights based on seasonality – potentially shorter during low season and longer during peak demand periods in Woody Point.
Woody Point Airbnb Cancellation Policy Trends Analysis (2025)
Super Strict 30 Days
1 listings
4.2% of total
Flexible
2 listings
8.3% of total
Moderate
10 listings
41.7% of total
Firm
7 listings
29.2% of total
Strict
4 listings
16.7% of total
Cancellation Policy Insights for Woody Point
- The prevailing Airbnb cancellation policy trend in Woody Point is Moderate, used by 41.7% of listings.
- There's a relatively balanced mix between guest-friendly (50.0%) and stricter (45.9%) policies, offering choices for different guest needs.
Recommendations for Hosts
- Consider adopting a Moderate policy to align with the 41.7% market standard in Woody Point.
- Regularly review your cancellation policy against competitors and market demand shifts in Woody Point.
Woody Point STR Booking Lead Time Analysis (2025)
Average Booking Lead Time by Month
Booking Lead Time Insights for Woody Point
- The overall average booking lead time for vacation rentals in Woody Point is 88 days.
- Guests book furthest in advance for stays during December (average 121 days), likely coinciding with peak travel demand or local events.
- The shortest booking windows occur for stays in January (average 32 days), indicating more last-minute travel plans during this time.
- Seasonally, Summer (107 days avg.) sees the longest lead times, while Fall (70 days avg.) has the shortest, reflecting typical travel planning cycles.
Recommendations for Hosts
- Use the overall average lead time (88 days) as a baseline for your pricing and availability strategy in Woody Point.
- For December stays, consider implementing length-of-stay discounts or slightly higher rates for bookings made less than 121 days out to capitalize on advance planning.
- Target marketing efforts for the Summer season well in advance (at least 107 days) to capture early planners.
- Monitor your own booking lead times against these Woody Point averages to identify opportunities for dynamic pricing adjustments.
Popular & Essential Airbnb Amenities in Woody Point (2025)
Amenity Prevalence
Amenity Insights for Woody Point
- Essential amenities in Woody Point that guests expect include: Smoke alarm, TV, Wifi, Free parking on premises, Heating, Kitchen, Essentials. Lacking these (any) could significantly impact bookings.
- Popular amenities like Washer, Hot water, Dryer are common but not universal. Offering these can provide a competitive edge.
Recommendations for Hosts
- Ensure your listing includes all essential amenities for Woody Point: Smoke alarm, TV, Wifi, Free parking on premises, Heating, Kitchen, Essentials.
- Prioritize adding missing essentials: Heating, Kitchen, Essentials.
- Consider adding popular differentiators like Washer or Hot water to increase appeal.
- Highlight unique or less common amenities you offer (e.g., hot tub, dedicated workspace, EV charger) in your listing description and photos.
- Regularly check competitor amenities in Woody Point to stay competitive.
Woody Point Airbnb Guest Demographics & Profile Analysis (2025)
Guest Profile Summary for Woody Point
- The typical guest profile for Airbnb in Woody Point consists of primarily domestic travelers (78%), often arriving from nearby Toronto, typically belonging to the Post-2000s (Gen Z/Alpha) group (50%), primarily speaking English or French.
- Domestic travelers account for 77.7% of guests.
- Key international markets include Canada (77.7%) and United States (14%).
- Top languages spoken are English (61.4%) followed by French (19.3%).
- A significant demographic segment is the Post-2000s (Gen Z/Alpha) group, representing 50% of guests.
Recommendations for Hosts
- Target domestic marketing efforts towards travelers from Toronto and St. John's.
- Tailor amenities and listing descriptions to appeal to the dominant Post-2000s (Gen Z/Alpha) demographic (e.g., highlight fast WiFi, smart home features, local guides).
- Highlight unique local experiences or amenities relevant to the primary guest profile.
- Consider seasonal promotions aligned with peak travel times for key origin markets.
Nearby Short-Term Rental Market Comparison
How does the Woody Point Airbnb market stack up against its neighbors? Compare key performance metrics like average monthly revenue, ADR, and occupancy rates in surrounding areas to understand the broader regional STR landscape.
| Market | Active Properties | Monthly Revenue | Daily Rate | Avg. Occupancy |
|---|---|---|---|---|
| Norris Point | 32 | $2,015 | $205.33 | 57% |
| Springdale | 12 | $1,768 | $163.76 | 44% |
| Pasadena | 13 | $1,717 | $179.00 | 50% |
| Bonne Bay Pond | 12 | $1,585 | $206.42 | 42% |
| Corner Brook | 65 | $1,440 | $98.42 | 53% |
| Rocky Harbour | 109 | $1,434 | $143.92 | 52% |
| Deer Lake | 49 | $1,405 | $111.73 | 49% |
| Trout River | 16 | $1,370 | $125.38 | 54% |
| Stephenville | 24 | $1,016 | $107.14 | 44% |
| Steady Brook | 22 | $925 | $155.94 | 28% |