Port Blandford Airbnb Market Analysis 2025: Short Term Rental Data & Vacation Rental Statistics in Newfoundland and Labrador, Canada
Is Airbnb profitable in Port Blandford in 2025? Explore comprehensive Airbnb analytics for Port Blandford, Newfoundland and Labrador, Canada to uncover income potential. This 2025 STR market report for Port Blandford, based on AirROI data from April 2024 to March 2025, reveals key trends in the niche market of 28 active listings.
Whether you're considering an Airbnb investment in Port Blandford, optimizing your existing vacation rental, or exploring rental arbitrage opportunities, understanding the Port Blandford Airbnb data is crucial. Navigating the high regulation landscape is key to maximizing your short term rental income potential. Let's dive into the specifics.
Key Port Blandford Airbnb Performance Metrics Overview
Monthly Airbnb Revenue Variations & Income Potential in Port Blandford (2025)
Understanding the monthly revenue variations for Airbnb listings in Port Blandford is key to maximizing your short term rental income potential. Seasonality significantly impacts earnings. Our analysis, based on data from the past 12 months, shows that the peak revenue month for STRs in Port Blandford is typically May, while January often presents the lowest earnings, highlighting opportunities for strategic pricing adjustments during shoulder and low seasons. Explore the typical Airbnb income in Port Blandford across different performance tiers:
- Best-in-class properties (Top 10%) achieve $4,404+ monthly, often utilizing dynamic pricing and superior guest experiences.
- Strong performing properties (Top 25%) earn $2,374 or more, indicating effective management and desirable locations/amenities.
- Typical properties (Median) generate around $961 per month, representing the average market performance.
- Entry-level properties (Bottom 25%) see earnings around $338, often with potential for optimization.
Average Monthly Airbnb Earnings Trend in Port Blandford
Port Blandford Airbnb Occupancy Rate Trends (2025)
Maximize your bookings by understanding the Port Blandford STR occupancy trends. Seasonal demand shifts significantly influence how often properties are booked. Typically, Augustsees the highest demand (peak season occupancy), while January experiences the lowest (low season). Effective strategies, like adjusting minimum stays or offering promotions, can boost occupancy during slower periods. Here's how different property tiers perform in Port Blandford:
- Best-in-class properties (Top 10%) achieve 52%+ occupancy, indicating high desirability and potentially optimized availability.
- Strong performing properties (Top 25%) maintain 35% or higher occupancy, suggesting good market fit and guest satisfaction.
- Typical properties (Median) have an occupancy rate around 16%.
- Entry-level properties (Bottom 25%) average 9% occupancy, potentially facing higher vacancy.
Average Monthly Occupancy Rate Trend in Port Blandford
Average Daily Rate (ADR) Airbnb Trends in Port Blandford (2025)
Effective short term rental pricing strategy in Port Blandford involves understanding monthly ADR fluctuations. The Average Daily Rate (ADR) for Airbnb in Port Blandford typically peaks in July and dips lowest during March. Leveraging Airbnb dynamic pricing tools or strategies based on this seasonality can significantly boost revenue. Here's a look at the typical nightly rates achieved:
- Best-in-class properties (Top 10%) command rates of $221+ per night, often due to premium features or locations.
- Strong performing properties (Top 25%) achieve nightly rates of $186 or more.
- Typical properties (Median) charge around $124 per night.
- Entry-level properties (Bottom 25%) earn around $98 per night.
Average Daily Rate (ADR) Trend by Month in Port Blandford
Get Live Port Blandford Market Intelligence 👇

Explore Real-time Analytics
Airbnb Seasonality Analysis & Trends in Port Blandford (2025)
Peak Season (May, June, July)
- Revenue averages $2,751 per month
- Occupancy rates average 29.4%
- Daily rates average $153
Shoulder Season
- Revenue averages $1,829 per month
- Occupancy maintains around 26.9%
- Daily rates hold near $144
Low Season (January, February, December)
- Revenue drops to average $624 per month
- Occupancy decreases to average 11.9%
- Daily rates adjust to average $131
Seasonality Insights for Port Blandford
- The Airbnb seasonality in Port Blandford shows highly seasonal trends requiring careful strategy. While the sections above show seasonal averages, it's also insightful to look at the extremes:
- During the high season, the absolute peak month showcases Port Blandford's highest earning potential, with monthly revenues capable of climbing to $2,968, occupancy reaching a high of 49.3%, and ADRs peaking at $154.
- Conversely, the slowest single month of the year, typically falling within the low season, marks the market's lowest point. In this month, revenue might dip to $291, occupancy could drop to 7.0%, and ADRs may adjust down to $128.
- Understanding both the seasonal averages and these monthly peaks and troughs in revenue, occupancy, and ADR is crucial for maximizing your Airbnb profit potential in Port Blandford.
Seasonal Strategies for Maximizing Profit
- Peak Season: Maximize revenue through premium pricing and potentially longer minimum stays. Ensure high availability.
- Low Season: Offer competitive pricing, special promotions (e.g., extended stay discounts), and flexible cancellation policies. Target off-season travelers like remote workers or budget-conscious guests.
- Shoulder Seasons: Implement dynamic pricing that balances peak and low rates. Target weekend travelers or specific events. Offer slightly more flexible terms than peak season.
- Regularly analyze your own performance against these Port Blandford seasonality benchmarks and adjust your pricing and availability strategy accordingly.
Best Areas for Airbnb Investment in Port Blandford (2025)
Exploring the top neighborhoods for short-term rentals in Port Blandford? This section highlights key areas, outlining why they are attractive for hosts and guests, along with notable local attractions. Consider these locations based on your target guest profile and investment strategy.
| Neighborhood / Area | Why Host Here? (Target Guests & Appeal) | Key Attractions & Landmarks |
|---|---|---|
| Port Blandford Beach | A beautiful and serene beach area perfect for summer vacations. Visitors enjoy swimming, sunbathing, and beachfront rentals. | Blandford Marina, Blandford beach area, Hiking trails, Scenic views, Nearby fishing spots |
| Terra Nova National Park | A stunning national park nearby that attracts nature lovers and adventurers. Ideal for those looking to explore the great outdoors with camping and hiking. | Wildlife viewing, Hiking trails, Camping, Kayaking, Scenic viewpoints |
| Blandford Historic District | A quaint historic district that showcases the rich history of the area. Visitors can enjoy its unique architecture and local heritage. | Historic buildings, Local shops, Art galleries, Museums, Cultural events |
| Main Street Port Blandford | The heart of Port Blandford with local shops and restaurants. A great location for guests who want to experience local culture and community events. | Local eateries, Craft shops, Community events, Parks, Clam digging spots |
| Snowmobiling Trails | Famous for winter sports, the snowmobile trails attract winter enthusiasts. Ideal for rental homes during the winter months. | Snowmobiling, Winter hot spots, Winter festivals, Ice fishing, Scenic snow-covered landscapes |
| Port Blandford Golf Course | A charming local golf course that attracts golfing enthusiasts during the summer months. Perfect for visitors looking to combine leisure with sport. | Golfing facilities, Clubhouse, Scenic views, Golf Tournaments, Nearby accommodation |
| Local Cafes and Restaurants | The local food scene is a hidden gem, offering homestyle cooking and local delicacies, great for food lovers visiting the area. | Local seafood, Cozy cafes, Bistro-style dining, Culinary events, Farmers markets |
| Cultural Festivals and Events | Port Blandford hosts various cultural events throughout the year that attract tourists looking for unique local experiences. | Music festivals, Art fairs, Local markets, Community gatherings, Heritage events |
Understanding Airbnb License Requirements & STR Laws in Port Blandford (2025)
Yes, Port Blandford, Newfoundland and Labrador, Canada enforces high STR regulations. Obtaining a license and ensuring compliance is almost certainly required according to current 2025 STR laws. Always verify the latest short term rental regulations and Airbnb license requirements directly with local government authorities for Port Blandford to ensure full compliance before hosting.
(Source: AirROI data, 2025, based on 64% licensed listings)
Top Performing Airbnb Properties in Port Blandford (2025)
Benchmark your potential! Explore examples of top-performing Airbnb properties in Port Blandfordbased on Trailing Twelve Month (TTM) revenue. Analyze their characteristics, revenue, occupancy rate, and ADR to understand what drives success in this market.

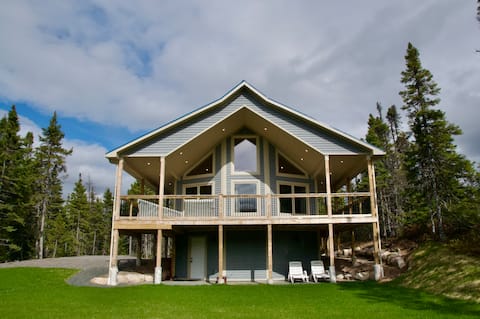
The Diversion - Family Cottage in Port Blandford
Entire Place • 5 bedrooms

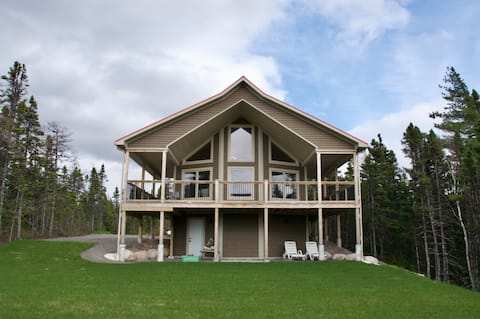
Relax and Revitalize at Sprucewood Cottage
Entire Place • 4 bedrooms
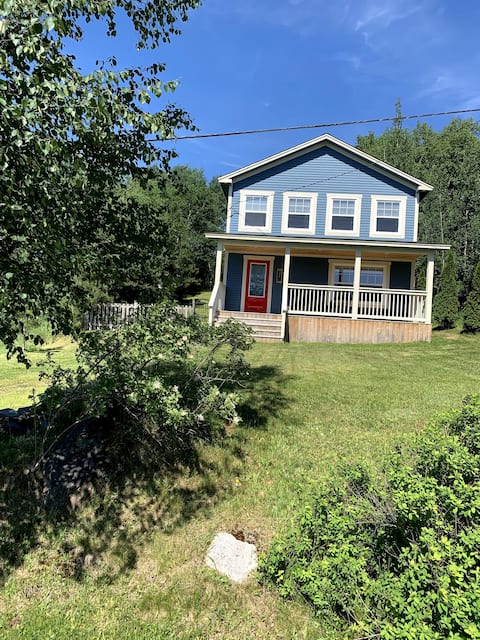
The Osprey
Entire Place • 2 bedrooms
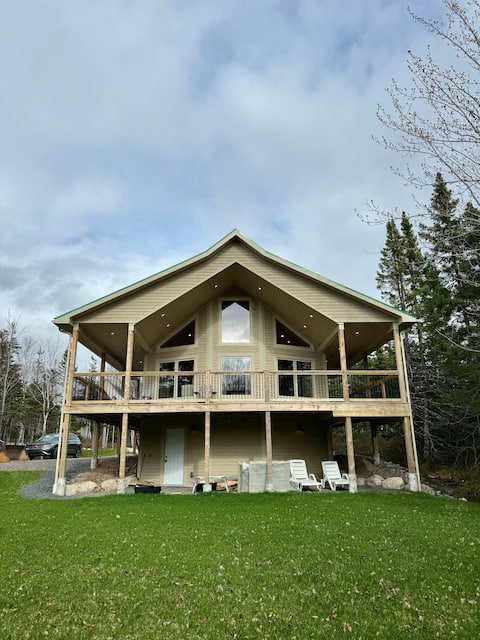
Merganser Chalet
Entire Place • 2 bedrooms
Hot tub getaway in beautiful Port Blandford.
Entire Place • 4 bedrooms
The Eagle Chalet
Entire Place • 2 bedrooms
Note: Performance varies based on location, size, amenities, seasonality, and management quality. Data reflects the past 12 months.
Top Performing Airbnb Hosts in Port Blandford (2025)
Learn from the best! This table showcases top-performing Airbnb hosts in Port Blandford based on the number of properties managed and estimated total revenue over the past year. Analyze their scale and performance metrics.
| Host Name | Properties | Grossing Revenue | Stay Reviews | Avg Rating |
|---|---|---|---|---|
| Charlene | 16 | $95,018 | 342 | 4.68/5.0 |
| Hunk'Er Down Chalets | 3 | $93,911 | 69 | 4.98/5.0 |
| Christian | 1 | $61,308 | 62 | 4.97/5.0 |
| Sheree | 1 | $54,736 | 34 | 5.00/5.0 |
| Kelly | 1 | $31,140 | 73 | 4.90/5.0 |
| Rod | 1 | $18,546 | 26 | 4.92/5.0 |
| Debbie | 1 | $14,549 | 51 | 4.92/5.0 |
| Paul | 1 | $14,003 | 31 | 4.81/5.0 |
| Host #272843822 | 2 | $8,564 | 1 | 0.00/5.0 |
| Joan | 1 | $1,045 | 10 | 4.80/5.0 |
Analyzing the strategies of top hosts, such as their property selection, pricing, and guest communication, can offer valuable lessons for optimizing your own Airbnb operations in Port Blandford.
Dive Deeper: Advanced Port Blandford STR Market Data (2025)
Ready to unlock more insights? AirROI provides access to advanced metrics and comprehensive Airbnb data for Port Blandford. Explore detailed analytics beyond this report to refine your investment strategy, optimize pricing, and maximize your vacation rental profits.
Explore Advanced MetricsPort Blandford Short-Term Rental Market Composition (2025): Property & Room Types
Room Type Distribution
Property Type Distribution
Market Composition Insights for Port Blandford
- The Port Blandford Airbnb market composition is heavily skewed towards Entire Home/Apt listings, which make up 96.4% of the 28 active rentals. This indicates strong guest preference for privacy and space.
- Looking at the property type distribution in Port Blandford, Apartment/Condo properties are the most common (32.1%), reflecting the local real estate landscape.
- Houses represent a significant 25% portion, catering likely to families or larger groups.
Port Blandford Airbnb Room Capacity Analysis (2025): Bedroom Distribution
Distribution of Listings by Number of Bedrooms
Room Capacity Insights for Port Blandford
- The dominant room capacity in Port Blandford is 2 bedrooms listings, making up 46.4% of the market. This suggests a strong demand for properties suitable for couples or solo travelers.
- Together, 2 bedrooms and 1 bedroom properties represent 82.1% of the active Airbnb listings in Port Blandford, indicating a high concentration in these sizes.
Port Blandford Vacation Rental Guest Capacity Trends (2025)
Distribution of Listings by Guest Capacity
Guest Capacity Insights for Port Blandford
- The most common guest capacity trend in Port Blandford vacation rentals is listings accommodating 4 guests (32.1%). This suggests the primary traveler segment is likely small families or groups.
- Properties designed for 4 guests and 2 guests dominate the Port Blandford STR market, accounting for 57.1% of listings.
- 35.7% of properties accommodate 6+ guests, serving the market segment for larger families or group travel in Port Blandford.
- On average, properties in Port Blandford are equipped to host 4.6 guests.
Port Blandford Airbnb Booking Patterns (2025): Available vs. Booked Days
Available Days Distribution
Booked Days Distribution
Booking Pattern Insights for Port Blandford
- The most common availability pattern in Port Blandford falls within the 271-366 days range, representing 60.7% of listings. This suggests many properties have significant open periods on their calendars.
- Approximately 92.8% of listings show high availability (181+ days open annually), indicating potential for increased bookings or specific owner usage patterns.
- For booked days, the 31-90 days range is most frequent in Port Blandford (32.1%), reflecting common guest stay durations or potential owner blocking patterns.
- A notable 7.1% of properties secure long booking periods (181+ days booked per year), highlighting successful long-term rental strategies or significant owner usage.
Port Blandford Airbnb Minimum Stay Requirements Analysis
Distribution of Listings by Minimum Night Requirement
1 Night
18 listings
66.7% of total
2 Nights
7 listings
25.9% of total
3 Nights
1 listings
3.7% of total
30+ Nights
1 listings
3.7% of total
Key Insights
- The most prevalent minimum stay requirement in Port Blandford is 1 Night, adopted by 66.7% of listings. This highlights the market's preference for shorter, flexible bookings.
- A strong majority (92.6%) of the Port Blandford Airbnb data shows acceptance of very short stays (1-2 nights), indicating a dynamic, high-turnover market.
Recommendations
- Align with the market by considering a 1 Night minimum stay, as 66.7% of Port Blandford hosts use this setting.
- Adjust minimum nights based on seasonality – potentially shorter during low season and longer during peak demand periods in Port Blandford.
Port Blandford Airbnb Cancellation Policy Trends Analysis (2025)
Flexible
8 listings
30.8% of total
Moderate
2 listings
7.7% of total
Firm
15 listings
57.7% of total
Strict
1 listings
3.8% of total
Cancellation Policy Insights for Port Blandford
- The prevailing Airbnb cancellation policy trend in Port Blandford is Firm, used by 57.7% of listings.
- A majority (61.5%) of hosts in Port Blandford utilize Firm or Strict policies, indicating a market where hosts prioritize booking security.
- Strict cancellation policies are quite rare (3.8%), potentially making listings with this policy less competitive unless justified by high demand or property type.
Recommendations for Hosts
- Consider adopting a Firm policy to align with the 57.7% market standard in Port Blandford.
- Using a Strict policy might deter some guests, as only 3.8% of listings use it. Evaluate if potential revenue protection outweighs possible lower booking rates.
- Regularly review your cancellation policy against competitors and market demand shifts in Port Blandford.
Port Blandford STR Booking Lead Time Analysis (2025)
Average Booking Lead Time by Month
Booking Lead Time Insights for Port Blandford
- The overall average booking lead time for vacation rentals in Port Blandford is 41 days.
- Guests book furthest in advance for stays during January (average 64 days), likely coinciding with peak travel demand or local events.
- The shortest booking windows occur for stays in February (average 30 days), indicating more last-minute travel plans during this time.
- Seasonally, Winter (50 days avg.) sees the longest lead times, while Spring (37 days avg.) has the shortest, reflecting typical travel planning cycles.
Recommendations for Hosts
- Use the overall average lead time (41 days) as a baseline for your pricing and availability strategy in Port Blandford.
- For January stays, consider implementing length-of-stay discounts or slightly higher rates for bookings made less than 64 days out to capitalize on advance planning.
- Target marketing efforts for the Winter season well in advance (at least 50 days) to capture early planners.
- Monitor your own booking lead times against these Port Blandford averages to identify opportunities for dynamic pricing adjustments.
Popular & Essential Airbnb Amenities in Port Blandford (2025)
Amenity Prevalence
Amenity Insights for Port Blandford
- Essential amenities in Port Blandford that guests expect include: Smoke alarm, Free parking on premises, BBQ grill. Lacking these (any) could significantly impact bookings.
- Popular amenities like Fire pit, Fire extinguisher, Kitchen are common but not universal. Offering these can provide a competitive edge.
- Warning: Wifi is not universally provided but is considered essential globally. Ensure reliable Wifi is offered.
Recommendations for Hosts
- Ensure your listing includes all essential amenities for Port Blandford: Smoke alarm, Free parking on premises, BBQ grill.
- Prioritize adding missing essentials: Free parking on premises, BBQ grill.
- Consider adding popular differentiators like Fire pit or Fire extinguisher to increase appeal.
- Highlight unique or less common amenities you offer (e.g., hot tub, dedicated workspace, EV charger) in your listing description and photos.
- Regularly check competitor amenities in Port Blandford to stay competitive.
Port Blandford Airbnb Guest Demographics & Profile Analysis (2025)
Guest Profile Summary for Port Blandford
- The typical guest profile for Airbnb in Port Blandford consists of primarily domestic travelers (86%), often arriving from nearby St. John's, typically belonging to the Post-2000s (Gen Z/Alpha) group (50%), primarily speaking English or French.
- Domestic travelers account for 86.3% of guests.
- Key international markets include Canada (86.3%) and United States (5.4%).
- Top languages spoken are English (73%) followed by French (15.3%).
- A significant demographic segment is the Post-2000s (Gen Z/Alpha) group, representing 50% of guests.
Recommendations for Hosts
- Target domestic marketing efforts towards travelers from St. John's and Toronto.
- Tailor amenities and listing descriptions to appeal to the dominant Post-2000s (Gen Z/Alpha) demographic (e.g., highlight fast WiFi, smart home features, local guides).
- Highlight unique local experiences or amenities relevant to the primary guest profile.
- Consider seasonal promotions aligned with peak travel times for key origin markets.
Nearby Short-Term Rental Market Comparison
How does the Port Blandford Airbnb market stack up against its neighbors? Compare key performance metrics like average monthly revenue, ADR, and occupancy rates in surrounding areas to understand the broader regional STR landscape.
| Market | Active Properties | Monthly Revenue | Daily Rate | Avg. Occupancy |
|---|---|---|---|---|
| Bay Roberts | 11 | $2,187 | $132.00 | 48% |
| Newfoundland and Labrador | 36 | $2,112 | $219.54 | 46% |
| Dildo | 26 | $1,981 | $180.18 | 41% |
| Placentia | 17 | $1,972 | $206.30 | 45% |
| Port Rexton | 28 | $1,918 | $174.25 | 50% |
| Joe Batt's Arm-Barr'd Islands-Shoal Bay | 11 | $1,914 | $159.03 | 51% |
| Trinity Bay North | 18 | $1,854 | $148.92 | 52% |
| Gander | 28 | $1,763 | $144.62 | 50% |
| Gambo | 12 | $1,708 | $153.14 | 39% |
| Holyrood | 12 | $1,677 | $180.05 | 37% |