Placentia Airbnb Market Analysis 2025: Short Term Rental Data & Vacation Rental Statistics in Newfoundland and Labrador, Canada
Is Airbnb profitable in Placentia in 2025? Explore comprehensive Airbnb analytics for Placentia, Newfoundland and Labrador, Canada to uncover income potential. This 2025 STR market report for Placentia, based on AirROI data from April 2024 to March 2025, reveals key trends in the niche market of 17 active listings.
Whether you're considering an Airbnb investment in Placentia, optimizing your existing vacation rental, or exploring rental arbitrage opportunities, understanding the Placentia Airbnb data is crucial. Navigating the high regulation landscape is key to maximizing your short term rental income potential. Let's dive into the specifics.
Key Placentia Airbnb Performance Metrics Overview
Monthly Airbnb Revenue Variations & Income Potential in Placentia (2025)
Understanding the monthly revenue variations for Airbnb listings in Placentia is key to maximizing your short term rental income potential. Seasonality significantly impacts earnings. Our analysis, based on data from the past 12 months, shows that the peak revenue month for STRs in Placentia is typically July, while March often presents the lowest earnings, highlighting opportunities for strategic pricing adjustments during shoulder and low seasons. Explore the typical Airbnb income in Placentia across different performance tiers:
- Best-in-class properties (Top 10%) achieve $5,351+ monthly, often utilizing dynamic pricing and superior guest experiences.
- Strong performing properties (Top 25%) earn $3,228 or more, indicating effective management and desirable locations/amenities.
- Typical properties (Median) generate around $1,899 per month, representing the average market performance.
- Entry-level properties (Bottom 25%) see earnings around $1,287, often with potential for optimization.
Average Monthly Airbnb Earnings Trend in Placentia
Placentia Airbnb Occupancy Rate Trends (2025)
Maximize your bookings by understanding the Placentia STR occupancy trends. Seasonal demand shifts significantly influence how often properties are booked. Typically, Julysees the highest demand (peak season occupancy), while March experiences the lowest (low season). Effective strategies, like adjusting minimum stays or offering promotions, can boost occupancy during slower periods. Here's how different property tiers perform in Placentia:
- Best-in-class properties (Top 10%) achieve 80%+ occupancy, indicating high desirability and potentially optimized availability.
- Strong performing properties (Top 25%) maintain 66% or higher occupancy, suggesting good market fit and guest satisfaction.
- Typical properties (Median) have an occupancy rate around 37%.
- Entry-level properties (Bottom 25%) average 24% occupancy, potentially facing higher vacancy.
Average Monthly Occupancy Rate Trend in Placentia
Average Daily Rate (ADR) Airbnb Trends in Placentia (2025)
Effective short term rental pricing strategy in Placentia involves understanding monthly ADR fluctuations. The Average Daily Rate (ADR) for Airbnb in Placentia typically peaks in April and dips lowest during March. Leveraging Airbnb dynamic pricing tools or strategies based on this seasonality can significantly boost revenue. Here's a look at the typical nightly rates achieved:
- Best-in-class properties (Top 10%) command rates of $475+ per night, often due to premium features or locations.
- Strong performing properties (Top 25%) achieve nightly rates of $220 or more.
- Typical properties (Median) charge around $139 per night.
- Entry-level properties (Bottom 25%) earn around $104 per night.
Average Daily Rate (ADR) Trend by Month in Placentia
Get Live Placentia Market Intelligence 👇

Explore Real-time Analytics
Airbnb Seasonality Analysis & Trends in Placentia (2025)
Peak Season (July, June, August)
- Revenue averages $3,631 per month
- Occupancy rates average 56.0%
- Daily rates average $222
Shoulder Season
- Revenue averages $2,592 per month
- Occupancy maintains around 45.3%
- Daily rates hold near $214
Low Season (February, March, October)
- Revenue drops to average $1,753 per month
- Occupancy decreases to average 36.4%
- Daily rates adjust to average $202
Seasonality Insights for Placentia
- The Airbnb seasonality in Placentia shows highly seasonal trends requiring careful strategy. While the sections above show seasonal averages, it's also insightful to look at the extremes:
- During the high season, the absolute peak month showcases Placentia's highest earning potential, with monthly revenues capable of climbing to $3,971, occupancy reaching a high of 62.1%, and ADRs peaking at $228.
- Conversely, the slowest single month of the year, typically falling within the low season, marks the market's lowest point. In this month, revenue might dip to $1,679, occupancy could drop to 30.1%, and ADRs may adjust down to $191.
- Understanding both the seasonal averages and these monthly peaks and troughs in revenue, occupancy, and ADR is crucial for maximizing your Airbnb profit potential in Placentia.
Seasonal Strategies for Maximizing Profit
- Peak Season: Maximize revenue through premium pricing and potentially longer minimum stays. Ensure high availability.
- Low Season: Offer competitive pricing, special promotions (e.g., extended stay discounts), and flexible cancellation policies. Target off-season travelers like remote workers or budget-conscious guests.
- Shoulder Seasons: Implement dynamic pricing that balances peak and low rates. Target weekend travelers or specific events. Offer slightly more flexible terms than peak season.
- Regularly analyze your own performance against these Placentia seasonality benchmarks and adjust your pricing and availability strategy accordingly.
Best Areas for Airbnb Investment in Placentia (2025)
Exploring the top neighborhoods for short-term rentals in Placentia? This section highlights key areas, outlining why they are attractive for hosts and guests, along with notable local attractions. Consider these locations based on your target guest profile and investment strategy.
| Neighborhood / Area | Why Host Here? (Target Guests & Appeal) | Key Attractions & Landmarks |
|---|---|---|
| Civic Centre | Central location with easy access to amenities and local attractions. Ideal for families and tourists looking for convenient accommodation. | Civic Centre Park, Placentia Marina, Placentia Bay, local restaurants and cafes |
| College Road | Residential area popular among students and visitors of the College of the North Atlantic. Great for budget travelers and those seeking a community feel. | College of the North Atlantic, local shops, Placentia Heritage Centre |
| North Harbour | Beautiful waterfront area with scenic views and access to nature. Perfect for travelers seeking outdoor experiences and relaxation. | North Harbour Marina, hiking trails, beach access, local parks |
| Main Street | Bustling area with shops, cafes, and a vibrant atmosphere. Attracts both locals and tourists looking for a lively neighborhood experience. | local shops, restaurants, Placentia Arts Centre, weekly markets |
| Cressy | Quiet residential neighborhood with charming homes. Great for families and longer stays with a more laid-back atmosphere. | local parks, walking trails, community events |
| Placentia Bay | Stunning ocean views and proximity to marine activities. Ideal for those looking to explore the natural beauty of Newfoundland. | Placentia Bay, whale watching, fishing spots, beachfront recreation |
| Cul de Sac | Secluded area away from the main tourist spots, perfect for those seeking privacy and tranquility during their stay. | local wildlife, peaceful surroundings, nature trails |
| Fortune Harbour | Historic site near the water with rich cultural heritage. Attracts visitors interested in local history and culture. | Fortune Harbour historic sites, local museums, fishing activities |
Understanding Airbnb License Requirements & STR Laws in Placentia (2025)
Yes, Placentia, Newfoundland and Labrador, Canada enforces high STR regulations. Obtaining a license and ensuring compliance is almost certainly required according to current 2025 STR laws. Always verify the latest short term rental regulations and Airbnb license requirements directly with local government authorities for Placentia to ensure full compliance before hosting.
(Source: AirROI data, 2025, based on 47% licensed listings)
Top Performing Airbnb Properties in Placentia (2025)
Benchmark your potential! Explore examples of top-performing Airbnb properties in Placentiabased on Trailing Twelve Month (TTM) revenue. Analyze their characteristics, revenue, occupancy rate, and ADR to understand what drives success in this market.
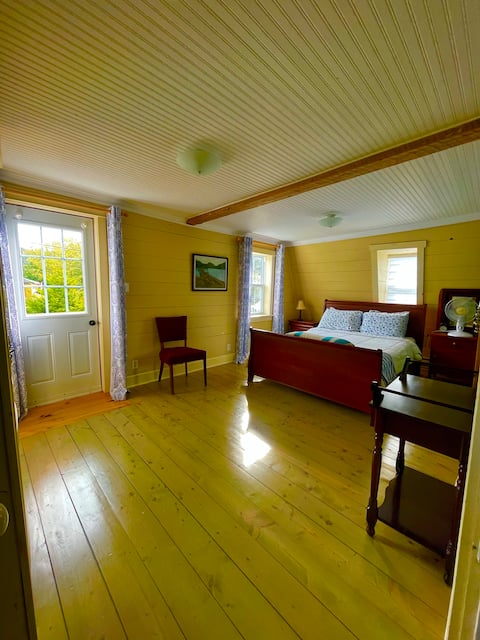
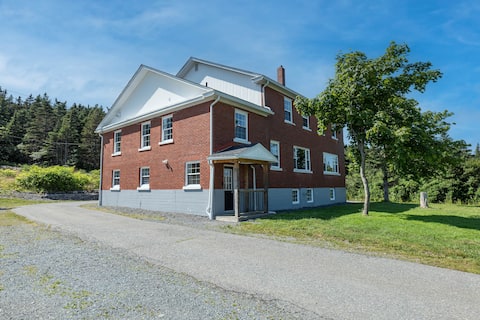
Lucy’s Place Entire house 4 bedrooms 2 bathrooms
Entire Place • 4 bedrooms
Riverside Landing Vacation Home Placentia
Entire Place • 3 bedrooms
Bayview Suites
Entire Place • 5 bedrooms
Grace’s Place
Entire Place • 2 bedrooms
Fleur de Sel Heritage Home
Entire Place • 3 bedrooms
Margie's Place By the Pond
Entire Place • 5 bedrooms
Note: Performance varies based on location, size, amenities, seasonality, and management quality. Data reflects the past 12 months.
Top Performing Airbnb Hosts in Placentia (2025)
Learn from the best! This table showcases top-performing Airbnb hosts in Placentia based on the number of properties managed and estimated total revenue over the past year. Analyze their scale and performance metrics.
| Host Name | Properties | Grossing Revenue | Stay Reviews | Avg Rating |
|---|---|---|---|---|
| Trina | 2 | $83,692 | 13 | 4.94/5.0 |
| Mary | 2 | $57,662 | 239 | 4.92/5.0 |
| Jamel And Joanne | 3 | $52,180 | 224 | 4.97/5.0 |
| Valerie | 1 | $45,756 | 17 | 5.00/5.0 |
| Jacquelyn | 1 | $31,016 | 173 | 4.98/5.0 |
| Jennifer | 1 | $29,856 | 23 | 4.70/5.0 |
| Paula | 2 | $27,587 | 41 | 4.68/5.0 |
| Amy | 1 | $24,166 | 203 | 4.97/5.0 |
| Dave | 1 | $20,999 | 67 | 5.00/5.0 |
| Anne | 2 | $17,943 | 579 | 4.85/5.0 |
Analyzing the strategies of top hosts, such as their property selection, pricing, and guest communication, can offer valuable lessons for optimizing your own Airbnb operations in Placentia.
Dive Deeper: Advanced Placentia STR Market Data (2025)
Ready to unlock more insights? AirROI provides access to advanced metrics and comprehensive Airbnb data for Placentia. Explore detailed analytics beyond this report to refine your investment strategy, optimize pricing, and maximize your vacation rental profits.
Explore Advanced MetricsPlacentia Short-Term Rental Market Composition (2025): Property & Room Types
Room Type Distribution
Property Type Distribution
Market Composition Insights for Placentia
- The Placentia Airbnb market composition is heavily skewed towards Entire Home/Apt listings, which make up 100% of the 17 active rentals. This indicates strong guest preference for privacy and space.
- Looking at the property type distribution in Placentia, House properties are the most common (94.1%), reflecting the local real estate landscape.
- Houses represent a significant 94.1% portion, catering likely to families or larger groups.
Placentia Airbnb Room Capacity Analysis (2025): Bedroom Distribution
Distribution of Listings by Number of Bedrooms
Room Capacity Insights for Placentia
- The dominant room capacity in Placentia is 2 bedrooms listings, making up 35.3% of the market. This suggests a strong demand for properties suitable for couples or solo travelers.
- Together, 2 bedrooms and 3 bedrooms properties represent 64.7% of the active Airbnb listings in Placentia, indicating a high concentration in these sizes.
- A significant 58.8% of listings offer 3+ bedrooms, catering to larger groups and families seeking more space in Placentia.
Placentia Vacation Rental Guest Capacity Trends (2025)
Distribution of Listings by Guest Capacity
Guest Capacity Insights for Placentia
- The most common guest capacity trend in Placentia vacation rentals is listings accommodating 4 guests (35.3%). This suggests the primary traveler segment is likely small families or groups.
- Properties designed for 4 guests and 6 guests dominate the Placentia STR market, accounting for 58.8% of listings.
- 52.9% of properties accommodate 6+ guests, serving the market segment for larger families or group travel in Placentia.
- On average, properties in Placentia are equipped to host 5.5 guests.
Placentia Airbnb Booking Patterns (2025): Available vs. Booked Days
Available Days Distribution
Booked Days Distribution
Booking Pattern Insights for Placentia
- The most common availability pattern in Placentia falls within the 181-270 days range, representing 41.2% of listings. This suggests many properties have significant open periods on their calendars.
- Approximately 76.5% of listings show high availability (181+ days open annually), indicating potential for increased bookings or specific owner usage patterns.
- For booked days, the 91-180 days range is most frequent in Placentia (47.1%), reflecting common guest stay durations or potential owner blocking patterns.
- A notable 23.5% of properties secure long booking periods (181+ days booked per year), highlighting successful long-term rental strategies or significant owner usage.
Placentia Airbnb Minimum Stay Requirements Analysis
Distribution of Listings by Minimum Night Requirement
1 Night
6 listings
35.3% of total
2 Nights
10 listings
58.8% of total
30+ Nights
1 listings
5.9% of total
Key Insights
- The most prevalent minimum stay requirement in Placentia is 2 Nights, adopted by 58.8% of listings. This highlights the market's preference for shorter, flexible bookings.
- A strong majority (94.1%) of the Placentia Airbnb data shows acceptance of very short stays (1-2 nights), indicating a dynamic, high-turnover market.
Recommendations
- Align with the market by considering a 2 Nights minimum stay, as 58.8% of Placentia hosts use this setting.
- Explore offering discounts for stays of 30+ nights to attract the 5.9% of the market seeking extended stays.
- Adjust minimum nights based on seasonality – potentially shorter during low season and longer during peak demand periods in Placentia.
Placentia Airbnb Cancellation Policy Trends Analysis (2025)
Flexible
6 listings
35.3% of total
Moderate
10 listings
58.8% of total
Firm
1 listings
5.9% of total
Cancellation Policy Insights for Placentia
- The prevailing Airbnb cancellation policy trend in Placentia is Moderate, used by 58.8% of listings.
- The market strongly favors guest-friendly terms, with 94.1% of listings offering Flexible or Moderate policies. This suggests guests in Placentia may expect booking flexibility.
Recommendations for Hosts
- Consider adopting a Moderate policy to align with the 58.8% market standard in Placentia.
- Regularly review your cancellation policy against competitors and market demand shifts in Placentia.
Placentia STR Booking Lead Time Analysis (2025)
Average Booking Lead Time by Month
Booking Lead Time Insights for Placentia
- The overall average booking lead time for vacation rentals in Placentia is 67 days.
- Guests book furthest in advance for stays during July (average 135 days), likely coinciding with peak travel demand or local events.
- The shortest booking windows occur for stays in November (average 17 days), indicating more last-minute travel plans during this time.
- Seasonally, Summer (116 days avg.) sees the longest lead times, while Winter (27 days avg.) has the shortest, reflecting typical travel planning cycles.
Recommendations for Hosts
- Use the overall average lead time (67 days) as a baseline for your pricing and availability strategy in Placentia.
- For July stays, consider implementing length-of-stay discounts or slightly higher rates for bookings made less than 135 days out to capitalize on advance planning.
- Target marketing efforts for the Summer season well in advance (at least 116 days) to capture early planners.
- Monitor your own booking lead times against these Placentia averages to identify opportunities for dynamic pricing adjustments.
Popular & Essential Airbnb Amenities in Placentia (2025)
Amenity Prevalence
Amenity Insights for Placentia
- Essential amenities in Placentia that guests expect include: Washer, TV, Wifi. Lacking these (any) could significantly impact bookings.
- Popular amenities like Dryer, Coffee maker, Free parking on premises are common but not universal. Offering these can provide a competitive edge.
Recommendations for Hosts
- Ensure your listing includes all essential amenities for Placentia: Washer, TV, Wifi.
- Consider adding popular differentiators like Dryer or Coffee maker to increase appeal.
- Highlight unique or less common amenities you offer (e.g., hot tub, dedicated workspace, EV charger) in your listing description and photos.
- Regularly check competitor amenities in Placentia to stay competitive.
Placentia Airbnb Guest Demographics & Profile Analysis (2025)
Guest Profile Summary for Placentia
- The typical guest profile for Airbnb in Placentia consists of primarily domestic travelers (83%), often arriving from nearby St. John's, typically belonging to the Post-2000s (Gen Z/Alpha) group (50%), primarily speaking English or French.
- Domestic travelers account for 83.2% of guests.
- Key international markets include Canada (83.2%) and United States (13.4%).
- Top languages spoken are English (75.3%) followed by French (14.3%).
- A significant demographic segment is the Post-2000s (Gen Z/Alpha) group, representing 50% of guests.
Recommendations for Hosts
- Target domestic marketing efforts towards travelers from St. John's and Clarenville.
- Tailor amenities and listing descriptions to appeal to the dominant Post-2000s (Gen Z/Alpha) demographic (e.g., highlight fast WiFi, smart home features, local guides).
- Highlight unique local experiences or amenities relevant to the primary guest profile.
- Consider seasonal promotions aligned with peak travel times for key origin markets.
Nearby Short-Term Rental Market Comparison
How does the Placentia Airbnb market stack up against its neighbors? Compare key performance metrics like average monthly revenue, ADR, and occupancy rates in surrounding areas to understand the broader regional STR landscape.
| Market | Active Properties | Monthly Revenue | Daily Rate | Avg. Occupancy |
|---|---|---|---|---|
| Tors Cove | 25 | $3,089 | $211.86 | 46% |
| Pouch Cove | 11 | $2,511 | $174.11 | 58% |
| Bay Roberts | 11 | $2,187 | $132.00 | 48% |
| Portugal Cove - St. Philips | 19 | $2,175 | $168.17 | 57% |
| Conception Bay South | 26 | $2,078 | $140.58 | 57% |
| Dildo | 26 | $1,981 | $180.18 | 41% |
| Port Rexton | 28 | $1,918 | $174.25 | 50% |
| Trinity Bay North | 18 | $1,854 | $148.92 | 52% |
| Saint John's | 643 | $1,801 | $136.00 | 55% |
| Gander | 28 | $1,763 | $144.62 | 50% |