Marystown Airbnb Market Analysis 2025: Short Term Rental Data & Vacation Rental Statistics in Newfoundland and Labrador, Canada
Is Airbnb profitable in Marystown in 2025? Explore comprehensive Airbnb analytics for Marystown, Newfoundland and Labrador, Canada to uncover income potential. This 2025 STR market report for Marystown, based on AirROI data from April 2024 to March 2025, reveals key trends in the niche market of 19 active listings.
Whether you're considering an Airbnb investment in Marystown, optimizing your existing vacation rental, or exploring rental arbitrage opportunities, understanding the Marystown Airbnb data is crucial. Understanding the local regulations is key to maximizing your short term rental income potential. Let's dive into the specifics.
Key Marystown Airbnb Performance Metrics Overview
Monthly Airbnb Revenue Variations & Income Potential in Marystown (2025)
Understanding the monthly revenue variations for Airbnb listings in Marystown is key to maximizing your short term rental income potential. Seasonality significantly impacts earnings. Our analysis, based on data from the past 12 months, shows that the peak revenue month for STRs in Marystown is typically June, while February often presents the lowest earnings, highlighting opportunities for strategic pricing adjustments during shoulder and low seasons. Explore the typical Airbnb income in Marystown across different performance tiers:
- Best-in-class properties (Top 10%) achieve $2,685+ monthly, often utilizing dynamic pricing and superior guest experiences.
- Strong performing properties (Top 25%) earn $1,948 or more, indicating effective management and desirable locations/amenities.
- Typical properties (Median) generate around $1,299 per month, representing the average market performance.
- Entry-level properties (Bottom 25%) see earnings around $717, often with potential for optimization.
Average Monthly Airbnb Earnings Trend in Marystown
Marystown Airbnb Occupancy Rate Trends (2025)
Maximize your bookings by understanding the Marystown STR occupancy trends. Seasonal demand shifts significantly influence how often properties are booked. Typically, Augustsees the highest demand (peak season occupancy), while February experiences the lowest (low season). Effective strategies, like adjusting minimum stays or offering promotions, can boost occupancy during slower periods. Here's how different property tiers perform in Marystown:
- Best-in-class properties (Top 10%) achieve 71%+ occupancy, indicating high desirability and potentially optimized availability.
- Strong performing properties (Top 25%) maintain 58% or higher occupancy, suggesting good market fit and guest satisfaction.
- Typical properties (Median) have an occupancy rate around 40%.
- Entry-level properties (Bottom 25%) average 24% occupancy, potentially facing higher vacancy.
Average Monthly Occupancy Rate Trend in Marystown
Average Daily Rate (ADR) Airbnb Trends in Marystown (2025)
Effective short term rental pricing strategy in Marystown involves understanding monthly ADR fluctuations. The Average Daily Rate (ADR) for Airbnb in Marystown typically peaks in November and dips lowest during September. Leveraging Airbnb dynamic pricing tools or strategies based on this seasonality can significantly boost revenue. Here's a look at the typical nightly rates achieved:
- Best-in-class properties (Top 10%) command rates of $139+ per night, often due to premium features or locations.
- Strong performing properties (Top 25%) achieve nightly rates of $113 or more.
- Typical properties (Median) charge around $89 per night.
- Entry-level properties (Bottom 25%) earn around $67 per night.
Average Daily Rate (ADR) Trend by Month in Marystown
Get Live Marystown Market Intelligence 👇

Explore Real-time Analytics
Airbnb Seasonality Analysis & Trends in Marystown (2025)
Peak Season (June, August, July)
- Revenue averages $2,243 per month
- Occupancy rates average 64.6%
- Daily rates average $99
Shoulder Season
- Revenue averages $1,570 per month
- Occupancy maintains around 43.0%
- Daily rates hold near $100
Low Season (February, March, December)
- Revenue drops to average $743 per month
- Occupancy decreases to average 21.9%
- Daily rates adjust to average $102
Seasonality Insights for Marystown
- The Airbnb seasonality in Marystown shows highly seasonal trends requiring careful strategy. While the sections above show seasonal averages, it's also insightful to look at the extremes:
- During the high season, the absolute peak month showcases Marystown's highest earning potential, with monthly revenues capable of climbing to $2,360, occupancy reaching a high of 67.0%, and ADRs peaking at $105.
- Conversely, the slowest single month of the year, typically falling within the low season, marks the market's lowest point. In this month, revenue might dip to $446, occupancy could drop to 13.7%, and ADRs may adjust down to $98.
- Understanding both the seasonal averages and these monthly peaks and troughs in revenue, occupancy, and ADR is crucial for maximizing your Airbnb profit potential in Marystown.
Seasonal Strategies for Maximizing Profit
- Peak Season: Maximize revenue through premium pricing and potentially longer minimum stays. Ensure high availability.
- Low Season: Offer competitive pricing, special promotions (e.g., extended stay discounts), and flexible cancellation policies. Target off-season travelers like remote workers or budget-conscious guests.
- Shoulder Seasons: Implement dynamic pricing that balances peak and low rates. Target weekend travelers or specific events. Offer slightly more flexible terms than peak season.
- Regularly analyze your own performance against these Marystown seasonality benchmarks and adjust your pricing and availability strategy accordingly.
Best Areas for Airbnb Investment in Marystown (2025)
Exploring the top neighborhoods for short-term rentals in Marystown? This section highlights key areas, outlining why they are attractive for hosts and guests, along with notable local attractions. Consider these locations based on your target guest profile and investment strategy.
| Neighborhood / Area | Why Host Here? (Target Guests & Appeal) | Key Attractions & Landmarks |
|---|---|---|
| Downtown Marystown | The bustling center of Marystown, offering a mix of shops, restaurants, and community events. A great location for tourists wanting to experience the local culture and amenities. | Marystown Heritage Museum, Columbus Hall, local shops and cafes, community parks |
| Creekside Drive | A peaceful residential area by the water, ideal for families and those looking for a quiet retreat. Close to nature trails and scenic views. | sandy beaches, walking trails, boat launches, fishing spots |
| Marystown Marina | A prime spot for boating enthusiasts and fishers. Access to water activities and vibrant marina life makes it attractive for outdoor lovers. | Marystown Marina, Boat rentals, Fishing charters, Waterfront dining |
| Hickey's Road | A family-friendly neighborhood with access to essential services and local attractions. Popular among visitors looking for a home-like feel during their stay. | local playgrounds, sports fields, community gatherings |
| Burton's Cove | Scenic cove community known for its breathtaking views and outdoor recreational activities. Attracts nature lovers and those looking for adventure. | hiking trails, bird watching, picnic spots |
| St. Lawrence Recreation Facilities | Close proximity to recreational activities, making it ideal for families and groups. Provides easy access to entertainment options. | sports complexes, swimming facilities, parks |
| Browns Cove | A tranquil area perfect for relaxation and nature walks. Visitors can enjoy the serenity and scenic beauty of the Newfoundland landscape. | coastal views, walking paths, natural reserves |
| Cremona Road | A quiet road with easy access to the main attractions of Marystown, suitable for travelers seeking convenience and comfort. | shopping conveniences, local restaurants, close to main road access |
Understanding Airbnb License Requirements & STR Laws in Marystown (2025)
With 11% of listings showing registration in 2025, understanding potential Airbnb license requirements is crucial in Marystown. Always verify the latest short term rental regulations and Airbnb license requirements directly with local government authorities for Marystown to ensure full compliance before hosting.
(Source: AirROI data, 2025, based on 11% licensed listings)
Top Performing Airbnb Properties in Marystown (2025)
Benchmark your potential! Explore examples of top-performing Airbnb properties in Marystownbased on Trailing Twelve Month (TTM) revenue. Analyze their characteristics, revenue, occupancy rate, and ADR to understand what drives success in this market.
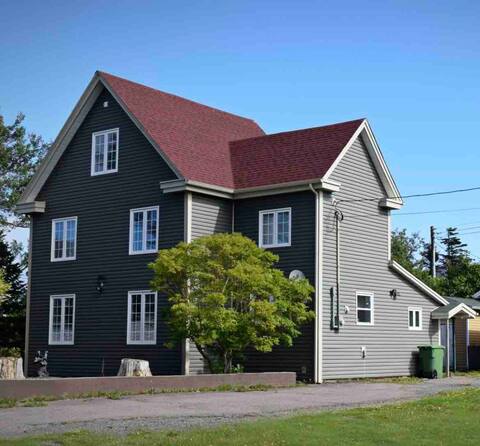
Uncle Thomas’ House
Entire Place • 4 bedrooms
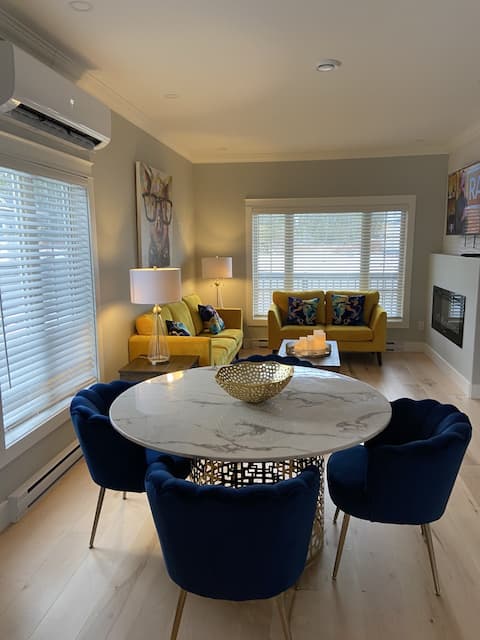
Keegan's Place
Entire Place • 2 bedrooms

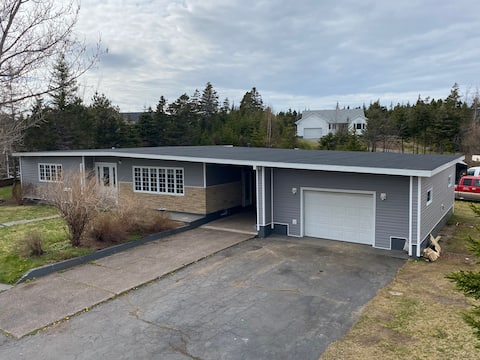
Hilltop Vista- Relax and unwind!
Entire Place • 3 bedrooms
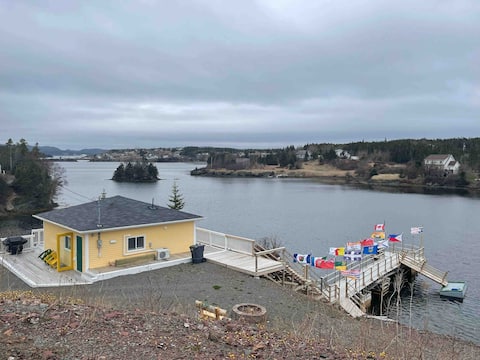
Gloria’s Garden
Entire Place • 3 bedrooms
Pearls place
Entire Place • N/A

Rosies Reel 'em Inn
Entire Place • 3 bedrooms
Note: Performance varies based on location, size, amenities, seasonality, and management quality. Data reflects the past 12 months.
Top Performing Airbnb Hosts in Marystown (2025)
Learn from the best! This table showcases top-performing Airbnb hosts in Marystown based on the number of properties managed and estimated total revenue over the past year. Analyze their scale and performance metrics.
| Host Name | Properties | Grossing Revenue | Stay Reviews | Avg Rating |
|---|---|---|---|---|
| Jack | 1 | $51,898 | 8 | 5.00/5.0 |
| Kathy | 5 | $38,712 | 72 | 4.93/5.0 |
| Andrew | 2 | $38,686 | 154 | 4.79/5.0 |
| Paula | 1 | $23,617 | 117 | 4.97/5.0 |
| Francine | 1 | $22,662 | 93 | 5.00/5.0 |
| Gus | 1 | $19,079 | 246 | 4.93/5.0 |
| Kathleen | 1 | $17,926 | 182 | 4.97/5.0 |
| Denise | 1 | $16,686 | 275 | 4.87/5.0 |
| Wanda | 1 | $12,817 | 28 | 4.96/5.0 |
| Host #153438081 | 1 | $11,809 | 223 | 4.97/5.0 |
Analyzing the strategies of top hosts, such as their property selection, pricing, and guest communication, can offer valuable lessons for optimizing your own Airbnb operations in Marystown.
Dive Deeper: Advanced Marystown STR Market Data (2025)
Ready to unlock more insights? AirROI provides access to advanced metrics and comprehensive Airbnb data for Marystown. Explore detailed analytics beyond this report to refine your investment strategy, optimize pricing, and maximize your vacation rental profits.
Explore Advanced MetricsMarystown Short-Term Rental Market Composition (2025): Property & Room Types
Room Type Distribution
Property Type Distribution
Market Composition Insights for Marystown
- The Marystown Airbnb market composition is heavily skewed towards Entire Home/Apt listings, which make up 73.7% of the 19 active rentals. This indicates strong guest preference for privacy and space.
- Looking at the property type distribution in Marystown, House properties are the most common (89.5%), reflecting the local real estate landscape.
- Houses represent a significant 89.5% portion, catering likely to families or larger groups.
Marystown Airbnb Room Capacity Analysis (2025): Bedroom Distribution
Distribution of Listings by Number of Bedrooms
Room Capacity Insights for Marystown
- The dominant room capacity in Marystown is 2 bedrooms listings, making up 31.6% of the market. This suggests a strong demand for properties suitable for couples or solo travelers.
- Together, 2 bedrooms and 3 bedrooms properties represent 52.7% of the active Airbnb listings in Marystown, indicating a high concentration in these sizes.
- A significant 26.4% of listings offer 3+ bedrooms, catering to larger groups and families seeking more space in Marystown.
Marystown Vacation Rental Guest Capacity Trends (2025)
Distribution of Listings by Guest Capacity
Guest Capacity Insights for Marystown
- The most common guest capacity trend in Marystown vacation rentals is listings accommodating 4 guests (26.3%). This suggests the primary traveler segment is likely small families or groups.
- Properties designed for 4 guests and 5 guests dominate the Marystown STR market, accounting for 36.8% of listings.
- 21.1% of properties accommodate 6+ guests, serving the market segment for larger families or group travel in Marystown.
- On average, properties in Marystown are equipped to host 3.4 guests.
Marystown Airbnb Booking Patterns (2025): Available vs. Booked Days
Available Days Distribution
Booked Days Distribution
Booking Pattern Insights for Marystown
- The most common availability pattern in Marystown falls within the 181-270 days range, representing 42.1% of listings. This suggests many properties have significant open periods on their calendars.
- Approximately 78.9% of listings show high availability (181+ days open annually), indicating potential for increased bookings or specific owner usage patterns.
- For booked days, the 91-180 days range is most frequent in Marystown (47.4%), reflecting common guest stay durations or potential owner blocking patterns.
- A notable 26.3% of properties secure long booking periods (181+ days booked per year), highlighting successful long-term rental strategies or significant owner usage.
Marystown Airbnb Minimum Stay Requirements Analysis
Distribution of Listings by Minimum Night Requirement
1 Night
12 listings
63.2% of total
2 Nights
6 listings
31.6% of total
30+ Nights
1 listings
5.3% of total
Key Insights
- The most prevalent minimum stay requirement in Marystown is 1 Night, adopted by 63.2% of listings. This highlights the market's preference for shorter, flexible bookings.
- A strong majority (94.8%) of the Marystown Airbnb data shows acceptance of very short stays (1-2 nights), indicating a dynamic, high-turnover market.
Recommendations
- Align with the market by considering a 1 Night minimum stay, as 63.2% of Marystown hosts use this setting.
- Explore offering discounts for stays of 30+ nights to attract the 5.3% of the market seeking extended stays.
- Adjust minimum nights based on seasonality – potentially shorter during low season and longer during peak demand periods in Marystown.
Marystown Airbnb Cancellation Policy Trends Analysis (2025)
Flexible
12 listings
66.7% of total
Moderate
4 listings
22.2% of total
Firm
2 listings
11.1% of total
Cancellation Policy Insights for Marystown
- The prevailing Airbnb cancellation policy trend in Marystown is Flexible, used by 66.7% of listings.
- The market strongly favors guest-friendly terms, with 88.9% of listings offering Flexible or Moderate policies. This suggests guests in Marystown may expect booking flexibility.
Recommendations for Hosts
- Consider adopting a Flexible policy to align with the 66.7% market standard in Marystown.
- Given the high prevalence of Flexible policies (66.7%), offering this can enhance booking appeal, especially during shoulder seasons.
- Regularly review your cancellation policy against competitors and market demand shifts in Marystown.
Marystown STR Booking Lead Time Analysis (2025)
Average Booking Lead Time by Month
Booking Lead Time Insights for Marystown
- The overall average booking lead time for vacation rentals in Marystown is 29 days.
- Guests book furthest in advance for stays during July (average 90 days), likely coinciding with peak travel demand or local events.
- The shortest booking windows occur for stays in November (average 10 days), indicating more last-minute travel plans during this time.
- Seasonally, Summer (62 days avg.) sees the longest lead times, while Winter (20 days avg.) has the shortest, reflecting typical travel planning cycles.
Recommendations for Hosts
- Use the overall average lead time (29 days) as a baseline for your pricing and availability strategy in Marystown.
- For July stays, consider implementing length-of-stay discounts or slightly higher rates for bookings made less than 90 days out to capitalize on advance planning.
- During November, focus on last-minute booking availability and promotions, as guests book with very short notice (10 days avg.).
- Target marketing efforts for the Summer season well in advance (at least 62 days) to capture early planners.
- Monitor your own booking lead times against these Marystown averages to identify opportunities for dynamic pricing adjustments.
Popular & Essential Airbnb Amenities in Marystown (2025)
Amenity Prevalence
Amenity Insights for Marystown
- Essential amenities in Marystown that guests expect include: Refrigerator, TV, Dishes and silverware, Kitchen, Smoke alarm, Heating, Coffee maker, Free parking on premises, Wifi. Lacking these (any) could significantly impact bookings.
- Popular amenities like Microwave are common but not universal. Offering these can provide a competitive edge.
Recommendations for Hosts
- Ensure your listing includes all essential amenities for Marystown: Refrigerator, TV, Dishes and silverware, Kitchen, Smoke alarm, Heating, Coffee maker, Free parking on premises, Wifi.
- Consider adding popular differentiators like Microwave to increase appeal.
- Highlight unique or less common amenities you offer (e.g., hot tub, dedicated workspace, EV charger) in your listing description and photos.
- Regularly check competitor amenities in Marystown to stay competitive.
Marystown Airbnb Guest Demographics & Profile Analysis (2025)
Guest Profile Summary for Marystown
- The typical guest profile for Airbnb in Marystown consists of primarily domestic travelers (88%), often arriving from nearby St. John's, typically belonging to the Post-2000s (Gen Z/Alpha) group (50%), primarily speaking English or French.
- Domestic travelers account for 88.4% of guests.
- Key international markets include Canada (88.4%) and Saint Pierre and Miquelon (5.2%).
- Top languages spoken are English (72.9%) followed by French (17%).
- A significant demographic segment is the Post-2000s (Gen Z/Alpha) group, representing 50% of guests.
Recommendations for Hosts
- Target domestic marketing efforts towards travelers from St. John's and Paradise.
- Tailor amenities and listing descriptions to appeal to the dominant Post-2000s (Gen Z/Alpha) demographic (e.g., highlight fast WiFi, smart home features, local guides).
- Highlight unique local experiences or amenities relevant to the primary guest profile.
- Consider seasonal promotions aligned with peak travel times for key origin markets.
Nearby Short-Term Rental Market Comparison
How does the Marystown Airbnb market stack up against its neighbors? Compare key performance metrics like average monthly revenue, ADR, and occupancy rates in surrounding areas to understand the broader regional STR landscape.
| Market | Active Properties | Monthly Revenue | Daily Rate | Avg. Occupancy |
|---|---|---|---|---|
| Newfoundland and Labrador | 36 | $2,112 | $219.54 | 46% |
| Gander | 28 | $1,763 | $144.62 | 50% |
| Gambo | 12 | $1,708 | $153.14 | 39% |
| Glovertown | 15 | $1,477 | $121.71 | 45% |
| Saint-Pierre | 16 | $1,379 | $113.28 | 59% |
| Grand Falls-Windsor | 35 | $1,269 | $114.43 | 43% |
| Burin | 10 | $1,215 | $118.23 | 51% |
| Port Blandford | 28 | $1,169 | $144.38 | 25% |