Gander Airbnb Market Analysis 2025: Short Term Rental Data & Vacation Rental Statistics in Newfoundland and Labrador, Canada
Is Airbnb profitable in Gander in 2025? Explore comprehensive Airbnb analytics for Gander, Newfoundland and Labrador, Canada to uncover income potential. This 2025 STR market report for Gander, based on AirROI data from April 2024 to March 2025, reveals key trends in the niche market of 28 active listings.
Whether you're considering an Airbnb investment in Gander, optimizing your existing vacation rental, or exploring rental arbitrage opportunities, understanding the Gander Airbnb data is crucial. Understanding the local regulations is key to maximizing your short term rental income potential. Let's dive into the specifics.
Key Gander Airbnb Performance Metrics Overview
Monthly Airbnb Revenue Variations & Income Potential in Gander (2025)
Understanding the monthly revenue variations for Airbnb listings in Gander is key to maximizing your short term rental income potential. Seasonality significantly impacts earnings. Our analysis, based on data from the past 12 months, shows that the peak revenue month for STRs in Gander is typically August, while January often presents the lowest earnings, highlighting opportunities for strategic pricing adjustments during shoulder and low seasons. Explore the typical Airbnb income in Gander across different performance tiers:
- Best-in-class properties (Top 10%) achieve $3,735+ monthly, often utilizing dynamic pricing and superior guest experiences.
- Strong performing properties (Top 25%) earn $2,843 or more, indicating effective management and desirable locations/amenities.
- Typical properties (Median) generate around $2,054 per month, representing the average market performance.
- Entry-level properties (Bottom 25%) see earnings around $1,353, often with potential for optimization.
Average Monthly Airbnb Earnings Trend in Gander
Gander Airbnb Occupancy Rate Trends (2025)
Maximize your bookings by understanding the Gander STR occupancy trends. Seasonal demand shifts significantly influence how often properties are booked. Typically, Augustsees the highest demand (peak season occupancy), while May experiences the lowest (low season). Effective strategies, like adjusting minimum stays or offering promotions, can boost occupancy during slower periods. Here's how different property tiers perform in Gander:
- Best-in-class properties (Top 10%) achieve 78%+ occupancy, indicating high desirability and potentially optimized availability.
- Strong performing properties (Top 25%) maintain 67% or higher occupancy, suggesting good market fit and guest satisfaction.
- Typical properties (Median) have an occupancy rate around 51%.
- Entry-level properties (Bottom 25%) average 31% occupancy, potentially facing higher vacancy.
Average Monthly Occupancy Rate Trend in Gander
Average Daily Rate (ADR) Airbnb Trends in Gander (2025)
Effective short term rental pricing strategy in Gander involves understanding monthly ADR fluctuations. The Average Daily Rate (ADR) for Airbnb in Gander typically peaks in November and dips lowest during April. Leveraging Airbnb dynamic pricing tools or strategies based on this seasonality can significantly boost revenue. Here's a look at the typical nightly rates achieved:
- Best-in-class properties (Top 10%) command rates of $202+ per night, often due to premium features or locations.
- Strong performing properties (Top 25%) achieve nightly rates of $167 or more.
- Typical properties (Median) charge around $116 per night.
- Entry-level properties (Bottom 25%) earn around $85 per night.
Average Daily Rate (ADR) Trend by Month in Gander
Get Live Gander Market Intelligence 👇

Explore Real-time Analytics
Airbnb Seasonality Analysis & Trends in Gander (2025)
Peak Season (August, July, June)
- Revenue averages $3,156 per month
- Occupancy rates average 71.3%
- Daily rates average $126
Shoulder Season
- Revenue averages $2,078 per month
- Occupancy maintains around 45.7%
- Daily rates hold near $133
Low Season (January, March, October)
- Revenue drops to average $1,585 per month
- Occupancy decreases to average 39.2%
- Daily rates adjust to average $134
Seasonality Insights for Gander
- The Airbnb seasonality in Gander shows highly seasonal trends requiring careful strategy. While the sections above show seasonal averages, it's also insightful to look at the extremes:
- During the high season, the absolute peak month showcases Gander's highest earning potential, with monthly revenues capable of climbing to $3,213, occupancy reaching a high of 76.5%, and ADRs peaking at $145.
- Conversely, the slowest single month of the year, typically falling within the low season, marks the market's lowest point. In this month, revenue might dip to $1,523, occupancy could drop to 29.9%, and ADRs may adjust down to $123.
- Understanding both the seasonal averages and these monthly peaks and troughs in revenue, occupancy, and ADR is crucial for maximizing your Airbnb profit potential in Gander.
Seasonal Strategies for Maximizing Profit
- Peak Season: Maximize revenue through premium pricing and potentially longer minimum stays. Ensure high availability.
- Low Season: Offer competitive pricing, special promotions (e.g., extended stay discounts), and flexible cancellation policies. Target off-season travelers like remote workers or budget-conscious guests.
- Shoulder Seasons: Implement dynamic pricing that balances peak and low rates. Target weekend travelers or specific events. Offer slightly more flexible terms than peak season.
- Regularly analyze your own performance against these Gander seasonality benchmarks and adjust your pricing and availability strategy accordingly.
Best Areas for Airbnb Investment in Gander (2025)
Exploring the top neighborhoods for short-term rentals in Gander? This section highlights key areas, outlining why they are attractive for hosts and guests, along with notable local attractions. Consider these locations based on your target guest profile and investment strategy.
| Neighborhood / Area | Why Host Here? (Target Guests & Appeal) | Key Attractions & Landmarks |
|---|---|---|
| Downtown Gander | Central area of Gander, ideal for visitors who want to be close to shops and restaurants. Offers a mix of local culture and convenience for travelers. | Silent Witness Memorial, Little Harbour Marina, Thomas Howe Demonstration Forest, Gander Heritage Memorial Park |
| Gander Lake | A beautiful natural area perfect for those seeking outdoor activities like fishing and boating. Attractive to families and nature enthusiasts. | Gander Lake, Gander Golf Club, Gander Heritage Museum, walking and hiking trails |
| Airport Boulevard | Close to the Gander International Airport, catering to travelers looking for convenience; ideal for business travelers and short stays. | Gander International Airport, local dining options, nearby business centers |
| Elvis Presley Boulevard | Famous for its Elvis connection, this area draws music fans and tourists interested in unique local stories. | Johnny Cash and Elvis Presley artifacts, local music events, cultural exhibitions |
| Community Centre Area | This area is popular for its community spirit, hosting sports events and activities. Good for families and visitors engaged in local events. | Community Centre, local festivals and events, sports facilities |
| Wildlife Areas | Attracts nature lovers and wildlife enthusiasts looking for rustic scenery and outdoor experiences. | Gander River, nature trails, birdwatching spots |
| Marina Park | A scenic waterfront area great for relaxation and activities by the water. Popular with families and outdoor lovers. | water activities, picnic areas, trails around the park |
| Historic Gander | Features charming historic buildings and sites, appealing to tourists interested in the history and culture of the area. | Gander Heritage Museum, local historic sites, cultural landmarks |
Understanding Airbnb License Requirements & STR Laws in Gander (2025)
With 29% of listings showing registration in 2025, understanding potential Airbnb license requirements is crucial in Gander. Always verify the latest short term rental regulations and Airbnb license requirements directly with local government authorities for Gander to ensure full compliance before hosting.
(Source: AirROI data, 2025, based on 29% licensed listings)
Top Performing Airbnb Properties in Gander (2025)
Benchmark your potential! Explore examples of top-performing Airbnb properties in Ganderbased on Trailing Twelve Month (TTM) revenue. Analyze their characteristics, revenue, occupancy rate, and ADR to understand what drives success in this market.

Relax Inn
Entire Place • 4 bedrooms
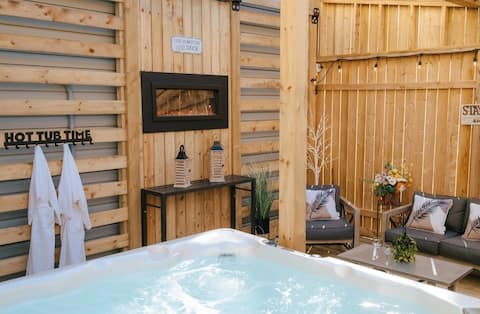
Stay Inn Style#5 With Fully Enclosed Hot Tub
Entire Place • 3 bedrooms

The Goodyear Getaway
Entire Place • 3 bedrooms

Newly renovated three bedroom duplex.
Entire Place • 3 bedrooms
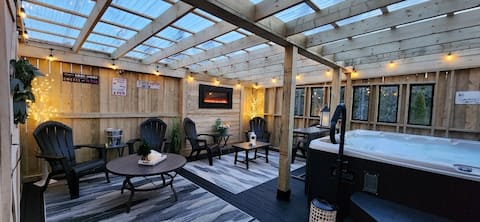
"Stay Inn Style" With Newly Installed Hottub
Entire Place • 2 bedrooms
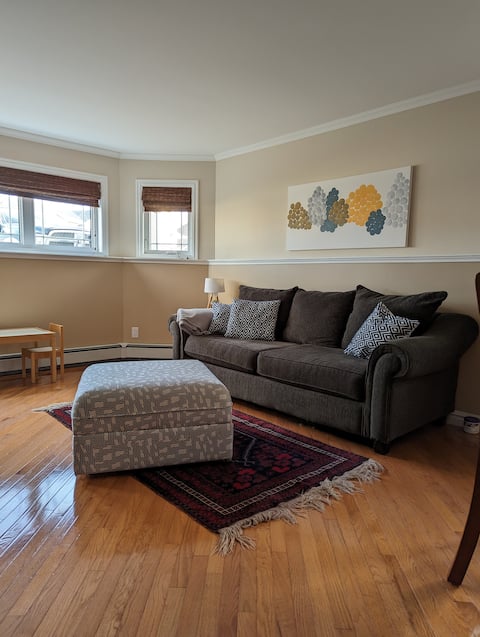
Spacious & cozy apartment in Gander
Entire Place • 2 bedrooms
Note: Performance varies based on location, size, amenities, seasonality, and management quality. Data reflects the past 12 months.
Top Performing Airbnb Hosts in Gander (2025)
Learn from the best! This table showcases top-performing Airbnb hosts in Gander based on the number of properties managed and estimated total revenue over the past year. Analyze their scale and performance metrics.
| Host Name | Properties | Grossing Revenue | Stay Reviews | Avg Rating |
|---|---|---|---|---|
| Seanna | 6 | $123,470 | 293 | 4.99/5.0 |
| Juanita | 4 | $79,835 | 501 | 4.94/5.0 |
| Jennifer | 1 | $48,043 | 46 | 4.98/5.0 |
| Roger | 1 | $36,372 | 32 | 5.00/5.0 |
| Sally | 1 | $34,452 | 140 | 4.85/5.0 |
| Julie | 1 | $31,009 | 20 | 4.85/5.0 |
| Rob | 1 | $26,065 | 91 | 4.98/5.0 |
| Host #240890431 | 1 | $25,226 | 12 | 4.58/5.0 |
| Melanie | 1 | $24,989 | 29 | 4.93/5.0 |
| Ryan | 1 | $24,643 | 92 | 4.95/5.0 |
Analyzing the strategies of top hosts, such as their property selection, pricing, and guest communication, can offer valuable lessons for optimizing your own Airbnb operations in Gander.
Dive Deeper: Advanced Gander STR Market Data (2025)
Ready to unlock more insights? AirROI provides access to advanced metrics and comprehensive Airbnb data for Gander. Explore detailed analytics beyond this report to refine your investment strategy, optimize pricing, and maximize your vacation rental profits.
Explore Advanced MetricsGander Short-Term Rental Market Composition (2025): Property & Room Types
Room Type Distribution
Property Type Distribution
Market Composition Insights for Gander
- The Gander Airbnb market composition is heavily skewed towards Entire Home/Apt listings, which make up 96.4% of the 28 active rentals. This indicates strong guest preference for privacy and space.
- Looking at the property type distribution in Gander, Apartment/Condo properties are the most common (53.6%), reflecting the local real estate landscape.
- Houses represent a significant 46.4% portion, catering likely to families or larger groups.
Gander Airbnb Room Capacity Analysis (2025): Bedroom Distribution
Distribution of Listings by Number of Bedrooms
Room Capacity Insights for Gander
- The dominant room capacity in Gander is 2 bedrooms listings, making up 35.7% of the market. This suggests a strong demand for properties suitable for couples or solo travelers.
- Together, 2 bedrooms and 3 bedrooms properties represent 71.4% of the active Airbnb listings in Gander, indicating a high concentration in these sizes.
- A significant 39.3% of listings offer 3+ bedrooms, catering to larger groups and families seeking more space in Gander.
Gander Vacation Rental Guest Capacity Trends (2025)
Distribution of Listings by Guest Capacity
Guest Capacity Insights for Gander
- The most common guest capacity trend in Gander vacation rentals is listings accommodating 4 guests (39.3%). This suggests the primary traveler segment is likely small families or groups.
- Properties designed for 4 guests and 6 guests dominate the Gander STR market, accounting for 57.2% of listings.
- 35.8% of properties accommodate 6+ guests, serving the market segment for larger families or group travel in Gander.
- On average, properties in Gander are equipped to host 4.9 guests.
Gander Airbnb Booking Patterns (2025): Available vs. Booked Days
Available Days Distribution
Booked Days Distribution
Booking Pattern Insights for Gander
- The most common availability pattern in Gander falls within the 181-270 days range, representing 39.3% of listings. This suggests many properties have significant open periods on their calendars.
- Approximately 60.7% of listings show high availability (181+ days open annually), indicating potential for increased bookings or specific owner usage patterns.
- For booked days, the 91-180 days range is most frequent in Gander (42.9%), reflecting common guest stay durations or potential owner blocking patterns.
- A notable 39.3% of properties secure long booking periods (181+ days booked per year), highlighting successful long-term rental strategies or significant owner usage.
Gander Airbnb Minimum Stay Requirements Analysis
Distribution of Listings by Minimum Night Requirement
1 Night
15 listings
65.2% of total
2 Nights
7 listings
30.4% of total
30+ Nights
1 listings
4.3% of total
Key Insights
- The most prevalent minimum stay requirement in Gander is 1 Night, adopted by 65.2% of listings. This highlights the market's preference for shorter, flexible bookings.
- A strong majority (95.6%) of the Gander Airbnb data shows acceptance of very short stays (1-2 nights), indicating a dynamic, high-turnover market.
Recommendations
- Align with the market by considering a 1 Night minimum stay, as 65.2% of Gander hosts use this setting.
- Adjust minimum nights based on seasonality – potentially shorter during low season and longer during peak demand periods in Gander.
Gander Airbnb Cancellation Policy Trends Analysis (2025)
Flexible
5 listings
20.8% of total
Moderate
9 listings
37.5% of total
Firm
6 listings
25% of total
Strict
4 listings
16.7% of total
Cancellation Policy Insights for Gander
- The prevailing Airbnb cancellation policy trend in Gander is Moderate, used by 37.5% of listings.
- There's a relatively balanced mix between guest-friendly (58.3%) and stricter (41.7%) policies, offering choices for different guest needs.
Recommendations for Hosts
- Consider adopting a Moderate policy to align with the 37.5% market standard in Gander.
- Regularly review your cancellation policy against competitors and market demand shifts in Gander.
Gander STR Booking Lead Time Analysis (2025)
Average Booking Lead Time by Month
Booking Lead Time Insights for Gander
- The overall average booking lead time for vacation rentals in Gander is 44 days.
- Guests book furthest in advance for stays during June (average 89 days), likely coinciding with peak travel demand or local events.
- The shortest booking windows occur for stays in January (average 20 days), indicating more last-minute travel plans during this time.
- Seasonally, Spring (80 days avg.) sees the longest lead times, while Winter (24 days avg.) has the shortest, reflecting typical travel planning cycles.
Recommendations for Hosts
- Use the overall average lead time (44 days) as a baseline for your pricing and availability strategy in Gander.
- For June stays, consider implementing length-of-stay discounts or slightly higher rates for bookings made less than 89 days out to capitalize on advance planning.
- Target marketing efforts for the Spring season well in advance (at least 80 days) to capture early planners.
- Monitor your own booking lead times against these Gander averages to identify opportunities for dynamic pricing adjustments.
Popular & Essential Airbnb Amenities in Gander (2025)
Amenity Prevalence
Amenity Insights for Gander
- Essential amenities in Gander that guests expect include: Free parking on premises, Fire extinguisher, Wifi, Smoke alarm, TV, Kitchen, Heating. Lacking these (any) could significantly impact bookings.
- Popular amenities like Hot water, Washer, Cooking basics are common but not universal. Offering these can provide a competitive edge.
Recommendations for Hosts
- Ensure your listing includes all essential amenities for Gander: Free parking on premises, Fire extinguisher, Wifi, Smoke alarm, TV, Kitchen, Heating.
- Prioritize adding missing essentials: Heating.
- Consider adding popular differentiators like Hot water or Washer to increase appeal.
- Highlight unique or less common amenities you offer (e.g., hot tub, dedicated workspace, EV charger) in your listing description and photos.
- Regularly check competitor amenities in Gander to stay competitive.
Gander Airbnb Guest Demographics & Profile Analysis (2025)
Guest Profile Summary for Gander
- The typical guest profile for Airbnb in Gander consists of primarily domestic travelers (89%), often arriving from nearby St. John's, typically belonging to the Post-2000s (Gen Z/Alpha) group (50%), primarily speaking English or French.
- Domestic travelers account for 88.9% of guests.
- Key international markets include Canada (88.9%) and United States (8.3%).
- Top languages spoken are English (76%) followed by French (14.2%).
- A significant demographic segment is the Post-2000s (Gen Z/Alpha) group, representing 50% of guests.
Recommendations for Hosts
- Target domestic marketing efforts towards travelers from St. John's and Corner Brook.
- Tailor amenities and listing descriptions to appeal to the dominant Post-2000s (Gen Z/Alpha) demographic (e.g., highlight fast WiFi, smart home features, local guides).
- Highlight unique local experiences or amenities relevant to the primary guest profile.
- Consider seasonal promotions aligned with peak travel times for key origin markets.
Nearby Short-Term Rental Market Comparison
How does the Gander Airbnb market stack up against its neighbors? Compare key performance metrics like average monthly revenue, ADR, and occupancy rates in surrounding areas to understand the broader regional STR landscape.
| Market | Active Properties | Monthly Revenue | Daily Rate | Avg. Occupancy |
|---|---|---|---|---|
| Bay Roberts | 11 | $2,187 | $132.00 | 48% |
| Newfoundland and Labrador | 36 | $2,112 | $219.54 | 46% |
| Dildo | 26 | $1,981 | $180.18 | 41% |
| Placentia | 17 | $1,972 | $206.30 | 45% |
| Port Rexton | 28 | $1,918 | $174.25 | 50% |
| Joe Batt's Arm-Barr'd Islands-Shoal Bay | 11 | $1,914 | $159.03 | 51% |
| Trinity Bay North | 18 | $1,854 | $148.92 | 52% |
| Gambo | 12 | $1,708 | $153.14 | 39% |
| Holyrood | 12 | $1,677 | $180.05 | 37% |
| Twillingate | 104 | $1,610 | $139.63 | 50% |