Churchill Airbnb Market Analysis 2025: Short Term Rental Data & Vacation Rental Statistics in Manitoba, Canada
Is Airbnb profitable in Churchill in 2025? Explore comprehensive Airbnb analytics for Churchill, Manitoba, Canada to uncover income potential. This 2025 STR market report for Churchill, based on AirROI data from April 2024 to March 2025, reveals key trends in the niche market of 20 active listings.
Whether you're considering an Airbnb investment in Churchill, optimizing your existing vacation rental, or exploring rental arbitrage opportunities, understanding the Churchill Airbnb data is crucial. Leveraging the low regulation environment is key to maximizing your short term rental income potential. Let's dive into the specifics.
Key Churchill Airbnb Performance Metrics Overview
Monthly Airbnb Revenue Variations & Income Potential in Churchill (2025)
Understanding the monthly revenue variations for Airbnb listings in Churchill is key to maximizing your short term rental income potential. Seasonality significantly impacts earnings. Our analysis, based on data from the past 12 months, shows that the peak revenue month for STRs in Churchill is typically October, while May often presents the lowest earnings, highlighting opportunities for strategic pricing adjustments during shoulder and low seasons. Explore the typical Airbnb income in Churchill across different performance tiers:
- Best-in-class properties (Top 10%) achieve $5,587+ monthly, often utilizing dynamic pricing and superior guest experiences.
- Strong performing properties (Top 25%) earn $2,657 or more, indicating effective management and desirable locations/amenities.
- Typical properties (Median) generate around $1,561 per month, representing the average market performance.
- Entry-level properties (Bottom 25%) see earnings around $1,059, often with potential for optimization.
Average Monthly Airbnb Earnings Trend in Churchill
Churchill Airbnb Occupancy Rate Trends (2025)
Maximize your bookings by understanding the Churchill STR occupancy trends. Seasonal demand shifts significantly influence how often properties are booked. Typically, Octobersees the highest demand (peak season occupancy), while May experiences the lowest (low season). Effective strategies, like adjusting minimum stays or offering promotions, can boost occupancy during slower periods. Here's how different property tiers perform in Churchill:
- Best-in-class properties (Top 10%) achieve 66%+ occupancy, indicating high desirability and potentially optimized availability.
- Strong performing properties (Top 25%) maintain 54% or higher occupancy, suggesting good market fit and guest satisfaction.
- Typical properties (Median) have an occupancy rate around 39%.
- Entry-level properties (Bottom 25%) average 25% occupancy, potentially facing higher vacancy.
Average Monthly Occupancy Rate Trend in Churchill
Average Daily Rate (ADR) Airbnb Trends in Churchill (2025)
Effective short term rental pricing strategy in Churchill involves understanding monthly ADR fluctuations. The Average Daily Rate (ADR) for Airbnb in Churchill typically peaks in October and dips lowest during March. Leveraging Airbnb dynamic pricing tools or strategies based on this seasonality can significantly boost revenue. Here's a look at the typical nightly rates achieved:
- Best-in-class properties (Top 10%) command rates of $443+ per night, often due to premium features or locations.
- Strong performing properties (Top 25%) achieve nightly rates of $319 or more.
- Typical properties (Median) charge around $135 per night.
- Entry-level properties (Bottom 25%) earn around $113 per night.
Average Daily Rate (ADR) Trend by Month in Churchill
Get Live Churchill Market Intelligence 👇

Explore Real-time Analytics
Airbnb Seasonality Analysis & Trends in Churchill (2025)
Peak Season (October, November, July)
- Revenue averages $3,358 per month
- Occupancy rates average 55.0%
- Daily rates average $300
Shoulder Season
- Revenue averages $2,195 per month
- Occupancy maintains around 36.9%
- Daily rates hold near $251
Low Season (February, March, May)
- Revenue drops to average $1,469 per month
- Occupancy decreases to average 28.8%
- Daily rates adjust to average $221
Seasonality Insights for Churchill
- The Airbnb seasonality in Churchill shows highly seasonal trends requiring careful strategy. While the sections above show seasonal averages, it's also insightful to look at the extremes:
- During the high season, the absolute peak month showcases Churchill's highest earning potential, with monthly revenues capable of climbing to $3,893, occupancy reaching a high of 58.9%, and ADRs peaking at $335.
- Conversely, the slowest single month of the year, typically falling within the low season, marks the market's lowest point. In this month, revenue might dip to $826, occupancy could drop to 14.0%, and ADRs may adjust down to $195.
- Understanding both the seasonal averages and these monthly peaks and troughs in revenue, occupancy, and ADR is crucial for maximizing your Airbnb profit potential in Churchill.
Seasonal Strategies for Maximizing Profit
- Peak Season: Maximize revenue through premium pricing and potentially longer minimum stays. Ensure high availability.
- Low Season: Offer competitive pricing, special promotions (e.g., extended stay discounts), and flexible cancellation policies. Target off-season travelers like remote workers or budget-conscious guests.
- Shoulder Seasons: Implement dynamic pricing that balances peak and low rates. Target weekend travelers or specific events. Offer slightly more flexible terms than peak season.
- Regularly analyze your own performance against these Churchill seasonality benchmarks and adjust your pricing and availability strategy accordingly.
Best Areas for Airbnb Investment in Churchill (2025)
Exploring the top neighborhoods for short-term rentals in Churchill? This section highlights key areas, outlining why they are attractive for hosts and guests, along with notable local attractions. Consider these locations based on your target guest profile and investment strategy.
| Neighborhood / Area | Why Host Here? (Target Guests & Appeal) | Key Attractions & Landmarks |
|---|---|---|
| Hudson Bay | The historic significance and unique Arctic ecosystem make this area appealing for tourists interested in nature and wildlife experiences. Hodgson Bay offers seasonal polar bear sightings, attracting visitors worldwide. | Churchill Northern Studies Centre, Polar Bear Viewing Tours, Cape Merry, Wapusk National Park, Churchill Wildlife Management Area |
| Churchill Town Centre | The Town Centre is the heart of Churchill, providing accommodations, dining, and shopping options. It is convenient for travelers looking to immerse themselves in local culture and community. | Churchill Visitor Centre, Itsukumi Talent Show & Cultural Fest, Local shops and restaurants, Cape Merry, Churchill River |
| Churchill Beach | This scenic area offers stunning views of the Hudson Bay and is popular for outdoor activities such as kayaking and whale watching. Ideal for Airbnb hosts who want to cater to nature enthusiasts. | Churchill Beach, Kayak tours, Beluga whale watching, Scenic coastal trails, recreational fishing |
| Polar Bear Alley | A unique natural corridor for polar bears to cross; attracts wildlife fans and photographers. Access to guided tours can be a significant draw for Airbnb guests seeking memorable wildlife encounters. | Guided polar bear tours, Tundra Buggy Adventures, Wildlife photography spots, Scenic tundra landscapes, Nature hikes |
| Fort Prince of Wales | This historic fort site provides insights into Canada's fur trade history and is a captivating spot for history buffs, making it perfect for Airbnb guests with interests in heritage. | Fort Prince of Wales National Historic Site, Interpretive trails, Scenic views of the bay, Heritage displays, Historical reenactments |
| Tundra Region | The expansive tundra offers visitors a chance to see unique flora and fauna, particularly during the summer months. This region is perfect for eco-tourism and outdoor lovers. | Tundra Buggy Tours, Wildlife viewing, Hiking trails, Birdwatching spots, Photography opportunities |
| Churchill River | The river area hosts various outdoor activities like kayaking and fishing. Its picturesque landscape makes it a lovely getaway for guests who appreciate nature and adventure. | Kayaking on the Churchill River, Fishing expeditions, Scenic boat tours, Birdwatching, Nature trails |
| Cape Churchill | Known for its stunning landscapes, Cape Churchill is favored by hikers and wildlife researchers alike. This remote area offers a unique escape from urban life for adventurous guests. | Beautiful hiking trails, Wildlife research stations, Photographic opportunities, Remote wilderness, Scenic lookout points |
Understanding Airbnb License Requirements & STR Laws in Churchill (2025)
While Churchill, Manitoba, Canada currently shows low STR regulations, specific Airbnb license requirements might still exist or change. Always verify the latest short term rental regulations and Airbnb license requirements directly with local government authorities for Churchill to ensure full compliance before hosting.
(Source: AirROI data, 2025, finding no licensed listings among those analyzed)
Top Performing Airbnb Properties in Churchill (2025)
Benchmark your potential! Explore examples of top-performing Airbnb properties in Churchillbased on Trailing Twelve Month (TTM) revenue. Analyze their characteristics, revenue, occupancy rate, and ADR to understand what drives success in this market.
Beluga Beach House, Full House
Entire Place • 4 bedrooms
Caribou Cottage, Full House
Entire Place • 4 bedrooms
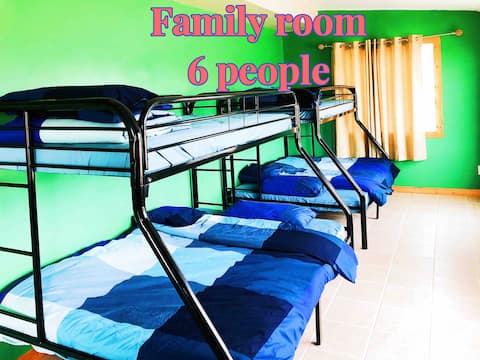
Beluga Beach House, Room 3
Private Room • N/A

Beluga Beach House, Room 4
Private Room • N/A

Beluga Beach House, Room 1
Private Room • N/A
【NO.5 Sarah's dreamhouse】free breakfast & pick up
Private Room • N/A
Note: Performance varies based on location, size, amenities, seasonality, and management quality. Data reflects the past 12 months.
Top Performing Airbnb Hosts in Churchill (2025)
Learn from the best! This table showcases top-performing Airbnb hosts in Churchill based on the number of properties managed and estimated total revenue over the past year. Analyze their scale and performance metrics.
| Host Name | Properties | Grossing Revenue | Stay Reviews | Avg Rating |
|---|---|---|---|---|
| Roy | 10 | $263,995 | 73 | 3.50/5.0 |
| Dave | 4 | $44,543 | 16 | 3.75/5.0 |
| Taylor | 4 | $42,764 | 60 | 5.00/5.0 |
| Bill | 1 | $5,005 | 39 | 4.72/5.0 |
| Host #397759777 | 1 | $2,889 | 0 | 0.00/5.0 |
Analyzing the strategies of top hosts, such as their property selection, pricing, and guest communication, can offer valuable lessons for optimizing your own Airbnb operations in Churchill.
Dive Deeper: Advanced Churchill STR Market Data (2025)
Ready to unlock more insights? AirROI provides access to advanced metrics and comprehensive Airbnb data for Churchill. Explore detailed analytics beyond this report to refine your investment strategy, optimize pricing, and maximize your vacation rental profits.
Explore Advanced MetricsChurchill Short-Term Rental Market Composition (2025): Property & Room Types
Room Type Distribution
Property Type Distribution
Market Composition Insights for Churchill
- The Churchill Airbnb market composition is heavily skewed towards Private Room listings, which make up 75% of the 20 active rentals. This indicates strong guest preference for privacy and space.
- Looking at the property type distribution in Churchill, House properties are the most common (80%), reflecting the local real estate landscape.
- Houses represent a significant 80% portion, catering likely to families or larger groups.
- The presence of 20% Hotel/Boutique listings indicates integration with traditional hospitality.
Churchill Airbnb Room Capacity Analysis (2025): Bedroom Distribution
Distribution of Listings by Number of Bedrooms
Room Capacity Insights for Churchill
- The dominant room capacity in Churchill is 4 bedrooms listings, making up 15% of the market. This suggests a strong demand for properties suitable for families or small groups.
- Together, 4 bedrooms and 1 bedroom properties represent 25.0% of the active Airbnb listings in Churchill, indicating a high concentration in these sizes.
Churchill Vacation Rental Guest Capacity Trends (2025)
Distribution of Listings by Guest Capacity
Guest Capacity Insights for Churchill
- The most common guest capacity trend in Churchill vacation rentals is listings accommodating 8+ guests (15%). This suggests the primary traveler segment is likely larger groups.
- Properties designed for 8+ guests and 2 guests dominate the Churchill STR market, accounting for 25.0% of listings.
- 25.0% of properties accommodate 6+ guests, serving the market segment for larger families or group travel in Churchill.
- On average, properties in Churchill are equipped to host 2.0 guests.
Churchill Airbnb Booking Patterns (2025): Available vs. Booked Days
Available Days Distribution
Booked Days Distribution
Booking Pattern Insights for Churchill
- The most common availability pattern in Churchill falls within the 181-270 days range, representing 55% of listings. This suggests many properties have significant open periods on their calendars.
- Approximately 95.0% of listings show high availability (181+ days open annually), indicating potential for increased bookings or specific owner usage patterns.
- For booked days, the 91-180 days range is most frequent in Churchill (55%), reflecting common guest stay durations or potential owner blocking patterns.
- A notable 5.0% of properties secure long booking periods (181+ days booked per year), highlighting successful long-term rental strategies or significant owner usage.
Churchill Airbnb Minimum Stay Requirements Analysis
Distribution of Listings by Minimum Night Requirement
2 Nights
20 listings
100% of total
Key Insights
- The most prevalent minimum stay requirement in Churchill is 2 Nights, adopted by 100% of listings. This highlights the market's preference for shorter, flexible bookings.
- A strong majority (100.0%) of the Churchill Airbnb data shows acceptance of very short stays (1-2 nights), indicating a dynamic, high-turnover market.
Recommendations
- Align with the market by considering a 2 Nights minimum stay, as 100% of Churchill hosts use this setting.
- A 2-night minimum appears standard (100%). Consider this for weekends or peak periods.
- Adjust minimum nights based on seasonality – potentially shorter during low season and longer during peak demand periods in Churchill.
Churchill Airbnb Cancellation Policy Trends Analysis (2025)
Flexible
2 listings
13.3% of total
Strict
13 listings
86.7% of total
Cancellation Policy Insights for Churchill
- The prevailing Airbnb cancellation policy trend in Churchill is Strict, used by 86.7% of listings.
- A majority (86.7%) of hosts in Churchill utilize Firm or Strict policies, indicating a market where hosts prioritize booking security.
Recommendations for Hosts
- Consider adopting a Strict policy to align with the 86.7% market standard in Churchill.
- With 86.7% using Strict terms, this is a viable option in Churchill, particularly for high-value properties or during peak demand periods.
- Regularly review your cancellation policy against competitors and market demand shifts in Churchill.
Churchill STR Booking Lead Time Analysis (2025)
Average Booking Lead Time by Month
Booking Lead Time Insights for Churchill
- The overall average booking lead time for vacation rentals in Churchill is 88 days.
- Guests book furthest in advance for stays during October (average 156 days), likely coinciding with peak travel demand or local events.
- The shortest booking windows occur for stays in April (average 17 days), indicating more last-minute travel plans during this time.
- Seasonally, Fall (133 days avg.) sees the longest lead times, while Spring (63 days avg.) has the shortest, reflecting typical travel planning cycles.
Recommendations for Hosts
- Use the overall average lead time (88 days) as a baseline for your pricing and availability strategy in Churchill.
- For October stays, consider implementing length-of-stay discounts or slightly higher rates for bookings made less than 156 days out to capitalize on advance planning.
- Target marketing efforts for the Fall season well in advance (at least 133 days) to capture early planners.
- Monitor your own booking lead times against these Churchill averages to identify opportunities for dynamic pricing adjustments.
Popular & Essential Airbnb Amenities in Churchill (2025)
Amenity Prevalence
Amenity Insights for Churchill
- Essential amenities in Churchill that guests expect include: Free parking on premises, Fire extinguisher, Kitchen, Smoke alarm, Hot water, Wifi, Washer, Heating. Lacking these (any) could significantly impact bookings.
- Popular amenities like Bed linens, Dryer are common but not universal. Offering these can provide a competitive edge.
Recommendations for Hosts
- Ensure your listing includes all essential amenities for Churchill: Free parking on premises, Fire extinguisher, Kitchen, Smoke alarm, Hot water, Wifi, Washer, Heating.
- Prioritize adding missing essentials: Hot water, Wifi, Washer, Heating.
- Consider adding popular differentiators like Bed linens or Dryer to increase appeal.
- Highlight unique or less common amenities you offer (e.g., hot tub, dedicated workspace, EV charger) in your listing description and photos.
- Regularly check competitor amenities in Churchill to stay competitive.
Churchill Airbnb Guest Demographics & Profile Analysis (2025)
Guest Profile Summary for Churchill
- The typical guest profile for Airbnb in Churchill consists of predominantly international visitors (67%), with top international origins including Canada, typically belonging to the Post-2000s (Gen Z/Alpha) group (50%), primarily speaking English or Spanish.
- Domestic travelers account for 32.6% of guests.
- Key international markets include United States (39.5%) and Canada (32.6%).
- Top languages spoken are English (58.1%) followed by Spanish (12.9%).
- A significant demographic segment is the Post-2000s (Gen Z/Alpha) group, representing 50% of guests.
Recommendations for Hosts
- Focus marketing internationally, particularly towards travelers from Canada.
- Tailor amenities and listing descriptions to appeal to the dominant Post-2000s (Gen Z/Alpha) demographic (e.g., highlight fast WiFi, smart home features, local guides).
- Highlight unique local experiences or amenities relevant to the primary guest profile.
- Consider seasonal promotions aligned with peak travel times for key origin markets.