View Royal Airbnb Market Analysis 2025: Short Term Rental Data & Vacation Rental Statistics in British Columbia, Canada
Is Airbnb profitable in View Royal in 2025? Explore comprehensive Airbnb analytics for View Royal, British Columbia, Canada to uncover income potential. This 2025 STR market report for View Royal, based on AirROI data from April 2024 to March 2025, reveals key trends in the niche market of 38 active listings.
Whether you're considering an Airbnb investment in View Royal, optimizing your existing vacation rental, or exploring rental arbitrage opportunities, understanding the View Royal Airbnb data is crucial. Leveraging the low regulation environment is key to maximizing your short term rental income potential. Let's dive into the specifics.
Key View Royal Airbnb Performance Metrics Overview
Monthly Airbnb Revenue Variations & Income Potential in View Royal (2025)
Understanding the monthly revenue variations for Airbnb listings in View Royal is key to maximizing your short term rental income potential. Seasonality significantly impacts earnings. Our analysis, based on data from the past 12 months, shows that the peak revenue month for STRs in View Royal is typically August, while January often presents the lowest earnings, highlighting opportunities for strategic pricing adjustments during shoulder and low seasons. Explore the typical Airbnb income in View Royal across different performance tiers:
- Best-in-class properties (Top 10%) achieve $4,499+ monthly, often utilizing dynamic pricing and superior guest experiences.
- Strong performing properties (Top 25%) earn $2,615 or more, indicating effective management and desirable locations/amenities.
- Typical properties (Median) generate around $1,876 per month, representing the average market performance.
- Entry-level properties (Bottom 25%) see earnings around $1,186, often with potential for optimization.
Average Monthly Airbnb Earnings Trend in View Royal
View Royal Airbnb Occupancy Rate Trends (2025)
Maximize your bookings by understanding the View Royal STR occupancy trends. Seasonal demand shifts significantly influence how often properties are booked. Typically, Augustsees the highest demand (peak season occupancy), while January experiences the lowest (low season). Effective strategies, like adjusting minimum stays or offering promotions, can boost occupancy during slower periods. Here's how different property tiers perform in View Royal:
- Best-in-class properties (Top 10%) achieve 93%+ occupancy, indicating high desirability and potentially optimized availability.
- Strong performing properties (Top 25%) maintain 81% or higher occupancy, suggesting good market fit and guest satisfaction.
- Typical properties (Median) have an occupancy rate around 65%.
- Entry-level properties (Bottom 25%) average 42% occupancy, potentially facing higher vacancy.
Average Monthly Occupancy Rate Trend in View Royal
Average Daily Rate (ADR) Airbnb Trends in View Royal (2025)
Effective short term rental pricing strategy in View Royal involves understanding monthly ADR fluctuations. The Average Daily Rate (ADR) for Airbnb in View Royal typically peaks in November and dips lowest during April. Leveraging Airbnb dynamic pricing tools or strategies based on this seasonality can significantly boost revenue. Here's a look at the typical nightly rates achieved:
- Best-in-class properties (Top 10%) command rates of $172+ per night, often due to premium features or locations.
- Strong performing properties (Top 25%) achieve nightly rates of $131 or more.
- Typical properties (Median) charge around $88 per night.
- Entry-level properties (Bottom 25%) earn around $70 per night.
Average Daily Rate (ADR) Trend by Month in View Royal
Get Live View Royal Market Intelligence 👇

Explore Real-time Analytics
Airbnb Seasonality Analysis & Trends in View Royal (2025)
Peak Season (August, June, July)
- Revenue averages $2,836 per month
- Occupancy rates average 72.1%
- Daily rates average $111
Shoulder Season
- Revenue averages $2,211 per month
- Occupancy maintains around 58.8%
- Daily rates hold near $110
Low Season (January, March, December)
- Revenue drops to average $1,905 per month
- Occupancy decreases to average 51.8%
- Daily rates adjust to average $112
Seasonality Insights for View Royal
- The Airbnb seasonality in View Royal shows moderate seasonality with distinct peak and low periods. While the sections above show seasonal averages, it's also insightful to look at the extremes:
- During the high season, the absolute peak month showcases View Royal's highest earning potential, with monthly revenues capable of climbing to $2,987, occupancy reaching a high of 78.5%, and ADRs peaking at $114.
- Conversely, the slowest single month of the year, typically falling within the low season, marks the market's lowest point. In this month, revenue might dip to $1,734, occupancy could drop to 46.3%, and ADRs may adjust down to $107.
- Understanding both the seasonal averages and these monthly peaks and troughs in revenue, occupancy, and ADR is crucial for maximizing your Airbnb profit potential in View Royal.
Seasonal Strategies for Maximizing Profit
- Peak Season: Maximize revenue through premium pricing and potentially longer minimum stays. Ensure high availability.
- Low Season: Offer competitive pricing, special promotions (e.g., extended stay discounts), and flexible cancellation policies. Target off-season travelers like remote workers or budget-conscious guests.
- Shoulder Seasons: Implement dynamic pricing that balances peak and low rates. Target weekend travelers or specific events. Offer slightly more flexible terms than peak season.
- Regularly analyze your own performance against these View Royal seasonality benchmarks and adjust your pricing and availability strategy accordingly.
Best Areas for Airbnb Investment in View Royal (2025)
Exploring the top neighborhoods for short-term rentals in View Royal? This section highlights key areas, outlining why they are attractive for hosts and guests, along with notable local attractions. Consider these locations based on your target guest profile and investment strategy.
| Neighborhood / Area | Why Host Here? (Target Guests & Appeal) | Key Attractions & Landmarks |
|---|---|---|
| Esquimalt Lagoon | A beautiful natural area perfect for families and nature lovers, with stunning views and wildlife. Close proximity to Victoria and a peaceful retreat atmosphere. | Esquimalt Lagoon, Royal Roads University, Hatley Castle, Beach access, Nature trails |
| Bear Mountain | An upscale community known for its golf courses and outdoor activities. Ideal for visitors looking for luxury accommodations and access to nature. | Bear Mountain Golf Resort, Hiking and biking trails, Royal Colwood Golf Club, Spas and wellness centers |
| Victoria Harbour | A vibrant waterfront area in nearby Victoria with shops, restaurants, and attractions. Perfect for tourists looking to explore the city and enjoy the waterfront. | Fisherman's Wharf Park, Royal BC Museum, Government Street shopping, Inner Harbour attractions, Victoria's nightlife |
| Goldstream Provincial Park | A stunning park known for its hiking trails and natural beauty. Great for outdoor enthusiasts and those looking to connect with nature. | Goldstream Falls, Hiking trails, Wildlife viewing, Visitor Centre, Camping opportunities |
| Sooke Hills | A tranquil area with lush forests and stunning views, appealing to those looking for a peaceful getaway close to nature. | Sooke Potholes Provincial Park, Hiking trails, Lakes and fishing spots, Scenic viewpoints, Beach access |
| Mill Hill | A residential area with beautiful views of the region. Offers a quieter stay while still being close to urban amenities and attractions. | Mill Hill Regional Park, Scenic views of the Saanich Inlet, Hiking and biking trails, Community parks, Easy access to downtown Victoria |
| Langford | A rapidly growing community with plenty of amenities, attracting both tourists and business travelers looking for convenient accommodations. | Langford Lake, Westshore Town Centre, Shopping and dining options, Outdoor recreational activities, Public parks |
| Downtown Victoria | The bustling core of the city, rich in history and culture. Perfect for tourists who want to be at the heart of the action with easy access to attractions. | BC Legislature, Empress Hotel, Cultural venues, Restaurants and cafes, Shopping District |
Understanding Airbnb License Requirements & STR Laws in View Royal (2025)
While View Royal, British Columbia, Canada currently shows low STR regulations, specific Airbnb license requirements might still exist or change. Always verify the latest short term rental regulations and Airbnb license requirements directly with local government authorities for View Royal to ensure full compliance before hosting.
(Source: AirROI data, 2025, finding no licensed listings among those analyzed)
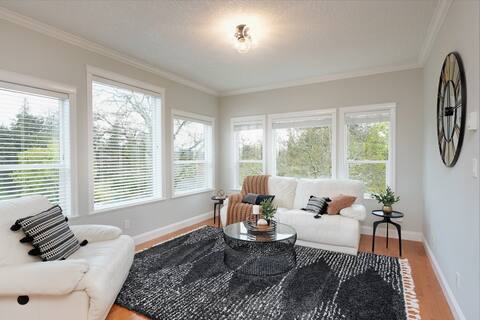
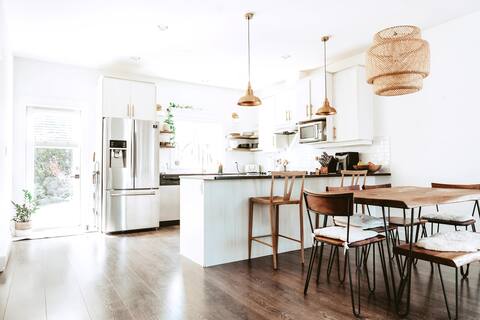
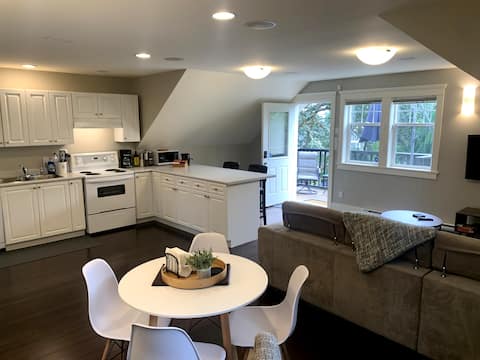
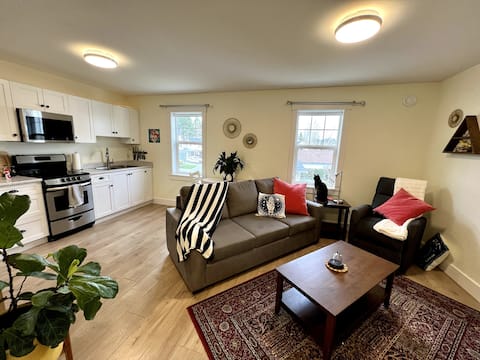
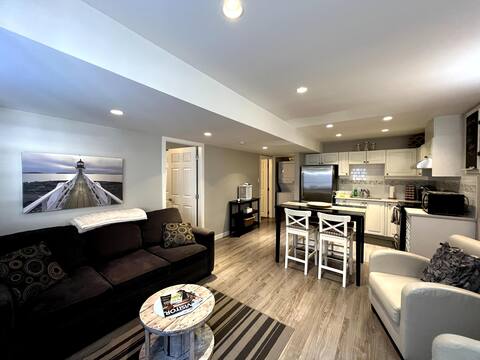
Top Performing Airbnb Properties in View Royal (2025)
Benchmark your potential! Explore examples of top-performing Airbnb properties in View Royalbased on Trailing Twelve Month (TTM) revenue. Analyze their characteristics, revenue, occupancy rate, and ADR to understand what drives success in this market.

Victoria Luxury Retreat: Private & Central
Entire Place • 3 bedrooms
Peacock Manor-Luxury 4bed/3bath Oceanside Home
Entire Place • 4 bedrooms
Family vacation home near the lake with hot tub!
Entire Place • 4 bedrooms
Beautiful 1 bed Carriage House in Saanich West
Entire Place • 1 bedroom
Sweet Clean Suite in View Royal-3 min to VGH
Entire Place • 1 bedroom
Tidal Waters Guest Suite
Entire Place • 1 bedroom
Note: Performance varies based on location, size, amenities, seasonality, and management quality. Data reflects the past 12 months.
Top Performing Airbnb Hosts in View Royal (2025)
Learn from the best! This table showcases top-performing Airbnb hosts in View Royal based on the number of properties managed and estimated total revenue over the past year. Analyze their scale and performance metrics.
| Host Name | Properties | Grossing Revenue | Stay Reviews | Avg Rating |
|---|---|---|---|---|
| Shelley | 1 | $71,415 | 57 | 4.98/5.0 |
| Jasmine | 1 | $68,442 | 23 | 4.91/5.0 |
| Kelsey | 1 | $57,564 | 21 | 4.57/5.0 |
| Heather | 1 | $45,617 | 71 | 4.92/5.0 |
| Kristine | 1 | $27,104 | 31 | 4.84/5.0 |
| Alyssa | 1 | $26,237 | 164 | 4.84/5.0 |
| John Cameron | 1 | $25,481 | 93 | 4.91/5.0 |
| Barbara | 1 | $24,050 | 74 | 4.85/5.0 |
| Elizabeth | 1 | $23,760 | 227 | 4.95/5.0 |
| Colin | 1 | $22,752 | 63 | 4.97/5.0 |
Analyzing the strategies of top hosts, such as their property selection, pricing, and guest communication, can offer valuable lessons for optimizing your own Airbnb operations in View Royal.
Dive Deeper: Advanced View Royal STR Market Data (2025)
Ready to unlock more insights? AirROI provides access to advanced metrics and comprehensive Airbnb data for View Royal. Explore detailed analytics beyond this report to refine your investment strategy, optimize pricing, and maximize your vacation rental profits.
Explore Advanced MetricsView Royal Short-Term Rental Market Composition (2025): Property & Room Types
Room Type Distribution
Property Type Distribution
Market Composition Insights for View Royal
- The View Royal Airbnb market composition is heavily skewed towards Entire Home/Apt listings, which make up 86.8% of the 38 active rentals. This indicates strong guest preference for privacy and space.
- Looking at the property type distribution in View Royal, Others properties are the most common (44.7%), reflecting the local real estate landscape.
- Houses represent a significant 36.8% portion, catering likely to families or larger groups.
- The presence of 10.5% Hotel/Boutique listings indicates integration with traditional hospitality.
View Royal Airbnb Room Capacity Analysis (2025): Bedroom Distribution
Distribution of Listings by Number of Bedrooms
Room Capacity Insights for View Royal
- The dominant room capacity in View Royal is 1 bedroom listings, making up 55.3% of the market. This suggests a strong demand for properties suitable for couples or solo travelers.
- Together, 1 bedroom and 2 bedrooms properties represent 71.1% of the active Airbnb listings in View Royal, indicating a high concentration in these sizes.
- With over half the market (55.3%) consisting of studios or 1-bedroom units, View Royal is particularly well-suited for individuals or couples.
View Royal Vacation Rental Guest Capacity Trends (2025)
Distribution of Listings by Guest Capacity
Guest Capacity Insights for View Royal
- The most common guest capacity trend in View Royal vacation rentals is listings accommodating 2 guests (39.5%). This suggests the primary traveler segment is likely couples or solo travelers.
- Properties designed for 2 guests and 4 guests dominate the View Royal STR market, accounting for 57.9% of listings.
- A significant 42.1% of listings cater specifically to 1-2 guests, highlighting strong demand from couples and solo travelers in View Royal.
- 15.8% of properties accommodate 6+ guests, serving the market segment for larger families or group travel in View Royal.
- On average, properties in View Royal are equipped to host 3.2 guests.
View Royal Airbnb Booking Patterns (2025): Available vs. Booked Days
Available Days Distribution
Booked Days Distribution
Booking Pattern Insights for View Royal
- The most common availability pattern in View Royal falls within the 271-366 days range, representing 31.6% of listings. This suggests many properties have significant open periods on their calendars.
- Approximately 60.5% of listings show high availability (181+ days open annually), indicating potential for increased bookings or specific owner usage patterns.
- For booked days, the 181-270 days range is most frequent in View Royal (28.9%), reflecting common guest stay durations or potential owner blocking patterns.
- A notable 42.1% of properties secure long booking periods (181+ days booked per year), highlighting successful long-term rental strategies or significant owner usage.
View Royal Airbnb Minimum Stay Requirements Analysis
Distribution of Listings by Minimum Night Requirement
1 Night
3 listings
8.8% of total
2 Nights
9 listings
26.5% of total
3 Nights
4 listings
11.8% of total
4-6 Nights
2 listings
5.9% of total
7-29 Nights
7 listings
20.6% of total
30+ Nights
9 listings
26.5% of total
Key Insights
- The most prevalent minimum stay requirement in View Royal is 2 Nights, adopted by 26.5% of listings. This highlights the market's preference for shorter, flexible bookings.
- A significant segment (26.5%) caters to monthly stays (30+ nights) in View Royal, pointing to opportunities in the extended-stay market.
Recommendations
- Align with the market by considering a 2 Nights minimum stay, as 26.5% of View Royal hosts use this setting.
- If feasible, allowing 1-night stays, especially midweek or during low season, could capture last-minute bookings, as only 8.8% currently do.
- Explore offering discounts for stays of 30+ nights to attract the 26.5% of the market seeking extended stays.
- Adjust minimum nights based on seasonality – potentially shorter during low season and longer during peak demand periods in View Royal.
View Royal Airbnb Cancellation Policy Trends Analysis (2025)
Flexible
5 listings
15.2% of total
Moderate
13 listings
39.4% of total
Firm
8 listings
24.2% of total
Strict
7 listings
21.2% of total
Cancellation Policy Insights for View Royal
- The prevailing Airbnb cancellation policy trend in View Royal is Moderate, used by 39.4% of listings.
- There's a relatively balanced mix between guest-friendly (54.6%) and stricter (45.4%) policies, offering choices for different guest needs.
Recommendations for Hosts
- Consider adopting a Moderate policy to align with the 39.4% market standard in View Royal.
- Regularly review your cancellation policy against competitors and market demand shifts in View Royal.
View Royal STR Booking Lead Time Analysis (2025)
Average Booking Lead Time by Month
Booking Lead Time Insights for View Royal
- The overall average booking lead time for vacation rentals in View Royal is 51 days.
- Guests book furthest in advance for stays during May (average 84 days), likely coinciding with peak travel demand or local events.
- The shortest booking windows occur for stays in February (average 28 days), indicating more last-minute travel plans during this time.
- Seasonally, Summer (67 days avg.) sees the longest lead times, while Winter (36 days avg.) has the shortest, reflecting typical travel planning cycles.
Recommendations for Hosts
- Use the overall average lead time (51 days) as a baseline for your pricing and availability strategy in View Royal.
- For May stays, consider implementing length-of-stay discounts or slightly higher rates for bookings made less than 84 days out to capitalize on advance planning.
- Target marketing efforts for the Summer season well in advance (at least 67 days) to capture early planners.
- Monitor your own booking lead times against these View Royal averages to identify opportunities for dynamic pricing adjustments.
Popular & Essential Airbnb Amenities in View Royal (2025)
Amenity Prevalence
Amenity Insights for View Royal
- Essential amenities in View Royal that guests expect include: Smoke alarm, Wifi, Essentials, Heating. Lacking these (any) could significantly impact bookings.
- Popular amenities like Free parking on premises, TV, Hot water are common but not universal. Offering these can provide a competitive edge.
Recommendations for Hosts
- Ensure your listing includes all essential amenities for View Royal: Smoke alarm, Wifi, Essentials, Heating.
- Prioritize adding missing essentials: Essentials, Heating.
- Consider adding popular differentiators like Free parking on premises or TV to increase appeal.
- Highlight unique or less common amenities you offer (e.g., hot tub, dedicated workspace, EV charger) in your listing description and photos.
- Regularly check competitor amenities in View Royal to stay competitive.
View Royal Airbnb Guest Demographics & Profile Analysis (2025)
Guest Profile Summary for View Royal
- The typical guest profile for Airbnb in View Royal consists of a mix of domestic (64%) and international guests, often arriving from nearby Calgary, typically belonging to the Post-2000s (Gen Z/Alpha) group (50%), primarily speaking English or French.
- Domestic travelers account for 63.7% of guests.
- Key international markets include Canada (63.7%) and United States (24.5%).
- Top languages spoken are English (68.1%) followed by French (9.3%).
- A significant demographic segment is the Post-2000s (Gen Z/Alpha) group, representing 50% of guests.
Recommendations for Hosts
- Target domestic marketing efforts towards travelers from Calgary and Toronto.
- Tailor amenities and listing descriptions to appeal to the dominant Post-2000s (Gen Z/Alpha) demographic (e.g., highlight fast WiFi, smart home features, local guides).
- Highlight unique local experiences or amenities relevant to the primary guest profile.
- Consider seasonal promotions aligned with peak travel times for key origin markets.
Nearby Short-Term Rental Market Comparison
How does the View Royal Airbnb market stack up against its neighbors? Compare key performance metrics like average monthly revenue, ADR, and occupancy rates in surrounding areas to understand the broader regional STR landscape.
| Market | Active Properties | Monthly Revenue | Daily Rate | Avg. Occupancy |
|---|---|---|---|---|
| Erlands Point-Kitsap Lake | 11 | $6,325 | $353.76 | 56% |
| Lake Goodwin | 11 | $4,949 | $371.43 | 44% |
| Amanda Park | 10 | $4,780 | $425.06 | 46% |
| Cape George Colony Club | 10 | $4,770 | $257.49 | 59% |
| Allyn | 20 | $4,462 | $415.57 | 36% |
| Sudden Valley | 65 | $4,390 | $286.32 | 53% |
| Olalla | 14 | $4,279 | $288.96 | 53% |
| Orcas Island | 13 | $4,220 | $514.57 | 39% |
| Friday Harbor | 219 | $4,187 | $371.96 | 45% |
| Moclips | 110 | $4,108 | $367.54 | 39% |