Victoria Airbnb Market Analysis 2025: Short Term Rental Data & Vacation Rental Statistics in British Columbia, Canada
Is Airbnb profitable in Victoria in 2025? Explore comprehensive Airbnb analytics for Victoria, British Columbia, Canada to uncover income potential. This 2025 STR market report for Victoria, based on AirROI data from April 2024 to March 2025, reveals key trends in the market of 580 active listings.
Whether you're considering an Airbnb investment in Victoria, optimizing your existing vacation rental, or exploring rental arbitrage opportunities, understanding the Victoria Airbnb data is crucial. Navigating the high regulation landscape is key to maximizing your short term rental income potential. Let's dive into the specifics.
Key Victoria Airbnb Performance Metrics Overview
Monthly Airbnb Revenue Variations & Income Potential in Victoria (2025)
Understanding the monthly revenue variations for Airbnb listings in Victoria is key to maximizing your short term rental income potential. Seasonality significantly impacts earnings. Our analysis, based on data from the past 12 months, shows that the peak revenue month for STRs in Victoria is typically August, while March often presents the lowest earnings, highlighting opportunities for strategic pricing adjustments during shoulder and low seasons. Explore the typical Airbnb income in Victoria across different performance tiers:
- Best-in-class properties (Top 10%) achieve $4,348+ monthly, often utilizing dynamic pricing and superior guest experiences.
- Strong performing properties (Top 25%) earn $2,743 or more, indicating effective management and desirable locations/amenities.
- Typical properties (Median) generate around $1,630 per month, representing the average market performance.
- Entry-level properties (Bottom 25%) see earnings around $772, often with potential for optimization.
Average Monthly Airbnb Earnings Trend in Victoria
Victoria Airbnb Occupancy Rate Trends (2025)
Maximize your bookings by understanding the Victoria STR occupancy trends. Seasonal demand shifts significantly influence how often properties are booked. Typically, Aprilsees the highest demand (peak season occupancy), while January experiences the lowest (low season). Effective strategies, like adjusting minimum stays or offering promotions, can boost occupancy during slower periods. Here's how different property tiers perform in Victoria:
- Best-in-class properties (Top 10%) achieve 88%+ occupancy, indicating high desirability and potentially optimized availability.
- Strong performing properties (Top 25%) maintain 73% or higher occupancy, suggesting good market fit and guest satisfaction.
- Typical properties (Median) have an occupancy rate around 44%.
- Entry-level properties (Bottom 25%) average 19% occupancy, potentially facing higher vacancy.
Average Monthly Occupancy Rate Trend in Victoria
Average Daily Rate (ADR) Airbnb Trends in Victoria (2025)
Effective short term rental pricing strategy in Victoria involves understanding monthly ADR fluctuations. The Average Daily Rate (ADR) for Airbnb in Victoria typically peaks in July and dips lowest during February. Leveraging Airbnb dynamic pricing tools or strategies based on this seasonality can significantly boost revenue. Here's a look at the typical nightly rates achieved:
- Best-in-class properties (Top 10%) command rates of $235+ per night, often due to premium features or locations.
- Strong performing properties (Top 25%) achieve nightly rates of $159 or more.
- Typical properties (Median) charge around $110 per night.
- Entry-level properties (Bottom 25%) earn around $81 per night.
Average Daily Rate (ADR) Trend by Month in Victoria
Get Live Victoria Market Intelligence 👇

Explore Real-time Analytics
Airbnb Seasonality Analysis & Trends in Victoria (2025)
Peak Season (August, July, September)
- Revenue averages $2,803 per month
- Occupancy rates average 50.7%
- Daily rates average $146
Shoulder Season
- Revenue averages $2,107 per month
- Occupancy maintains around 47.8%
- Daily rates hold near $134
Low Season (January, February, March)
- Revenue drops to average $1,377 per month
- Occupancy decreases to average 39.0%
- Daily rates adjust to average $119
Seasonality Insights for Victoria
- The Airbnb seasonality in Victoria shows highly seasonal trends requiring careful strategy. While the sections above show seasonal averages, it's also insightful to look at the extremes:
- During the high season, the absolute peak month showcases Victoria's highest earning potential, with monthly revenues capable of climbing to $2,968, occupancy reaching a high of 54.6%, and ADRs peaking at $148.
- Conversely, the slowest single month of the year, typically falling within the low season, marks the market's lowest point. In this month, revenue might dip to $1,339, occupancy could drop to 38.2%, and ADRs may adjust down to $118.
- Understanding both the seasonal averages and these monthly peaks and troughs in revenue, occupancy, and ADR is crucial for maximizing your Airbnb profit potential in Victoria.
Seasonal Strategies for Maximizing Profit
- Peak Season: Maximize revenue through premium pricing and potentially longer minimum stays. Ensure high availability.
- Low Season: Offer competitive pricing, special promotions (e.g., extended stay discounts), and flexible cancellation policies. Target off-season travelers like remote workers or budget-conscious guests.
- Shoulder Seasons: Implement dynamic pricing that balances peak and low rates. Target weekend travelers or specific events. Offer slightly more flexible terms than peak season.
- Regularly analyze your own performance against these Victoria seasonality benchmarks and adjust your pricing and availability strategy accordingly.
Best Areas for Airbnb Investment in Victoria (2025)
Exploring the top neighborhoods for short-term rentals in Victoria? This section highlights key areas, outlining why they are attractive for hosts and guests, along with notable local attractions. Consider these locations based on your target guest profile and investment strategy.
| Neighborhood / Area | Why Host Here? (Target Guests & Appeal) | Key Attractions & Landmarks |
|---|---|---|
| James Bay | Historic neighborhood near the Inner Harbour, featuring charming streets, parks, and close proximity to the Parliament Buildings. Ideal for tourists wanting easy access to Victoria's main attractions and waterfront views. | Royal BC Museum, Beacon Hill Park, Parliament Buildings, Fisherman's Wharf, Inner Harbour |
| Fernwood | A vibrant, artistic community known for its bohemian vibe and local culture. Popular destination for travelers seeking a unique and eclectic experience in Victoria. | Fernwood Square, The Belfry Theatre, Local art galleries, The Fernwood Inn |
| Cook Street Village | Charming neighborhood with boutique shops, cafes, and proximity to the beach. Attracts families and couples looking for a relaxed atmosphere near the ocean. | Macaulay Point Park, Cook Street Park, Dallas Road Beach, Local eateries |
| Downtown Victoria | The bustling heart of the city with a mix of shopping, dining, and cultural experiences. Great for tourists wanting to be in the center of it all with easy access to services and attractions. | Government Street, Victoria Bug Zoo, Royal BC Museum, Inner Harbour, Chinatown |
| Saanich | A larger suburban area with parks, natural beauty, and family-friendly amenities. Popular for longer-term stays and travelers wanting to explore nature while being close to the city. | Gorge Waterway, Butchart Gardens, Beacon Hill Park, Elk/Beaver Lake Regional Park |
| Oak Bay | Affluent neighborhood known for its picturesque streets, ocean views, and local shops. Attracts visitors looking for a quaint, upscale experience in Victoria. | Victoria Golf Club, Oak Bay Marina, Willows Beach, Abkahzi Garden |
| Victoria West | Up-and-coming area with waterfront access and parks. Popular among young professionals and families seeking a quieter area with recreational activities. | West Bay Marina, Songhees Walkway, Dockside Green, Macaulay Point Park |
| Esquimalt | A diverse community with a mix of military, families, and young professionals. Attractive for visitors looking for affordable lodging close to downtown Victoria. | Esquimalt Lagoon, Saxe Point Park, Cantes Park, Naden Waterfront |
Understanding Airbnb License Requirements & STR Laws in Victoria (2025)
Yes, Victoria, British Columbia, Canada enforces high STR regulations. Obtaining a license and ensuring compliance is almost certainly required according to current 2025 STR laws. Always verify the latest short term rental regulations and Airbnb license requirements directly with local government authorities for Victoria to ensure full compliance before hosting.
(Source: AirROI data, 2025, based on 34% licensed listings)
Top Performing Airbnb Properties in Victoria (2025)
Benchmark your potential! Explore examples of top-performing Airbnb properties in Victoriabased on Trailing Twelve Month (TTM) revenue. Analyze their characteristics, revenue, occupancy rate, and ADR to understand what drives success in this market.
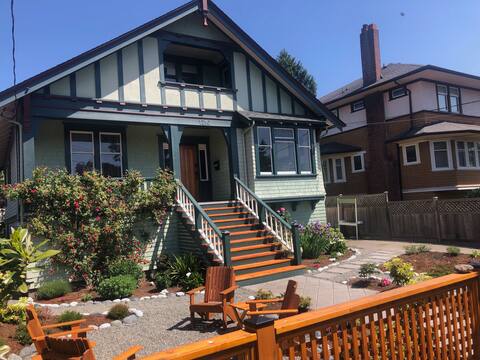
5 bedroom Home - With Hot Tub
Entire Place • 5 bedrooms
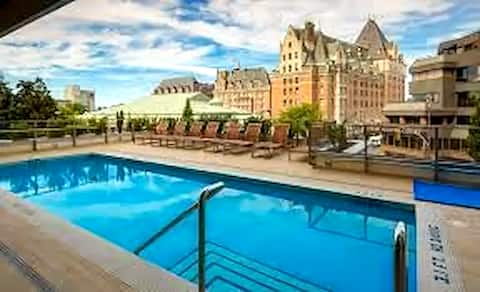
Kings Corner - Downtown Victoria - Resort Living
Entire Place • 2 bedrooms

The Shop House by Fan Tan Hotel
Entire Place • 2 bedrooms
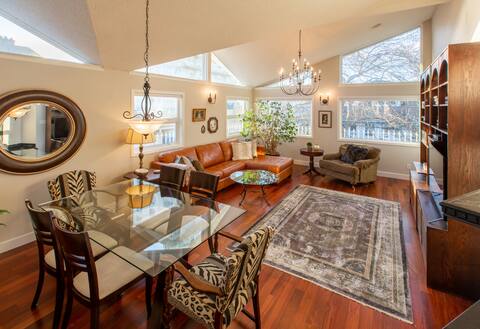
Menzies Manor #5 Penthouse - Steps from the Ocean
Entire Place • 2 bedrooms
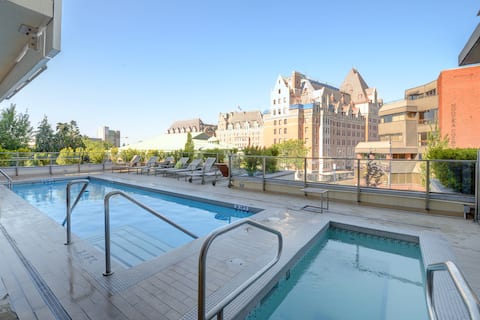
Deluxe 2 bedroom suite downtown free parking&pool
Entire Place • 2 bedrooms
Luxury King Suite w/ Ocean and Mountain Views
Entire Place • 1 bedroom
Note: Performance varies based on location, size, amenities, seasonality, and management quality. Data reflects the past 12 months.
Top Performing Airbnb Hosts in Victoria (2025)
Learn from the best! This table showcases top-performing Airbnb hosts in Victoria based on the number of properties managed and estimated total revenue over the past year. Analyze their scale and performance metrics.
| Host Name | Properties | Grossing Revenue | Stay Reviews | Avg Rating |
|---|---|---|---|---|
| Co-Hosts | 34 | $462,209 | 2470 | 4.41/5.0 |
| Steven | 15 | $320,294 | 488 | 4.61/5.0 |
| Victoria Prime Services | 10 | $298,833 | 190 | 3.43/5.0 |
| Holly | 6 | $179,437 | 359 | 4.92/5.0 |
| Evergreen Hospitality | 18 | $179,035 | 419 | 3.63/5.0 |
| Shannon | 5 | $160,516 | 275 | 4.97/5.0 |
| Drew | 1 | $158,033 | 126 | 4.85/5.0 |
| Henson | 6 | $150,166 | 599 | 4.75/5.0 |
| Host #421872890 | 18 | $146,948 | 280 | 2.32/5.0 |
| Lorie | 10 | $146,132 | 375 | 4.68/5.0 |
Analyzing the strategies of top hosts, such as their property selection, pricing, and guest communication, can offer valuable lessons for optimizing your own Airbnb operations in Victoria.
Dive Deeper: Advanced Victoria STR Market Data (2025)
Ready to unlock more insights? AirROI provides access to advanced metrics and comprehensive Airbnb data for Victoria. Explore detailed analytics beyond this report to refine your investment strategy, optimize pricing, and maximize your vacation rental profits.
Explore Advanced MetricsVictoria Short-Term Rental Market Composition (2025): Property & Room Types
Room Type Distribution
Property Type Distribution
Market Composition Insights for Victoria
- The Victoria Airbnb market composition is heavily skewed towards Entire Home/Apt listings, which make up 82.1% of the 580 active rentals. This indicates strong guest preference for privacy and space.
- Looking at the property type distribution in Victoria, Apartment/Condo properties are the most common (62.8%), reflecting the local real estate landscape.
- Houses represent a significant 15.3% portion, catering likely to families or larger groups.
- The presence of 12.1% Hotel/Boutique listings indicates integration with traditional hospitality.
- Smaller segments like outdoor/unique, unique stays (combined 0.5%) offer potential for unique stay experiences.
Victoria Airbnb Room Capacity Analysis (2025): Bedroom Distribution
Distribution of Listings by Number of Bedrooms
Room Capacity Insights for Victoria
- The dominant room capacity in Victoria is 1 bedroom listings, making up 54% of the market. This suggests a strong demand for properties suitable for couples or solo travelers.
- Together, 1 bedroom and 2 bedrooms properties represent 80.6% of the active Airbnb listings in Victoria, indicating a high concentration in these sizes.
- With over half the market (54%) consisting of studios or 1-bedroom units, Victoria is particularly well-suited for individuals or couples.
- Listings with 3+ bedrooms (6.0%) represent a smaller niche, potentially indicating an underserved market for larger group accommodations in Victoria.
Victoria Vacation Rental Guest Capacity Trends (2025)
Distribution of Listings by Guest Capacity
Guest Capacity Insights for Victoria
- The most common guest capacity trend in Victoria vacation rentals is listings accommodating 2 guests (35.5%). This suggests the primary traveler segment is likely couples or solo travelers.
- Properties designed for 2 guests and 4 guests dominate the Victoria STR market, accounting for 68.4% of listings.
- On average, properties in Victoria are equipped to host 3.2 guests.
Victoria Airbnb Booking Patterns (2025): Available vs. Booked Days
Available Days Distribution
Booked Days Distribution
Booking Pattern Insights for Victoria
- The most common availability pattern in Victoria falls within the 271-366 days range, representing 60.9% of listings. This suggests many properties have significant open periods on their calendars.
- Approximately 83.5% of listings show high availability (181+ days open annually), indicating potential for increased bookings or specific owner usage patterns.
- For booked days, the 31-90 days range is most frequent in Victoria (36.7%), reflecting common guest stay durations or potential owner blocking patterns.
- A notable 17.3% of properties secure long booking periods (181+ days booked per year), highlighting successful long-term rental strategies or significant owner usage.
Victoria Airbnb Minimum Stay Requirements Analysis
Distribution of Listings by Minimum Night Requirement
1 Night
75 listings
15.6% of total
2 Nights
23 listings
4.8% of total
3 Nights
11 listings
2.3% of total
4-6 Nights
16 listings
3.3% of total
7-29 Nights
50 listings
10.4% of total
30+ Nights
306 listings
63.6% of total
Key Insights
- The most prevalent minimum stay requirement in Victoria is 30+ Nights, adopted by 63.6% of listings. This highlights the market's preference for longer commitments.
- A significant segment (63.6%) caters to monthly stays (30+ nights) in Victoria, pointing to opportunities in the extended-stay market.
Recommendations
- Align with the market by considering a 30+ Nights minimum stay, as 63.6% of Victoria hosts use this setting.
- If feasible, allowing 1-night stays, especially midweek or during low season, could capture last-minute bookings, as only 15.6% currently do.
- Explore offering discounts for stays of 30+ nights to attract the 63.6% of the market seeking extended stays.
- Adjust minimum nights based on seasonality – potentially shorter during low season and longer during peak demand periods in Victoria.
Victoria Airbnb Cancellation Policy Trends Analysis (2025)
Super Strict 30 Days
35 listings
7.3% of total
Super Strict 60 Days
3 listings
0.6% of total
Flexible
71 listings
14.8% of total
Moderate
136 listings
28.3% of total
Firm
113 listings
23.5% of total
Strict
122 listings
25.4% of total
Cancellation Policy Insights for Victoria
- The prevailing Airbnb cancellation policy trend in Victoria is Moderate, used by 28.3% of listings.
- There's a relatively balanced mix between guest-friendly (43.1%) and stricter (48.9%) policies, offering choices for different guest needs.
Recommendations for Hosts
- Consider adopting a Moderate policy to align with the 28.3% market standard in Victoria.
- Regularly review your cancellation policy against competitors and market demand shifts in Victoria.
Victoria STR Booking Lead Time Analysis (2025)
Average Booking Lead Time by Month
Booking Lead Time Insights for Victoria
- The overall average booking lead time for vacation rentals in Victoria is 64 days.
- Guests book furthest in advance for stays during July (average 94 days), likely coinciding with peak travel demand or local events.
- The shortest booking windows occur for stays in January (average 44 days), indicating more last-minute travel plans during this time.
- Seasonally, Summer (86 days avg.) sees the longest lead times, while Winter (50 days avg.) has the shortest, reflecting typical travel planning cycles.
Recommendations for Hosts
- Use the overall average lead time (64 days) as a baseline for your pricing and availability strategy in Victoria.
- For July stays, consider implementing length-of-stay discounts or slightly higher rates for bookings made less than 94 days out to capitalize on advance planning.
- Target marketing efforts for the Summer season well in advance (at least 86 days) to capture early planners.
- Monitor your own booking lead times against these Victoria averages to identify opportunities for dynamic pricing adjustments.
Popular & Essential Airbnb Amenities in Victoria (2025)
Amenity Prevalence
Amenity Insights for Victoria
- Essential amenities in Victoria that guests expect include: Wifi, Heating, Smoke alarm. Lacking these (any) could significantly impact bookings.
- Popular amenities like Essentials, Washer, Hot water are common but not universal. Offering these can provide a competitive edge.
Recommendations for Hosts
- Ensure your listing includes all essential amenities for Victoria: Wifi, Heating, Smoke alarm.
- Prioritize adding missing essentials: Heating, Smoke alarm.
- Consider adding popular differentiators like Essentials or Washer to increase appeal.
- Highlight unique or less common amenities you offer (e.g., hot tub, dedicated workspace, EV charger) in your listing description and photos.
- Regularly check competitor amenities in Victoria to stay competitive.
Victoria Airbnb Guest Demographics & Profile Analysis (2025)
Guest Profile Summary for Victoria
- The typical guest profile for Airbnb in Victoria consists of a mix of domestic (50%) and international guests, with top international origins including United States, typically belonging to the Post-2000s (Gen Z/Alpha) group (50%), primarily speaking English or French.
- Domestic travelers account for 50.0% of guests.
- Key international markets include Canada (50%) and United States (35.5%).
- Top languages spoken are English (60.7%) followed by French (11.5%).
- A significant demographic segment is the Post-2000s (Gen Z/Alpha) group, representing 50% of guests.
Recommendations for Hosts
- Balance marketing efforts between domestic and international channels based on the guest mix.
- Tailor amenities and listing descriptions to appeal to the dominant Post-2000s (Gen Z/Alpha) demographic (e.g., highlight fast WiFi, smart home features, local guides).
- Highlight unique local experiences or amenities relevant to the primary guest profile.
- Consider seasonal promotions aligned with peak travel times for key origin markets.
Nearby Short-Term Rental Market Comparison
How does the Victoria Airbnb market stack up against its neighbors? Compare key performance metrics like average monthly revenue, ADR, and occupancy rates in surrounding areas to understand the broader regional STR landscape.
| Market | Active Properties | Monthly Revenue | Daily Rate | Avg. Occupancy |
|---|---|---|---|---|
| Erlands Point-Kitsap Lake | 11 | $6,325 | $353.76 | 56% |
| Lake Goodwin | 11 | $4,949 | $371.43 | 44% |
| Amanda Park | 10 | $4,780 | $425.06 | 46% |
| Cape George Colony Club | 10 | $4,770 | $257.49 | 59% |
| Allyn | 20 | $4,462 | $415.57 | 36% |
| Sudden Valley | 65 | $4,390 | $286.32 | 53% |
| Olalla | 14 | $4,279 | $288.96 | 53% |
| Orcas Island | 13 | $4,220 | $514.57 | 39% |
| Friday Harbor | 219 | $4,187 | $371.96 | 45% |
| Moclips | 110 | $4,108 | $367.54 | 39% |