Tofino Airbnb Market Analysis 2025: Short Term Rental Data & Vacation Rental Statistics in British Columbia, Canada
Is Airbnb profitable in Tofino in 2025? Explore comprehensive Airbnb analytics for Tofino, British Columbia, Canada to uncover income potential. This 2025 STR market report for Tofino, based on AirROI data from April 2024 to March 2025, reveals key trends in the market of 331 active listings.
Whether you're considering an Airbnb investment in Tofino, optimizing your existing vacation rental, or exploring rental arbitrage opportunities, understanding the Tofino Airbnb data is crucial. Navigating the high regulation landscape is key to maximizing your short term rental income potential. Let's dive into the specifics.
Key Tofino Airbnb Performance Metrics Overview
Monthly Airbnb Revenue Variations & Income Potential in Tofino (2025)
Understanding the monthly revenue variations for Airbnb listings in Tofino is key to maximizing your short term rental income potential. Seasonality significantly impacts earnings. Our analysis, based on data from the past 12 months, shows that the peak revenue month for STRs in Tofino is typically August, while January often presents the lowest earnings, highlighting opportunities for strategic pricing adjustments during shoulder and low seasons. Explore the typical Airbnb income in Tofino across different performance tiers:
- Best-in-class properties (Top 10%) achieve $9,819+ monthly, often utilizing dynamic pricing and superior guest experiences.
- Strong performing properties (Top 25%) earn $6,964 or more, indicating effective management and desirable locations/amenities.
- Typical properties (Median) generate around $4,585 per month, representing the average market performance.
- Entry-level properties (Bottom 25%) see earnings around $2,796, often with potential for optimization.
Average Monthly Airbnb Earnings Trend in Tofino
Tofino Airbnb Occupancy Rate Trends (2025)
Maximize your bookings by understanding the Tofino STR occupancy trends. Seasonal demand shifts significantly influence how often properties are booked. Typically, Augustsees the highest demand (peak season occupancy), while January experiences the lowest (low season). Effective strategies, like adjusting minimum stays or offering promotions, can boost occupancy during slower periods. Here's how different property tiers perform in Tofino:
- Best-in-class properties (Top 10%) achieve 85%+ occupancy, indicating high desirability and potentially optimized availability.
- Strong performing properties (Top 25%) maintain 74% or higher occupancy, suggesting good market fit and guest satisfaction.
- Typical properties (Median) have an occupancy rate around 59%.
- Entry-level properties (Bottom 25%) average 42% occupancy, potentially facing higher vacancy.
Average Monthly Occupancy Rate Trend in Tofino
Average Daily Rate (ADR) Airbnb Trends in Tofino (2025)
Effective short term rental pricing strategy in Tofino involves understanding monthly ADR fluctuations. The Average Daily Rate (ADR) for Airbnb in Tofino typically peaks in August and dips lowest during January. Leveraging Airbnb dynamic pricing tools or strategies based on this seasonality can significantly boost revenue. Here's a look at the typical nightly rates achieved:
- Best-in-class properties (Top 10%) command rates of $477+ per night, often due to premium features or locations.
- Strong performing properties (Top 25%) achieve nightly rates of $352 or more.
- Typical properties (Median) charge around $246 per night.
- Entry-level properties (Bottom 25%) earn around $165 per night.
Average Daily Rate (ADR) Trend by Month in Tofino
Get Live Tofino Market Intelligence 👇

Explore Real-time Analytics
Airbnb Seasonality Analysis & Trends in Tofino (2025)
Peak Season (August, July, June)
- Revenue averages $9,156 per month
- Occupancy rates average 79.2%
- Daily rates average $348
Shoulder Season
- Revenue averages $4,856 per month
- Occupancy maintains around 56.0%
- Daily rates hold near $273
Low Season (January, February, December)
- Revenue drops to average $2,619 per month
- Occupancy decreases to average 36.4%
- Daily rates adjust to average $234
Seasonality Insights for Tofino
- The Airbnb seasonality in Tofino shows highly seasonal trends requiring careful strategy. While the sections above show seasonal averages, it's also insightful to look at the extremes:
- During the high season, the absolute peak month showcases Tofino's highest earning potential, with monthly revenues capable of climbing to $10,201, occupancy reaching a high of 83.6%, and ADRs peaking at $357.
- Conversely, the slowest single month of the year, typically falling within the low season, marks the market's lowest point. In this month, revenue might dip to $2,241, occupancy could drop to 33.1%, and ADRs may adjust down to $228.
- Understanding both the seasonal averages and these monthly peaks and troughs in revenue, occupancy, and ADR is crucial for maximizing your Airbnb profit potential in Tofino.
Seasonal Strategies for Maximizing Profit
- Peak Season: Maximize revenue through premium pricing and potentially longer minimum stays. Ensure high availability.
- Low Season: Offer competitive pricing, special promotions (e.g., extended stay discounts), and flexible cancellation policies. Target off-season travelers like remote workers or budget-conscious guests.
- Shoulder Seasons: Implement dynamic pricing that balances peak and low rates. Target weekend travelers or specific events. Offer slightly more flexible terms than peak season.
- Regularly analyze your own performance against these Tofino seasonality benchmarks and adjust your pricing and availability strategy accordingly.
Best Areas for Airbnb Investment in Tofino (2025)
Exploring the top neighborhoods for short-term rentals in Tofino? This section highlights key areas, outlining why they are attractive for hosts and guests, along with notable local attractions. Consider these locations based on your target guest profile and investment strategy.
| Neighborhood / Area | Why Host Here? (Target Guests & Appeal) | Key Attractions & Landmarks |
|---|---|---|
| Long Beach | Stunning sandy beaches surrounded by lush rainforest and rugged coastline. Ideal for tourists looking for outdoor adventures such as surfing, kayaking, and exploring the Pacific Rim National Park. | Long Beach, Pacific Rim National Park Reserve, Tofino Botanical Gardens, Wild Pacific Trail, Schooner Cove Trail, Cox Bay Beach |
| Tofino Village | Charming small town atmosphere with a vibrant local culture. Visitors enjoy unique shops, restaurants, and art galleries, making it a great spot for tourists looking for a more local experience. | Tofino's Art Galleries, Tofino Brewing Company, Tofino Market, Shelter Restaurant, The Whale Centre, Tofino's Beaches |
| Chesterman Beach | A beautiful, expansive beach perfect for surfing and sunbathing. A popular location for families and outdoor enthusiasts seeking scenic views and recreational activities. | Chesterman Beach, Cox Bay, Surf Lessons, Kayaking, Whale Watching Tours, Beach Bonfires |
| Clayoquot Sound | A UNESCO Biosphere Reserve known for its breathtaking landscapes and rich biodiversity. Ideal for eco-tourism and attracting nature enthusiasts. | Clayoquot Sound, Hot Springs Cove, Kayaking in the Sound, Whale Watching, Bear Viewing Tours |
| MacKenzie Beach | A cozy beach area known for its stunning sunsets and calm waters. Great for families and those looking to relax by the ocean. | MacKenzie Beach, Surfing Rentals, Beach Volleyball, Nearby Cafes and Shops, Sunset Viewing Areas |
| Meares Island | A cultural and natural wonder famous for its ancient cedar trees. An important site for Indigenous culture and nature-based activities. | Meares Island Trails, Cedar Tree Groves, Indigenous Cultural Tours, Pacific Rim National Park |
| Pacific Rim National Park | A protected wilderness area that offers a mix of rugged coastal scenery and lush rainforests, excellent for outdoor recreation and wildlife viewing. | Rainforest Trails, Beaches, Wildlife Viewing, Campsites, Interpretive Centers |
| Ty Histanis | A serene and scenic area with beautiful views and a tranquil atmosphere, perfect for visitors looking for a peaceful retreat from the busyness of Tofino. | Ty Histanis Beach, Local Artisans, Nature Trails, Scenic Viewpoints |
Understanding Airbnb License Requirements & STR Laws in Tofino (2025)
Yes, Tofino, British Columbia, Canada enforces high STR regulations. Obtaining a license and ensuring compliance is almost certainly required according to current 2025 STR laws. Always verify the latest short term rental regulations and Airbnb license requirements directly with local government authorities for Tofino to ensure full compliance before hosting.
(Source: AirROI data, 2025, based on 85% licensed listings)
Top Performing Airbnb Properties in Tofino (2025)
Benchmark your potential! Explore examples of top-performing Airbnb properties in Tofinobased on Trailing Twelve Month (TTM) revenue. Analyze their characteristics, revenue, occupancy rate, and ADR to understand what drives success in this market.
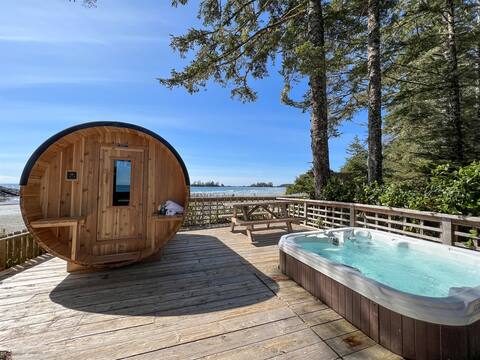
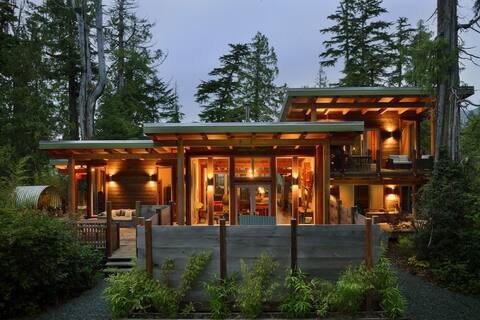
Oceans Edge: Chesterman Beachfront, Hot Tub,Views
Entire Place • 3 bedrooms

Surfside Lodge: Beachfront, Hot Tub, Sauna, View
Entire Place • 3 bedrooms

Alaqua on the Beach: Directly on Chesterman Beach!
Entire Place • 3 bedrooms
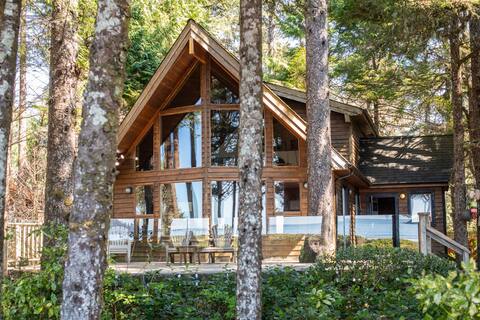
The Tofino Beach House
Entire Place • 2 bedrooms

Coastal View: Tranquil, Luxury, Hot Tub & Sauna!
Entire Place • 3 bedrooms
Tofino Retreat • Waterfront • Hot Tub • Sauna
Entire Place • 3 bedrooms
Note: Performance varies based on location, size, amenities, seasonality, and management quality. Data reflects the past 12 months.
Top Performing Airbnb Hosts in Tofino (2025)
Learn from the best! This table showcases top-performing Airbnb hosts in Tofino based on the number of properties managed and estimated total revenue over the past year. Analyze their scale and performance metrics.
| Host Name | Properties | Grossing Revenue | Stay Reviews | Avg Rating |
|---|---|---|---|---|
| Danielle | 29 | $2,910,695 | 2046 | 4.89/5.0 |
| Stay Tofino | 30 | $2,086,270 | 5166 | 4.84/5.0 |
| Chris | 8 | $621,750 | 847 | 4.81/5.0 |
| Host #122383171 | 5 | $355,166 | 815 | 4.83/5.0 |
| Todd | 4 | $341,307 | 381 | 4.99/5.0 |
| Jonny | 4 | $295,875 | 122 | 4.88/5.0 |
| Dawn | 2 | $217,219 | 310 | 4.94/5.0 |
| Elin | 4 | $214,259 | 1003 | 3.69/5.0 |
| Erika | 4 | $212,446 | 588 | 4.84/5.0 |
| Angus | 3 | $203,509 | 454 | 4.95/5.0 |
Analyzing the strategies of top hosts, such as their property selection, pricing, and guest communication, can offer valuable lessons for optimizing your own Airbnb operations in Tofino.
Dive Deeper: Advanced Tofino STR Market Data (2025)
Ready to unlock more insights? AirROI provides access to advanced metrics and comprehensive Airbnb data for Tofino. Explore detailed analytics beyond this report to refine your investment strategy, optimize pricing, and maximize your vacation rental profits.
Explore Advanced MetricsTofino Short-Term Rental Market Composition (2025): Property & Room Types
Room Type Distribution
Property Type Distribution
Market Composition Insights for Tofino
- The Tofino Airbnb market composition is heavily skewed towards Entire Home/Apt listings, which make up 88.5% of the 331 active rentals. This indicates strong guest preference for privacy and space.
- Looking at the property type distribution in Tofino, House properties are the most common (43.5%), reflecting the local real estate landscape.
- Houses represent a significant 43.5% portion, catering likely to families or larger groups.
- The presence of 10.3% Hotel/Boutique listings indicates integration with traditional hospitality.
- Smaller segments like unique stays (combined 1.5%) offer potential for unique stay experiences.
Tofino Airbnb Room Capacity Analysis (2025): Bedroom Distribution
Distribution of Listings by Number of Bedrooms
Room Capacity Insights for Tofino
- The dominant room capacity in Tofino is 1 bedroom listings, making up 32.6% of the market. This suggests a strong demand for properties suitable for couples or solo travelers.
- Together, 1 bedroom and 3 bedrooms properties represent 64.9% of the active Airbnb listings in Tofino, indicating a high concentration in these sizes.
- A significant 33.2% of listings offer 3+ bedrooms, catering to larger groups and families seeking more space in Tofino.
Tofino Vacation Rental Guest Capacity Trends (2025)
Distribution of Listings by Guest Capacity
Guest Capacity Insights for Tofino
- The most common guest capacity trend in Tofino vacation rentals is listings accommodating 6 guests (35.6%). This suggests the primary traveler segment is likely larger groups.
- Properties designed for 6 guests and 4 guests dominate the Tofino STR market, accounting for 62.8% of listings.
- 36.5% of properties accommodate 6+ guests, serving the market segment for larger families or group travel in Tofino.
- On average, properties in Tofino are equipped to host 4.1 guests.
Tofino Airbnb Booking Patterns (2025): Available vs. Booked Days
Available Days Distribution
Booked Days Distribution
Booking Pattern Insights for Tofino
- The most common availability pattern in Tofino falls within the 91-180 days range, representing 45.6% of listings. This suggests many properties have significant open periods on their calendars.
- Approximately 41.7% of listings show high availability (181+ days open annually), indicating potential for increased bookings or specific owner usage patterns.
- For booked days, the 181-270 days range is most frequent in Tofino (45.9%), reflecting common guest stay durations or potential owner blocking patterns.
- A notable 59.8% of properties secure long booking periods (181+ days booked per year), highlighting successful long-term rental strategies or significant owner usage.
Tofino Airbnb Minimum Stay Requirements Analysis
Distribution of Listings by Minimum Night Requirement
1 Night
31 listings
9.7% of total
2 Nights
144 listings
45% of total
3 Nights
40 listings
12.5% of total
4-6 Nights
7 listings
2.2% of total
7-29 Nights
3 listings
0.9% of total
30+ Nights
95 listings
29.7% of total
Key Insights
- The most prevalent minimum stay requirement in Tofino is 2 Nights, adopted by 45% of listings. This highlights the market's preference for shorter, flexible bookings.
- A significant segment (29.7%) caters to monthly stays (30+ nights) in Tofino, pointing to opportunities in the extended-stay market.
Recommendations
- Align with the market by considering a 2 Nights minimum stay, as 45% of Tofino hosts use this setting.
- If feasible, allowing 1-night stays, especially midweek or during low season, could capture last-minute bookings, as only 9.7% currently do.
- A 2-night minimum appears standard (45%). Consider this for weekends or peak periods.
- Explore offering discounts for stays of 30+ nights to attract the 29.7% of the market seeking extended stays.
- Adjust minimum nights based on seasonality – potentially shorter during low season and longer during peak demand periods in Tofino.
Tofino Airbnb Cancellation Policy Trends Analysis (2025)
Super Strict 60 Days
3 listings
0.9% of total
Super Strict 30 Days
41 listings
12.7% of total
Flexible
20 listings
6.2% of total
Moderate
47 listings
14.6% of total
Firm
105 listings
32.6% of total
Strict
106 listings
32.9% of total
Cancellation Policy Insights for Tofino
- The prevailing Airbnb cancellation policy trend in Tofino is Strict, used by 32.9% of listings.
- A majority (65.5%) of hosts in Tofino utilize Firm or Strict policies, indicating a market where hosts prioritize booking security.
Recommendations for Hosts
- Consider adopting a Strict policy to align with the 32.9% market standard in Tofino.
- With 32.9% using Strict terms, this is a viable option in Tofino, particularly for high-value properties or during peak demand periods.
- Regularly review your cancellation policy against competitors and market demand shifts in Tofino.
Tofino STR Booking Lead Time Analysis (2025)
Average Booking Lead Time by Month
Booking Lead Time Insights for Tofino
- The overall average booking lead time for vacation rentals in Tofino is 77 days.
- Guests book furthest in advance for stays during July (average 139 days), likely coinciding with peak travel demand or local events.
- The shortest booking windows occur for stays in February (average 47 days), indicating more last-minute travel plans during this time.
- Seasonally, Summer (126 days avg.) sees the longest lead times, while Winter (53 days avg.) has the shortest, reflecting typical travel planning cycles.
Recommendations for Hosts
- Use the overall average lead time (77 days) as a baseline for your pricing and availability strategy in Tofino.
- For July stays, consider implementing length-of-stay discounts or slightly higher rates for bookings made less than 139 days out to capitalize on advance planning.
- Target marketing efforts for the Summer season well in advance (at least 126 days) to capture early planners.
- Monitor your own booking lead times against these Tofino averages to identify opportunities for dynamic pricing adjustments.
Popular & Essential Airbnb Amenities in Tofino (2025)
Amenity Prevalence
Amenity Insights for Tofino
- Essential amenities in Tofino that guests expect include: Heating, Smoke alarm, Wifi, Essentials, Free parking on premises. Lacking these (any) could significantly impact bookings.
- Popular amenities like Hot water, Hair dryer, Coffee maker are common but not universal. Offering these can provide a competitive edge.
Recommendations for Hosts
- Ensure your listing includes all essential amenities for Tofino: Heating, Smoke alarm, Wifi, Essentials, Free parking on premises.
- Prioritize adding missing essentials: Heating, Smoke alarm, Wifi, Essentials, Free parking on premises.
- Consider adding popular differentiators like Hot water or Hair dryer to increase appeal.
- Highlight unique or less common amenities you offer (e.g., hot tub, dedicated workspace, EV charger) in your listing description and photos.
- Regularly check competitor amenities in Tofino to stay competitive.
Tofino Airbnb Guest Demographics & Profile Analysis (2025)
Guest Profile Summary for Tofino
- The typical guest profile for Airbnb in Tofino consists of a mix of domestic (64%) and international guests, often arriving from nearby Vancouver, typically belonging to the Post-2000s (Gen Z/Alpha) group (50%), primarily speaking English or French.
- Domestic travelers account for 64.0% of guests.
- Key international markets include Canada (64%) and United States (18.4%).
- Top languages spoken are English (63.3%) followed by French (11.9%).
- A significant demographic segment is the Post-2000s (Gen Z/Alpha) group, representing 50% of guests.
Recommendations for Hosts
- Target domestic marketing efforts towards travelers from Vancouver and Victoria.
- Tailor amenities and listing descriptions to appeal to the dominant Post-2000s (Gen Z/Alpha) demographic (e.g., highlight fast WiFi, smart home features, local guides).
- Highlight unique local experiences or amenities relevant to the primary guest profile.
- Consider seasonal promotions aligned with peak travel times for key origin markets.
Nearby Short-Term Rental Market Comparison
How does the Tofino Airbnb market stack up against its neighbors? Compare key performance metrics like average monthly revenue, ADR, and occupancy rates in surrounding areas to understand the broader regional STR landscape.
| Market | Active Properties | Monthly Revenue | Daily Rate | Avg. Occupancy |
|---|---|---|---|---|
| Ucluelet | 344 | $3,256 | $221.35 | 51% |
| Beaver | 14 | $3,205 | $245.01 | 54% |
| Sekiu | 35 | $3,138 | $235.66 | 49% |
| Clallam Bay | 11 | $3,072 | $211.28 | 58% |
| Juan de Fuca Electoral Area | 300 | $3,025 | $226.57 | 48% |
| Area I (Youbou / Meade Creek) | 47 | $2,942 | $295.81 | 42% |
| Clallam County | 21 | $2,902 | $260.95 | 45% |
| Area C (Long Beach) | 80 | $2,692 | $192.12 | 54% |
| Area D (Sproat Lake) | 47 | $2,669 | $272.99 | 45% |
| Area C (Puntledge/Black Creek) | 219 | $2,431 | $211.20 | 48% |