Squamish Airbnb Market Analysis 2025: Short Term Rental Data & Vacation Rental Statistics in British Columbia, Canada
Is Airbnb profitable in Squamish in 2025? Explore comprehensive Airbnb analytics for Squamish, British Columbia, Canada to uncover income potential. This 2025 STR market report for Squamish, based on AirROI data from April 2024 to March 2025, reveals key trends in the market of 236 active listings.
Whether you're considering an Airbnb investment in Squamish, optimizing your existing vacation rental, or exploring rental arbitrage opportunities, understanding the Squamish Airbnb data is crucial. Navigating the high regulation landscape is key to maximizing your short term rental income potential. Let's dive into the specifics.
Key Squamish Airbnb Performance Metrics Overview
Monthly Airbnb Revenue Variations & Income Potential in Squamish (2025)
Understanding the monthly revenue variations for Airbnb listings in Squamish is key to maximizing your short term rental income potential. Seasonality significantly impacts earnings. Our analysis, based on data from the past 12 months, shows that the peak revenue month for STRs in Squamish is typically July, while March often presents the lowest earnings, highlighting opportunities for strategic pricing adjustments during shoulder and low seasons. Explore the typical Airbnb income in Squamish across different performance tiers:
- Best-in-class properties (Top 10%) achieve $7,681+ monthly, often utilizing dynamic pricing and superior guest experiences.
- Strong performing properties (Top 25%) earn $4,606 or more, indicating effective management and desirable locations/amenities.
- Typical properties (Median) generate around $2,678 per month, representing the average market performance.
- Entry-level properties (Bottom 25%) see earnings around $1,585, often with potential for optimization.
Average Monthly Airbnb Earnings Trend in Squamish
Squamish Airbnb Occupancy Rate Trends (2025)
Maximize your bookings by understanding the Squamish STR occupancy trends. Seasonal demand shifts significantly influence how often properties are booked. Typically, Julysees the highest demand (peak season occupancy), while April experiences the lowest (low season). Effective strategies, like adjusting minimum stays or offering promotions, can boost occupancy during slower periods. Here's how different property tiers perform in Squamish:
- Best-in-class properties (Top 10%) achieve 89%+ occupancy, indicating high desirability and potentially optimized availability.
- Strong performing properties (Top 25%) maintain 78% or higher occupancy, suggesting good market fit and guest satisfaction.
- Typical properties (Median) have an occupancy rate around 59%.
- Entry-level properties (Bottom 25%) average 35% occupancy, potentially facing higher vacancy.
Average Monthly Occupancy Rate Trend in Squamish
Average Daily Rate (ADR) Airbnb Trends in Squamish (2025)
Effective short term rental pricing strategy in Squamish involves understanding monthly ADR fluctuations. The Average Daily Rate (ADR) for Airbnb in Squamish typically peaks in December and dips lowest during April. Leveraging Airbnb dynamic pricing tools or strategies based on this seasonality can significantly boost revenue. Here's a look at the typical nightly rates achieved:
- Best-in-class properties (Top 10%) command rates of $438+ per night, often due to premium features or locations.
- Strong performing properties (Top 25%) achieve nightly rates of $266 or more.
- Typical properties (Median) charge around $140 per night.
- Entry-level properties (Bottom 25%) earn around $92 per night.
Average Daily Rate (ADR) Trend by Month in Squamish
Get Live Squamish Market Intelligence 👇

Explore Real-time Analytics
Airbnb Seasonality Analysis & Trends in Squamish (2025)
Peak Season (July, August, June)
- Revenue averages $5,038 per month
- Occupancy rates average 68.5%
- Daily rates average $204
Shoulder Season
- Revenue averages $3,430 per month
- Occupancy maintains around 52.5%
- Daily rates hold near $202
Low Season (February, March, November)
- Revenue drops to average $2,561 per month
- Occupancy decreases to average 48.9%
- Daily rates adjust to average $202
Seasonality Insights for Squamish
- The Airbnb seasonality in Squamish shows highly seasonal trends requiring careful strategy. While the sections above show seasonal averages, it's also insightful to look at the extremes:
- During the high season, the absolute peak month showcases Squamish's highest earning potential, with monthly revenues capable of climbing to $5,208, occupancy reaching a high of 72.6%, and ADRs peaking at $214.
- Conversely, the slowest single month of the year, typically falling within the low season, marks the market's lowest point. In this month, revenue might dip to $2,538, occupancy could drop to 45.0%, and ADRs may adjust down to $194.
- Understanding both the seasonal averages and these monthly peaks and troughs in revenue, occupancy, and ADR is crucial for maximizing your Airbnb profit potential in Squamish.
Seasonal Strategies for Maximizing Profit
- Peak Season: Maximize revenue through premium pricing and potentially longer minimum stays. Ensure high availability.
- Low Season: Offer competitive pricing, special promotions (e.g., extended stay discounts), and flexible cancellation policies. Target off-season travelers like remote workers or budget-conscious guests.
- Shoulder Seasons: Implement dynamic pricing that balances peak and low rates. Target weekend travelers or specific events. Offer slightly more flexible terms than peak season.
- Regularly analyze your own performance against these Squamish seasonality benchmarks and adjust your pricing and availability strategy accordingly.
Best Areas for Airbnb Investment in Squamish (2025)
Exploring the top neighborhoods for short-term rentals in Squamish? This section highlights key areas, outlining why they are attractive for hosts and guests, along with notable local attractions. Consider these locations based on your target guest profile and investment strategy.
| Neighborhood / Area | Why Host Here? (Target Guests & Appeal) | Key Attractions & Landmarks |
|---|---|---|
| Garibaldi Highlands | A suburban area with stunning mountain views, close to outdoor recreation opportunities. Ideal for guests seeking a peaceful environment yet just minutes from Squamish's attractions. | Alice Lake Provincial Park, Garibaldi Provincial Park, Sea to Sky Gondola, Brackendale Eagles Provincial Park |
| Downtown Squamish | The vibrant heart of Squamish, offering a mix of local shops, cafes, and dining options. Perfect for guests who want to experience local culture and convenience. | Squamish Adventure Centre, Sea to Sky Highway, Eagle Run Park, Squamish Marina |
| Squamish Valley | Scenic valley known for its breathtaking landscapes and outdoor activities. Attracted visitors who enjoy hiking, biking, and nature experiences. | Elfin Lakes, Sky Pilot Mountain, Diamond Head, Porteau Cove Provincial Park |
| Chalet-style homes near Shannon Falls | Close to one of Canada’s most stunning waterfalls, great for tourists looking for unique accommodation in a natural setting. | Shannon Falls Provincial Park, Sea to Sky Gondola, Stawamus Chief Mountain |
| Brackendale | Famous for its eagle watching and proximity to nature. Great for guests interested in wildlife and outdoor activities. | Brackendale Eagles Provincial Park, Squamish River, Nature parks and trails |
| Sea to Sky Gondola area | Iconic attraction offering breathtaking views of the surrounding mountains and fjords. Popular with tourists seeking adventure and stunning scenery. | Sea to Sky Gondola, Lookout Cafe, Hiking trails |
| Garibaldi Park | A bit remote but a paradise for outdoor enthusiasts. Perfect for those wanting to escape the city and explore nature. | Hiking trails, Camping spots, Stunnning viewpoints |
| Further North near Whistler | For guests looking for an extended stay near both Squamish and Whistler, combining relaxation with skiing and outdoor adventures. | Whistler Ski Resort, Blackcomb Mountains, Outdoor sports |
Understanding Airbnb License Requirements & STR Laws in Squamish (2025)
Yes, Squamish, British Columbia, Canada enforces high STR regulations. Obtaining a license and ensuring compliance is almost certainly required according to current 2025 STR laws. Always verify the latest short term rental regulations and Airbnb license requirements directly with local government authorities for Squamish to ensure full compliance before hosting.
(Source: AirROI data, 2025, based on 59% licensed listings)
Top Performing Airbnb Properties in Squamish (2025)
Benchmark your potential! Explore examples of top-performing Airbnb properties in Squamishbased on Trailing Twelve Month (TTM) revenue. Analyze their characteristics, revenue, occupancy rate, and ADR to understand what drives success in this market.
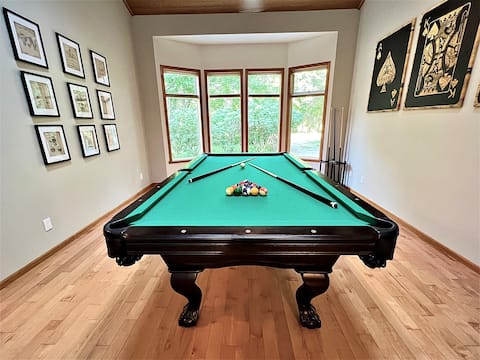
Garibaldi Getaway: hot tub, pool tbl, fire pit &EV
Entire Place • 5 bedrooms
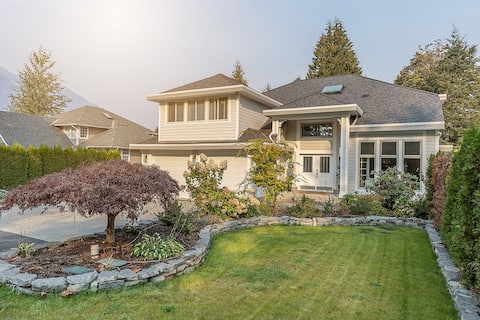
Beautiful, Bright, 4000sf Family Home.
Entire Place • 5 bedrooms
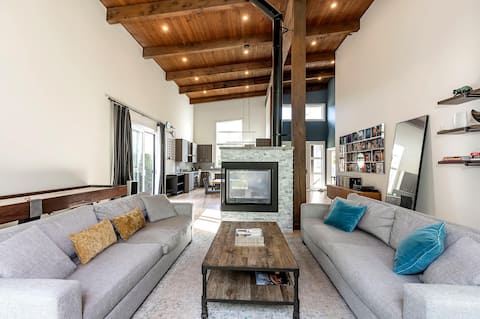
Large Modern Home in Squamish
Entire Place • 3 bedrooms

Waterfront Cabin and sauna, very private! #8920
Entire Place • 1 bedroom

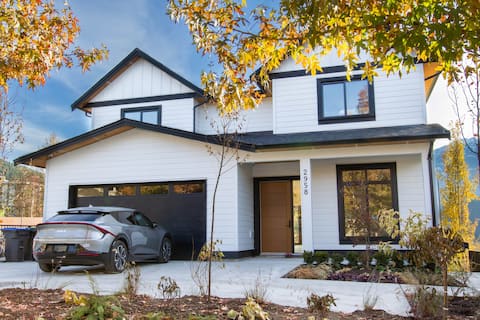
Modern House in the Mountains!
Entire Place • 4 bedrooms
Mountain View Home w/ Gym, Sauna & Cold Plunge
Entire Place • 4 bedrooms
Note: Performance varies based on location, size, amenities, seasonality, and management quality. Data reflects the past 12 months.
Top Performing Airbnb Hosts in Squamish (2025)
Learn from the best! This table showcases top-performing Airbnb hosts in Squamish based on the number of properties managed and estimated total revenue over the past year. Analyze their scale and performance metrics.
| Host Name | Properties | Grossing Revenue | Stay Reviews | Avg Rating |
|---|---|---|---|---|
| Maria | 3 | $193,441 | 2339 | 4.91/5.0 |
| Saul | 2 | $174,072 | 94 | 4.89/5.0 |
| Squamish Adventure Inn | 13 | $167,837 | 1006 | 4.67/5.0 |
| Ali | 1 | $130,000 | 66 | 4.97/5.0 |
| Laura | 1 | $128,596 | 71 | 4.77/5.0 |
| Karl | 1 | $124,832 | 37 | 4.95/5.0 |
| Jenny | 2 | $122,008 | 778 | 4.97/5.0 |
| Rebecca | 1 | $110,310 | 10 | 5.00/5.0 |
| Nathan | 1 | $107,980 | 19 | 4.95/5.0 |
| Monte | 1 | $102,841 | 147 | 4.92/5.0 |
Analyzing the strategies of top hosts, such as their property selection, pricing, and guest communication, can offer valuable lessons for optimizing your own Airbnb operations in Squamish.
Dive Deeper: Advanced Squamish STR Market Data (2025)
Ready to unlock more insights? AirROI provides access to advanced metrics and comprehensive Airbnb data for Squamish. Explore detailed analytics beyond this report to refine your investment strategy, optimize pricing, and maximize your vacation rental profits.
Explore Advanced MetricsSquamish Short-Term Rental Market Composition (2025): Property & Room Types
Room Type Distribution
Property Type Distribution
Market Composition Insights for Squamish
- The Squamish Airbnb market composition is heavily skewed towards Entire Home/Apt listings, which make up 83.5% of the 236 active rentals. This indicates strong guest preference for privacy and space.
- Looking at the property type distribution in Squamish, House properties are the most common (55.5%), reflecting the local real estate landscape.
- Houses represent a significant 55.5% portion, catering likely to families or larger groups.
- The presence of 10.2% Hotel/Boutique listings indicates integration with traditional hospitality.
- Smaller segments like outdoor/unique (combined 4.7%) offer potential for unique stay experiences.
Squamish Airbnb Room Capacity Analysis (2025): Bedroom Distribution
Distribution of Listings by Number of Bedrooms
Room Capacity Insights for Squamish
- The dominant room capacity in Squamish is 1 bedroom listings, making up 39.4% of the market. This suggests a strong demand for properties suitable for couples or solo travelers.
- Together, 1 bedroom and 3 bedrooms properties represent 57.6% of the active Airbnb listings in Squamish, indicating a high concentration in these sizes.
- A significant 33.1% of listings offer 3+ bedrooms, catering to larger groups and families seeking more space in Squamish.
Squamish Vacation Rental Guest Capacity Trends (2025)
Distribution of Listings by Guest Capacity
Guest Capacity Insights for Squamish
- The most common guest capacity trend in Squamish vacation rentals is listings accommodating 2 guests (28.8%). This suggests the primary traveler segment is likely couples or solo travelers.
- Properties designed for 2 guests and 6 guests dominate the Squamish STR market, accounting for 46.2% of listings.
- 36.0% of properties accommodate 6+ guests, serving the market segment for larger families or group travel in Squamish.
- On average, properties in Squamish are equipped to host 4.1 guests.
Squamish Airbnb Booking Patterns (2025): Available vs. Booked Days
Available Days Distribution
Booked Days Distribution
Booking Pattern Insights for Squamish
- The most common availability pattern in Squamish falls within the 91-180 days range, representing 32.6% of listings. This suggests many properties have significant open periods on their calendars.
- Approximately 55.1% of listings show high availability (181+ days open annually), indicating potential for increased bookings or specific owner usage patterns.
- For booked days, the 181-270 days range is most frequent in Squamish (32.2%), reflecting common guest stay durations or potential owner blocking patterns.
- A notable 45.8% of properties secure long booking periods (181+ days booked per year), highlighting successful long-term rental strategies or significant owner usage.
Squamish Airbnb Minimum Stay Requirements Analysis
Distribution of Listings by Minimum Night Requirement
1 Night
29 listings
13.6% of total
2 Nights
58 listings
27.1% of total
3 Nights
27 listings
12.6% of total
4-6 Nights
16 listings
7.5% of total
7-29 Nights
14 listings
6.5% of total
30+ Nights
70 listings
32.7% of total
Key Insights
- The most prevalent minimum stay requirement in Squamish is 30+ Nights, adopted by 32.7% of listings. This highlights the market's preference for longer commitments.
- A significant segment (32.7%) caters to monthly stays (30+ nights) in Squamish, pointing to opportunities in the extended-stay market.
Recommendations
- Align with the market by considering a 30+ Nights minimum stay, as 32.7% of Squamish hosts use this setting.
- If feasible, allowing 1-night stays, especially midweek or during low season, could capture last-minute bookings, as only 13.6% currently do.
- Explore offering discounts for stays of 30+ nights to attract the 32.7% of the market seeking extended stays.
- Adjust minimum nights based on seasonality – potentially shorter during low season and longer during peak demand periods in Squamish.
Squamish Airbnb Cancellation Policy Trends Analysis (2025)
Super Strict 60 Days
1 listings
0.5% of total
Flexible
20 listings
9.6% of total
Moderate
63 listings
30.3% of total
Firm
71 listings
34.1% of total
Strict
53 listings
25.5% of total
Cancellation Policy Insights for Squamish
- The prevailing Airbnb cancellation policy trend in Squamish is Firm, used by 34.1% of listings.
- A majority (59.6%) of hosts in Squamish utilize Firm or Strict policies, indicating a market where hosts prioritize booking security.
Recommendations for Hosts
- Consider adopting a Firm policy to align with the 34.1% market standard in Squamish.
- Regularly review your cancellation policy against competitors and market demand shifts in Squamish.
Squamish STR Booking Lead Time Analysis (2025)
Average Booking Lead Time by Month
Booking Lead Time Insights for Squamish
- The overall average booking lead time for vacation rentals in Squamish is 63 days.
- Guests book furthest in advance for stays during July (average 105 days), likely coinciding with peak travel demand or local events.
- The shortest booking windows occur for stays in February (average 42 days), indicating more last-minute travel plans during this time.
- Seasonally, Summer (90 days avg.) sees the longest lead times, while Winter (50 days avg.) has the shortest, reflecting typical travel planning cycles.
Recommendations for Hosts
- Use the overall average lead time (63 days) as a baseline for your pricing and availability strategy in Squamish.
- For July stays, consider implementing length-of-stay discounts or slightly higher rates for bookings made less than 105 days out to capitalize on advance planning.
- Target marketing efforts for the Summer season well in advance (at least 90 days) to capture early planners.
- Monitor your own booking lead times against these Squamish averages to identify opportunities for dynamic pricing adjustments.
Popular & Essential Airbnb Amenities in Squamish (2025)
Amenity Prevalence
Amenity Insights for Squamish
- Essential amenities in Squamish that guests expect include: Smoke alarm, Wifi, Heating. Lacking these (any) could significantly impact bookings.
- Popular amenities like Free parking on premises, Hot water, Dishes and silverware are common but not universal. Offering these can provide a competitive edge.
Recommendations for Hosts
- Ensure your listing includes all essential amenities for Squamish: Smoke alarm, Wifi, Heating.
- Prioritize adding missing essentials: Smoke alarm, Wifi, Heating.
- Consider adding popular differentiators like Free parking on premises or Hot water to increase appeal.
- Highlight unique or less common amenities you offer (e.g., hot tub, dedicated workspace, EV charger) in your listing description and photos.
- Regularly check competitor amenities in Squamish to stay competitive.
Squamish Airbnb Guest Demographics & Profile Analysis (2025)
Guest Profile Summary for Squamish
- The typical guest profile for Airbnb in Squamish consists of a mix of domestic (46%) and international guests, with top international origins including United States, typically belonging to the Post-2000s (Gen Z/Alpha) group (50%), primarily speaking English or French.
- Domestic travelers account for 46.2% of guests.
- Key international markets include Canada (46.2%) and United States (38.2%).
- Top languages spoken are English (63%) followed by French (10.1%).
- A significant demographic segment is the Post-2000s (Gen Z/Alpha) group, representing 50% of guests.
Recommendations for Hosts
- Balance marketing efforts between domestic and international channels based on the guest mix.
- Tailor amenities and listing descriptions to appeal to the dominant Post-2000s (Gen Z/Alpha) demographic (e.g., highlight fast WiFi, smart home features, local guides).
- Highlight unique local experiences or amenities relevant to the primary guest profile.
- Consider seasonal promotions aligned with peak travel times for key origin markets.
Nearby Short-Term Rental Market Comparison
How does the Squamish Airbnb market stack up against its neighbors? Compare key performance metrics like average monthly revenue, ADR, and occupancy rates in surrounding areas to understand the broader regional STR landscape.
| Market | Active Properties | Monthly Revenue | Daily Rate | Avg. Occupancy |
|---|---|---|---|---|
| Lake Goodwin | 11 | $4,949 | $371.43 | 44% |
| Cape George Colony Club | 10 | $4,770 | $257.49 | 59% |
| Sudden Valley | 65 | $4,390 | $286.32 | 53% |
| Orcas Island | 13 | $4,220 | $514.57 | 39% |
| Friday Harbor | 219 | $4,187 | $371.96 | 45% |
| Eastsound | 260 | $4,048 | $335.49 | 43% |
| Lopez Island | 40 | $4,002 | $343.46 | 41% |
| Oak Harbor | 128 | $3,944 | $279.04 | 49% |
| Warm Beach | 14 | $3,769 | $282.16 | 44% |
| Greenbank | 42 | $3,729 | $322.97 | 43% |